Data Analysis Methods: Qualitative & Quantitative Report
VerifiedAdded on  2023/06/14
|13
|1256
|146
Report
AI Summary
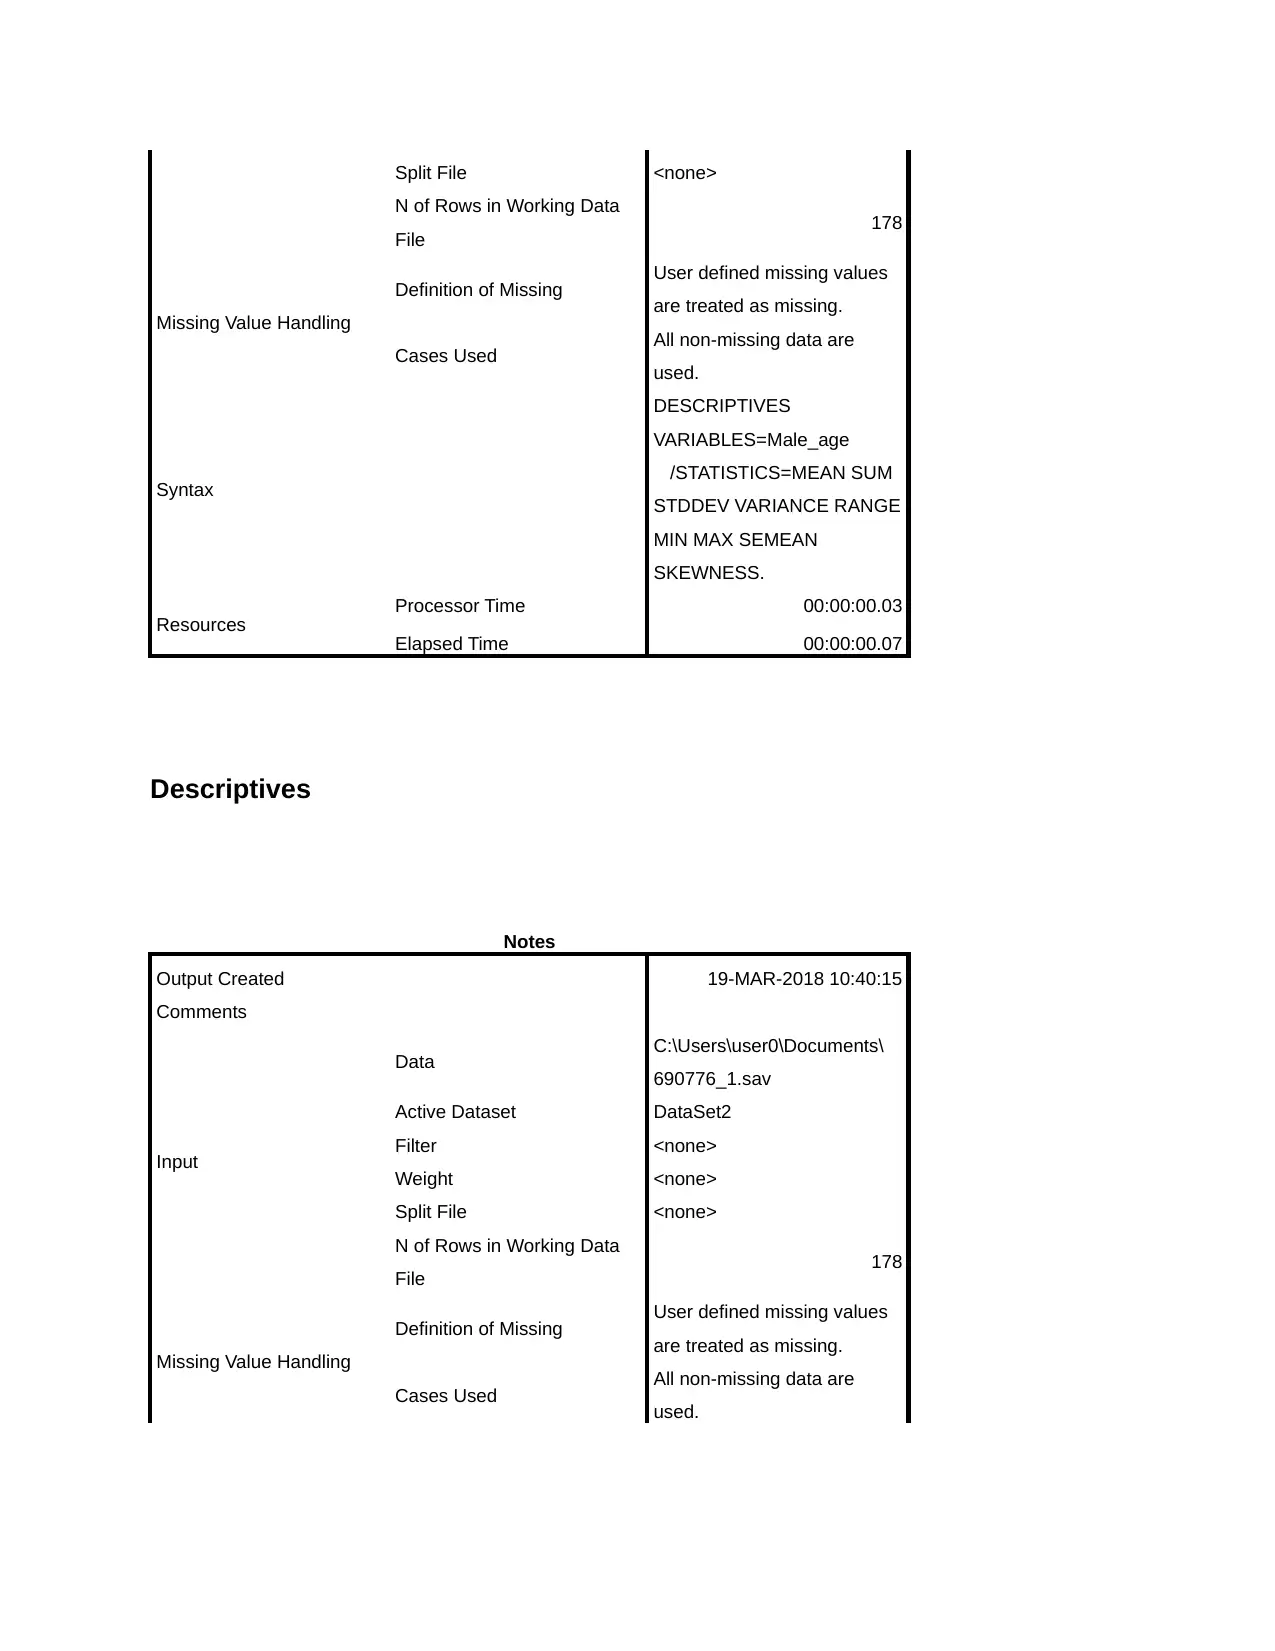
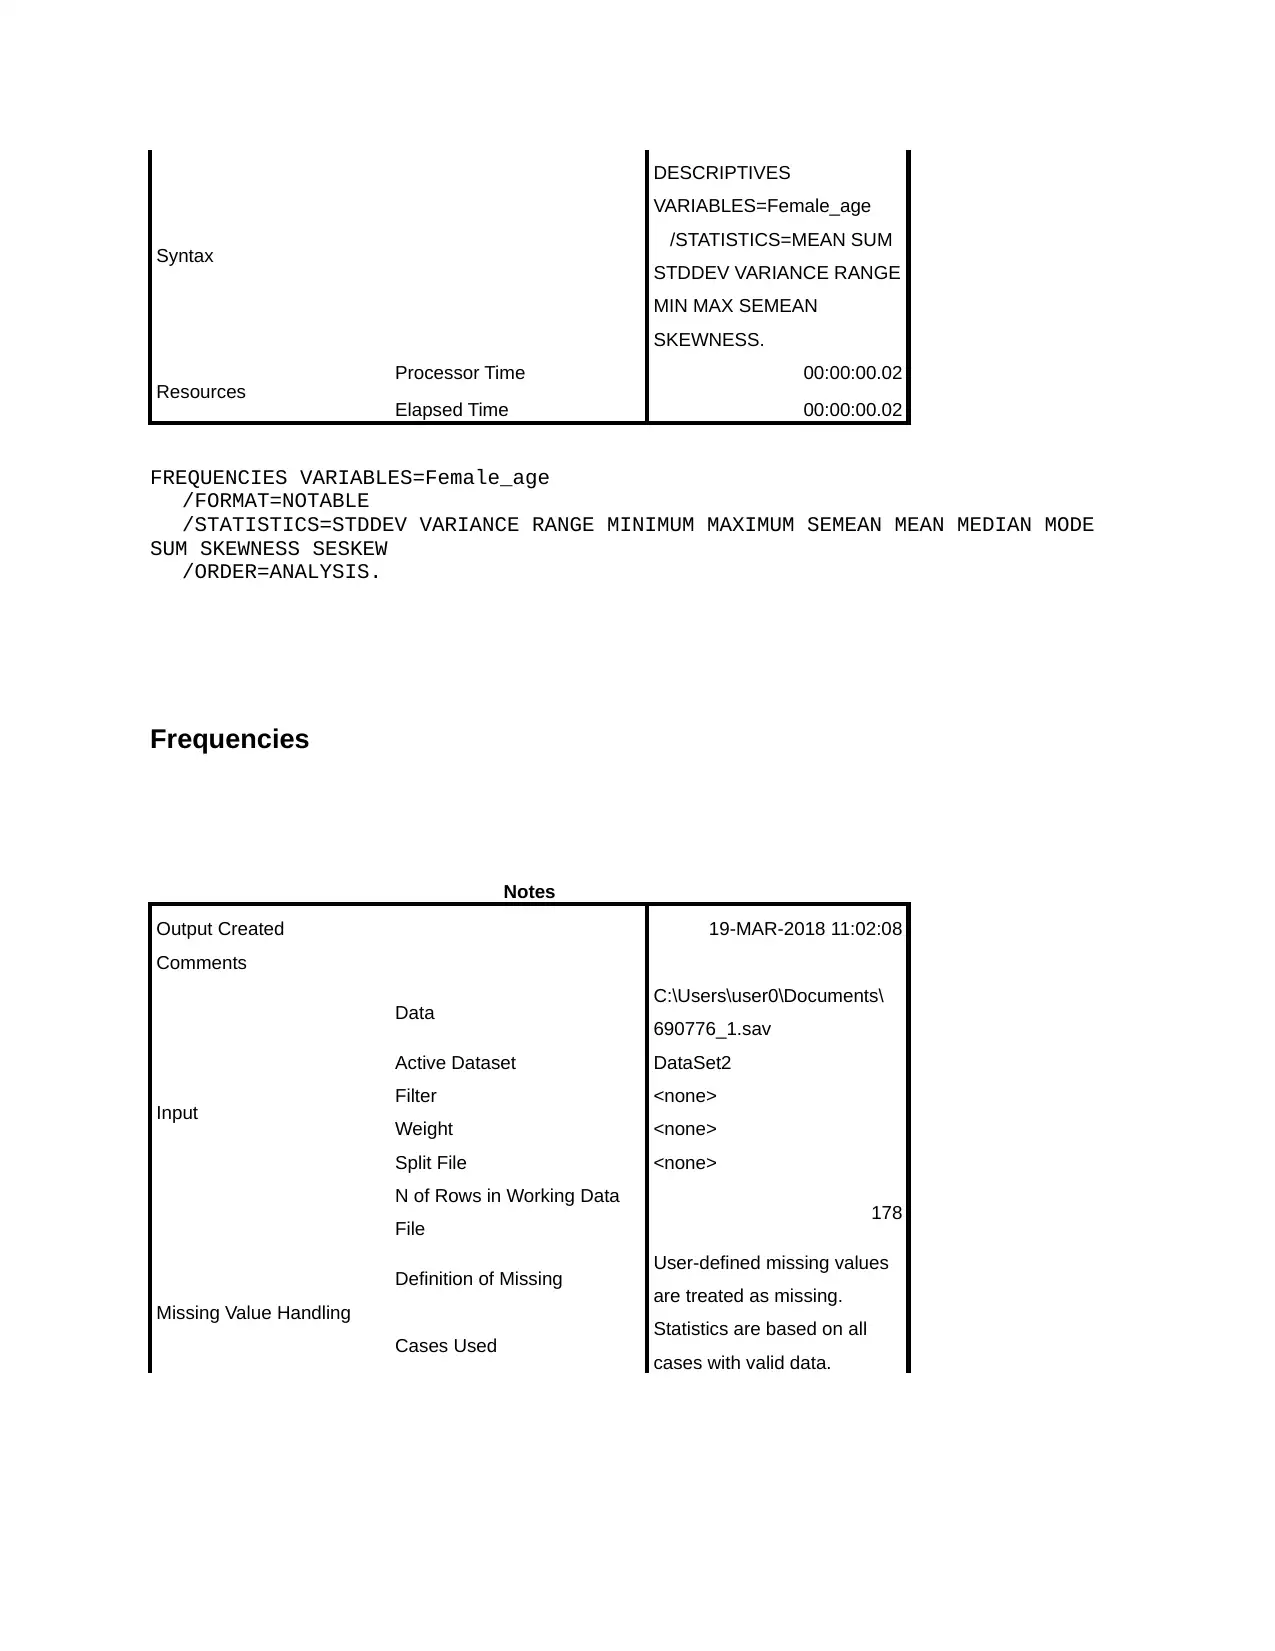
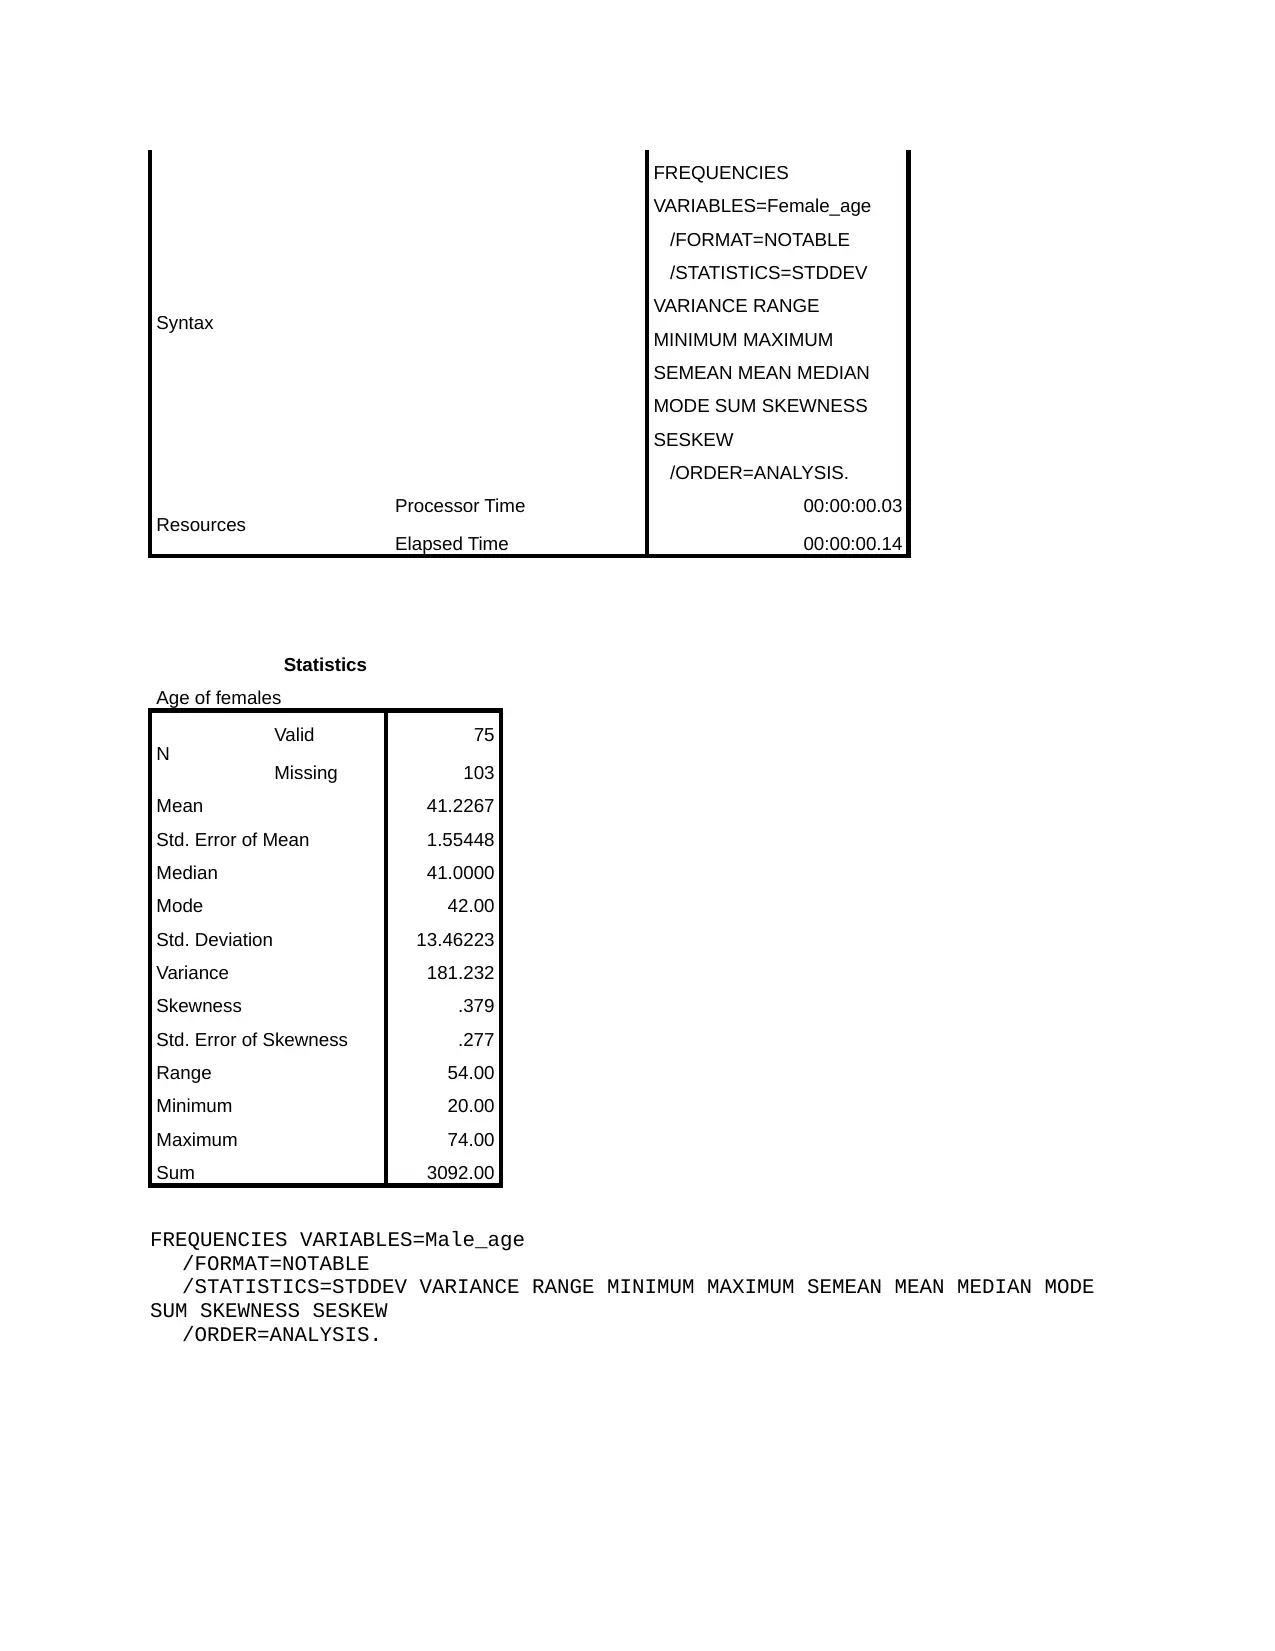
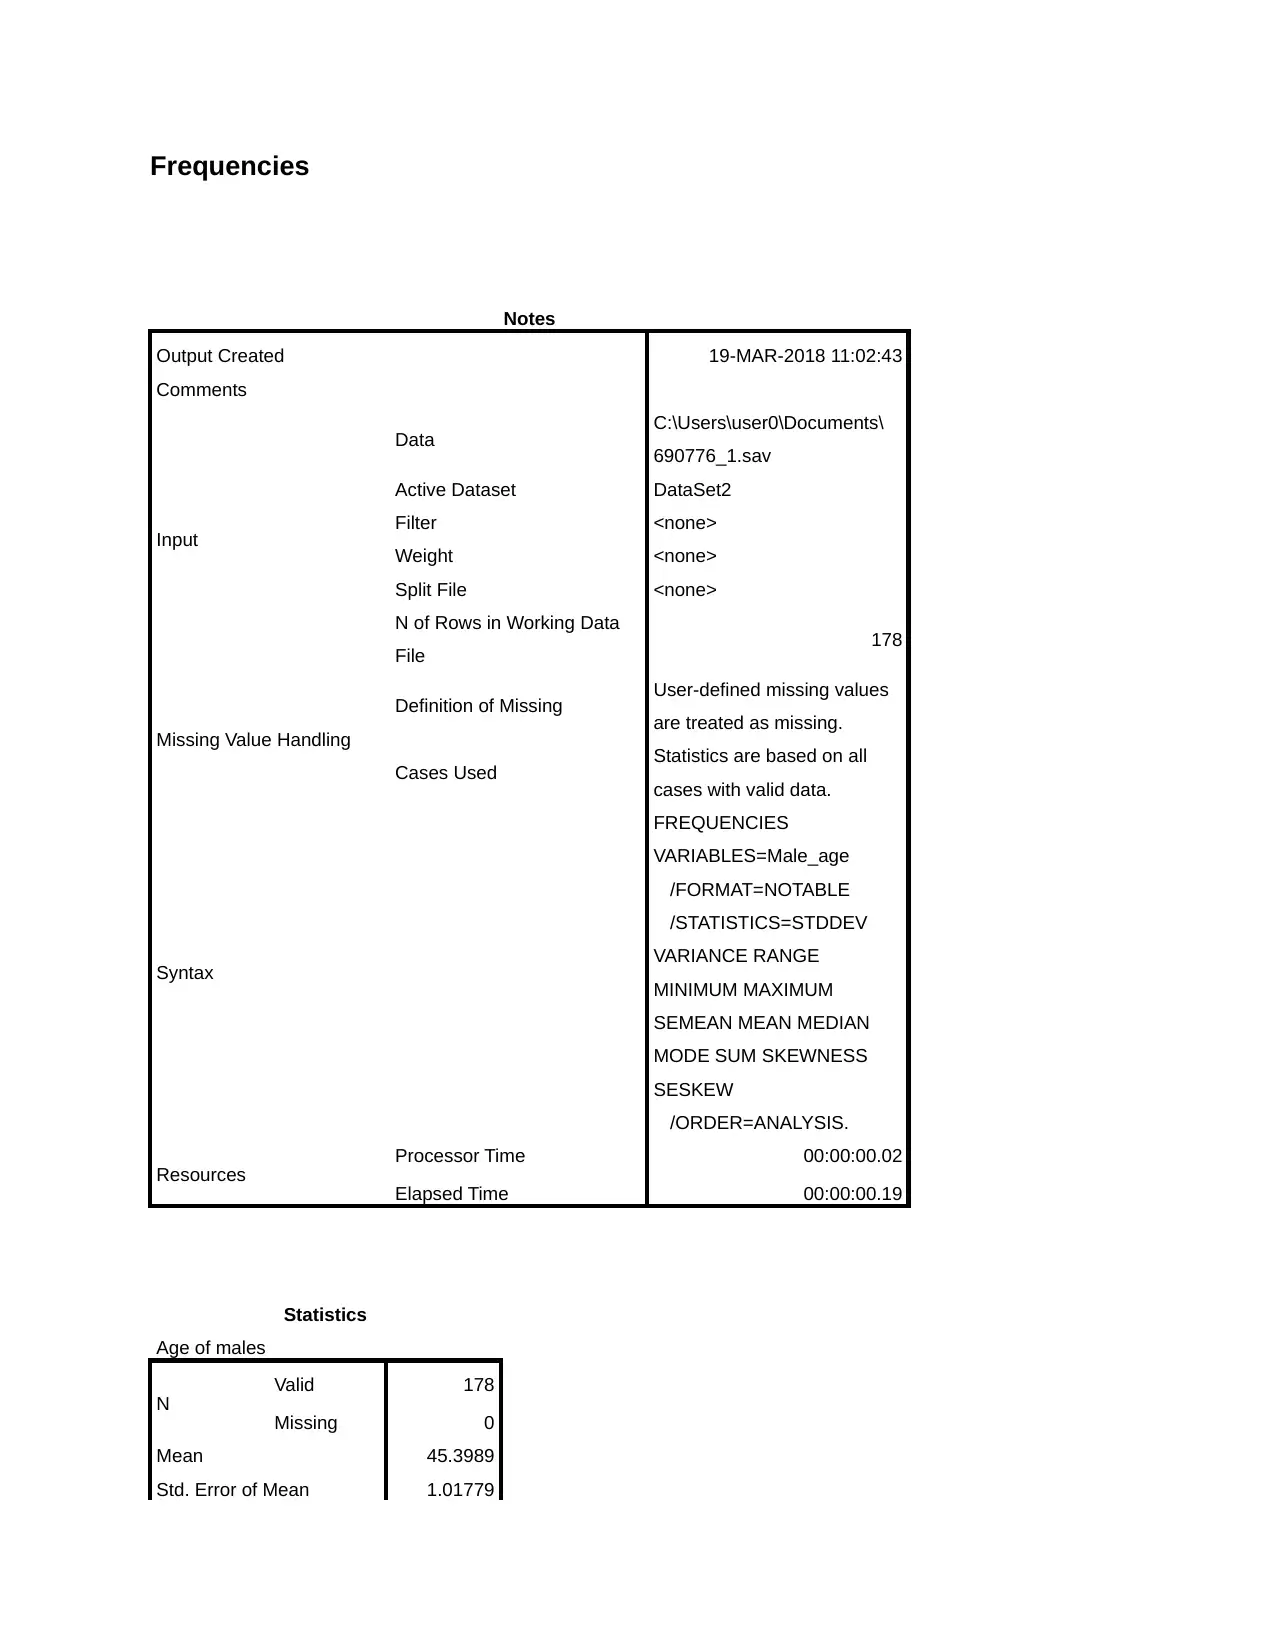
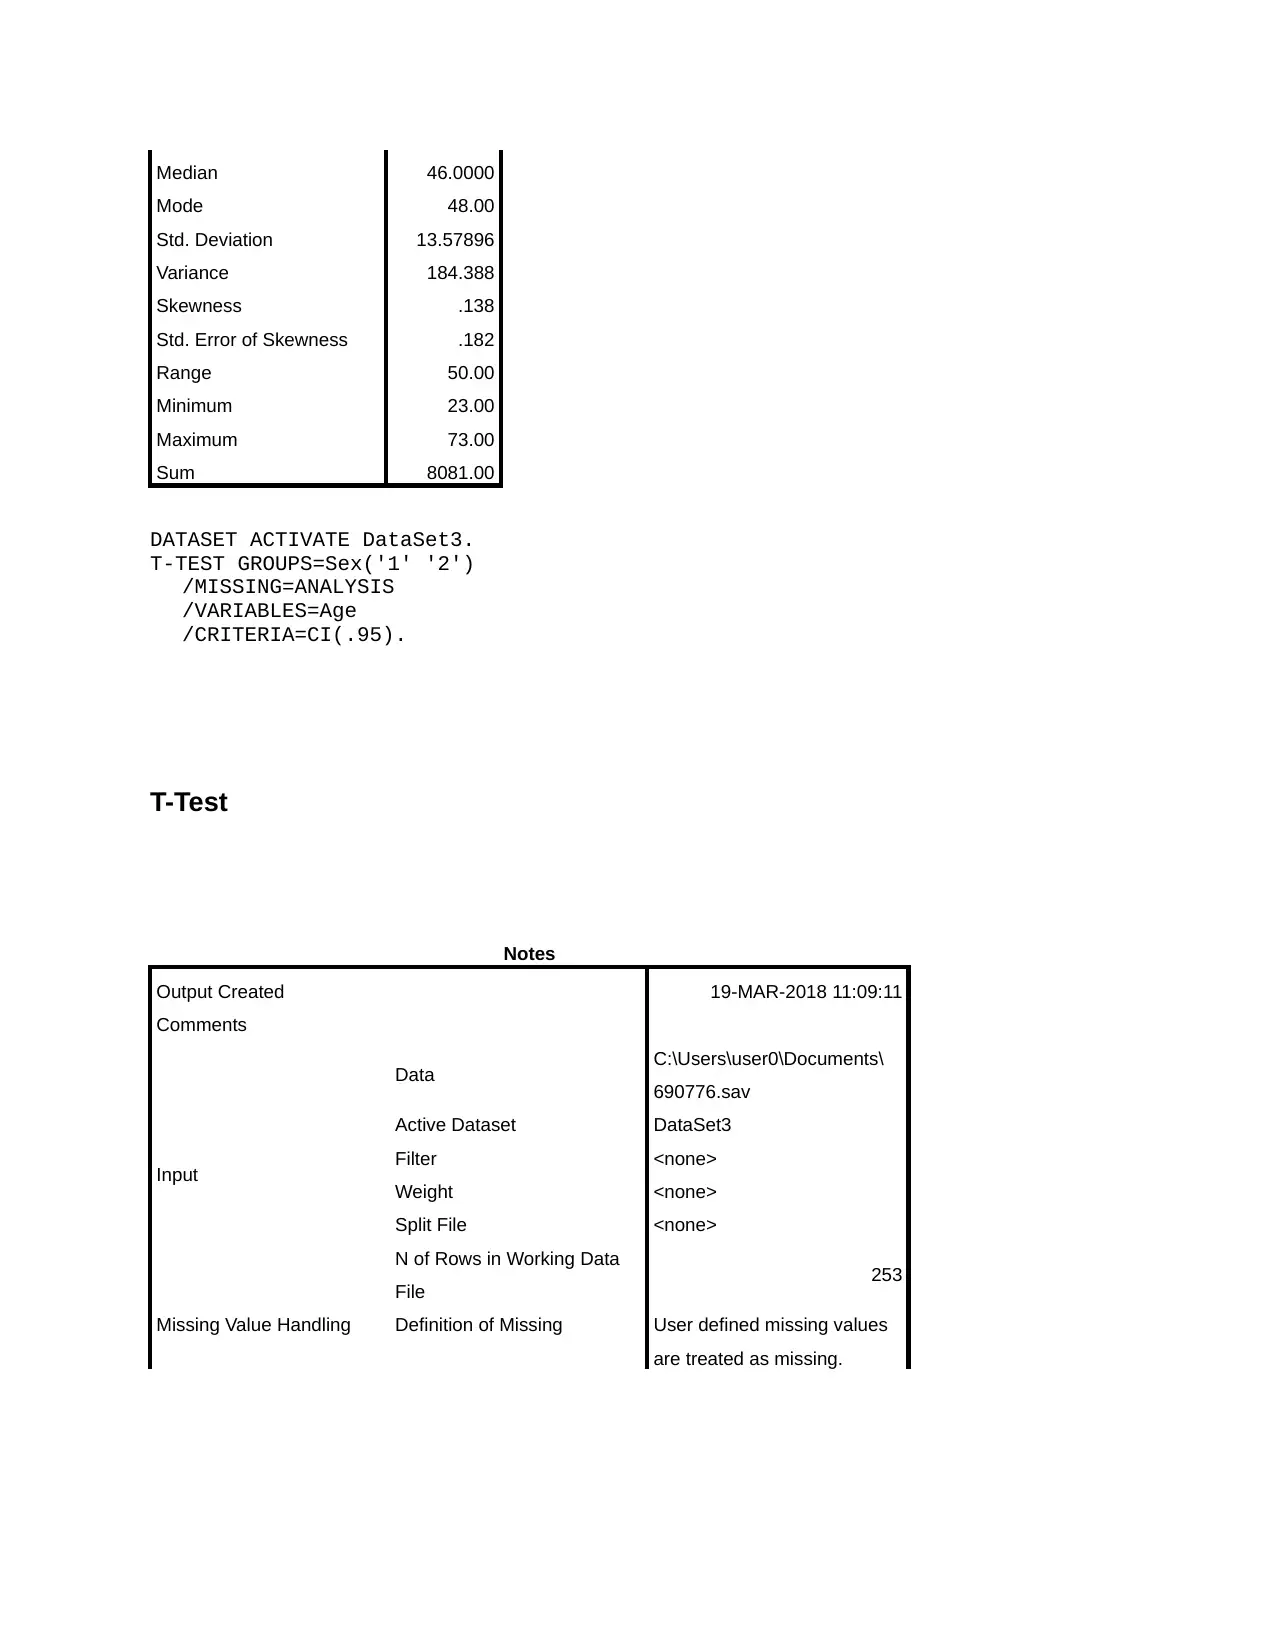
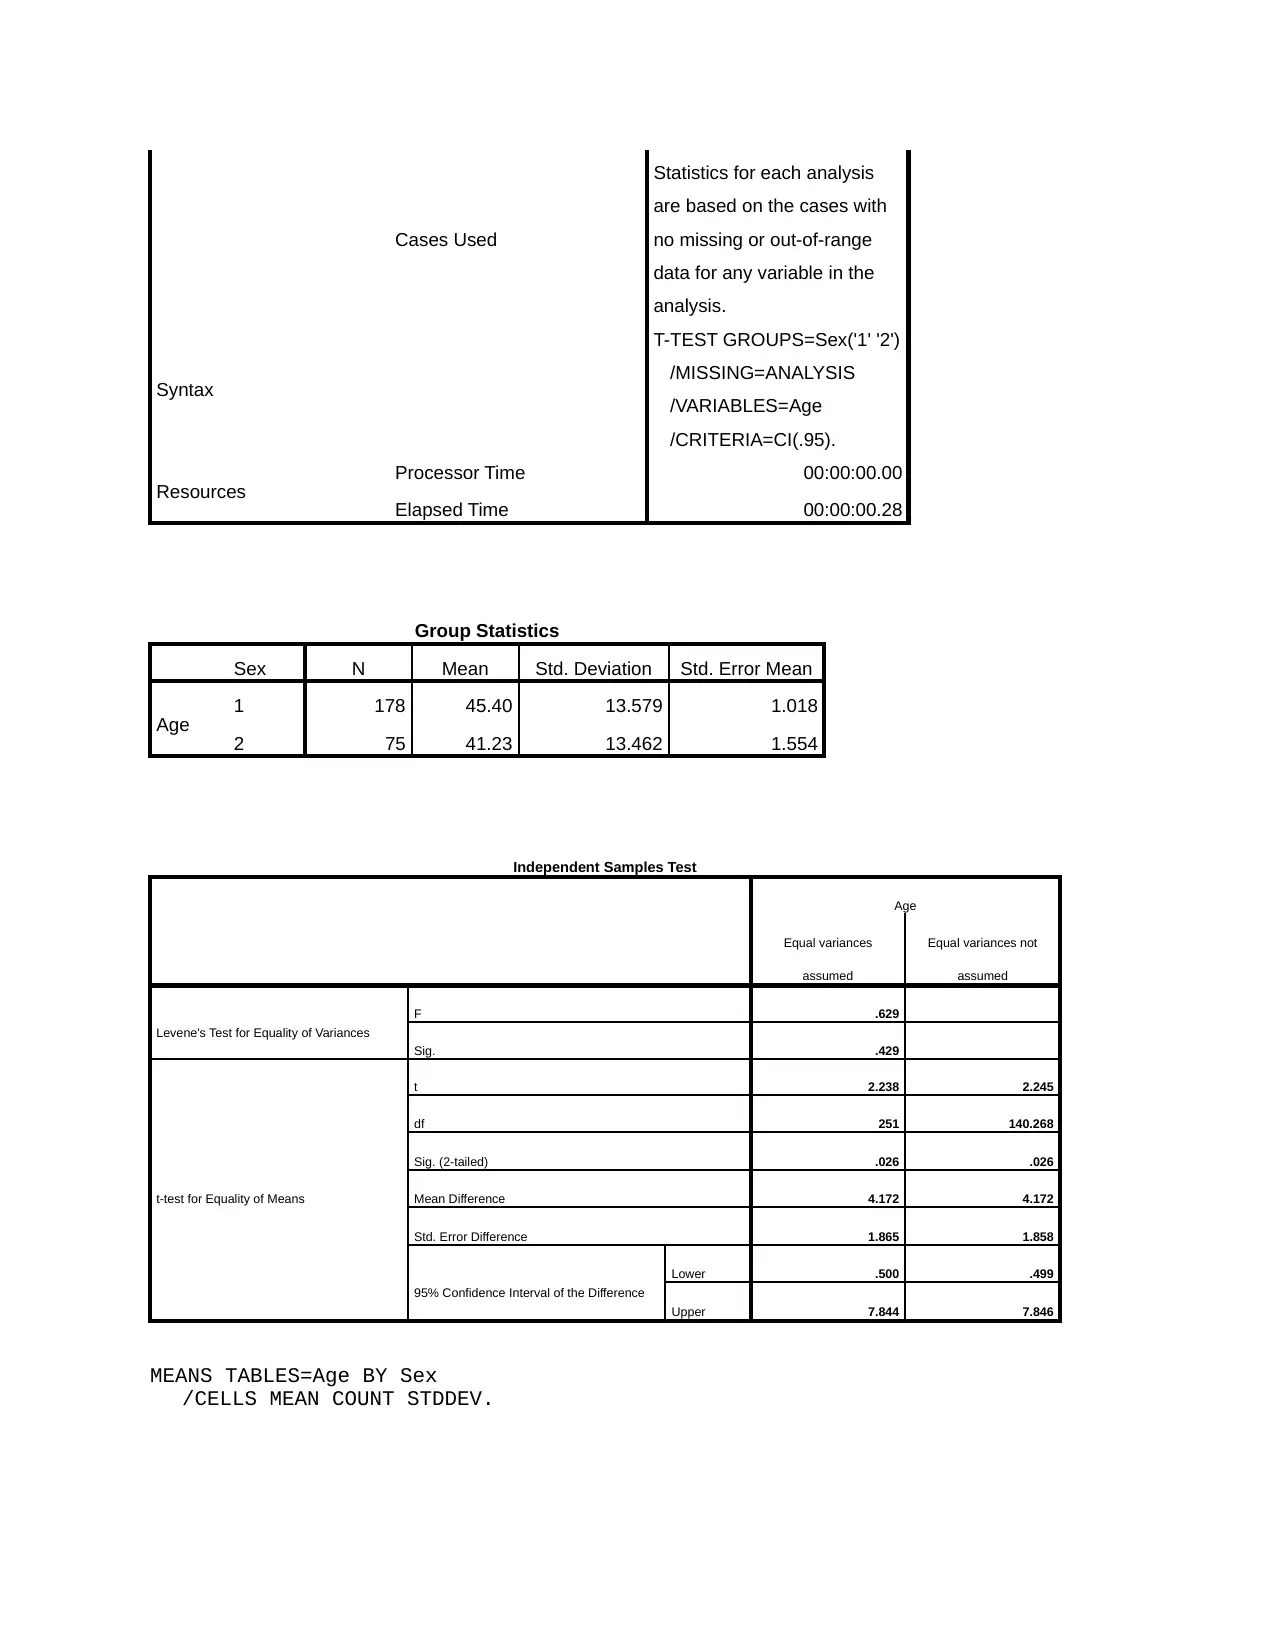
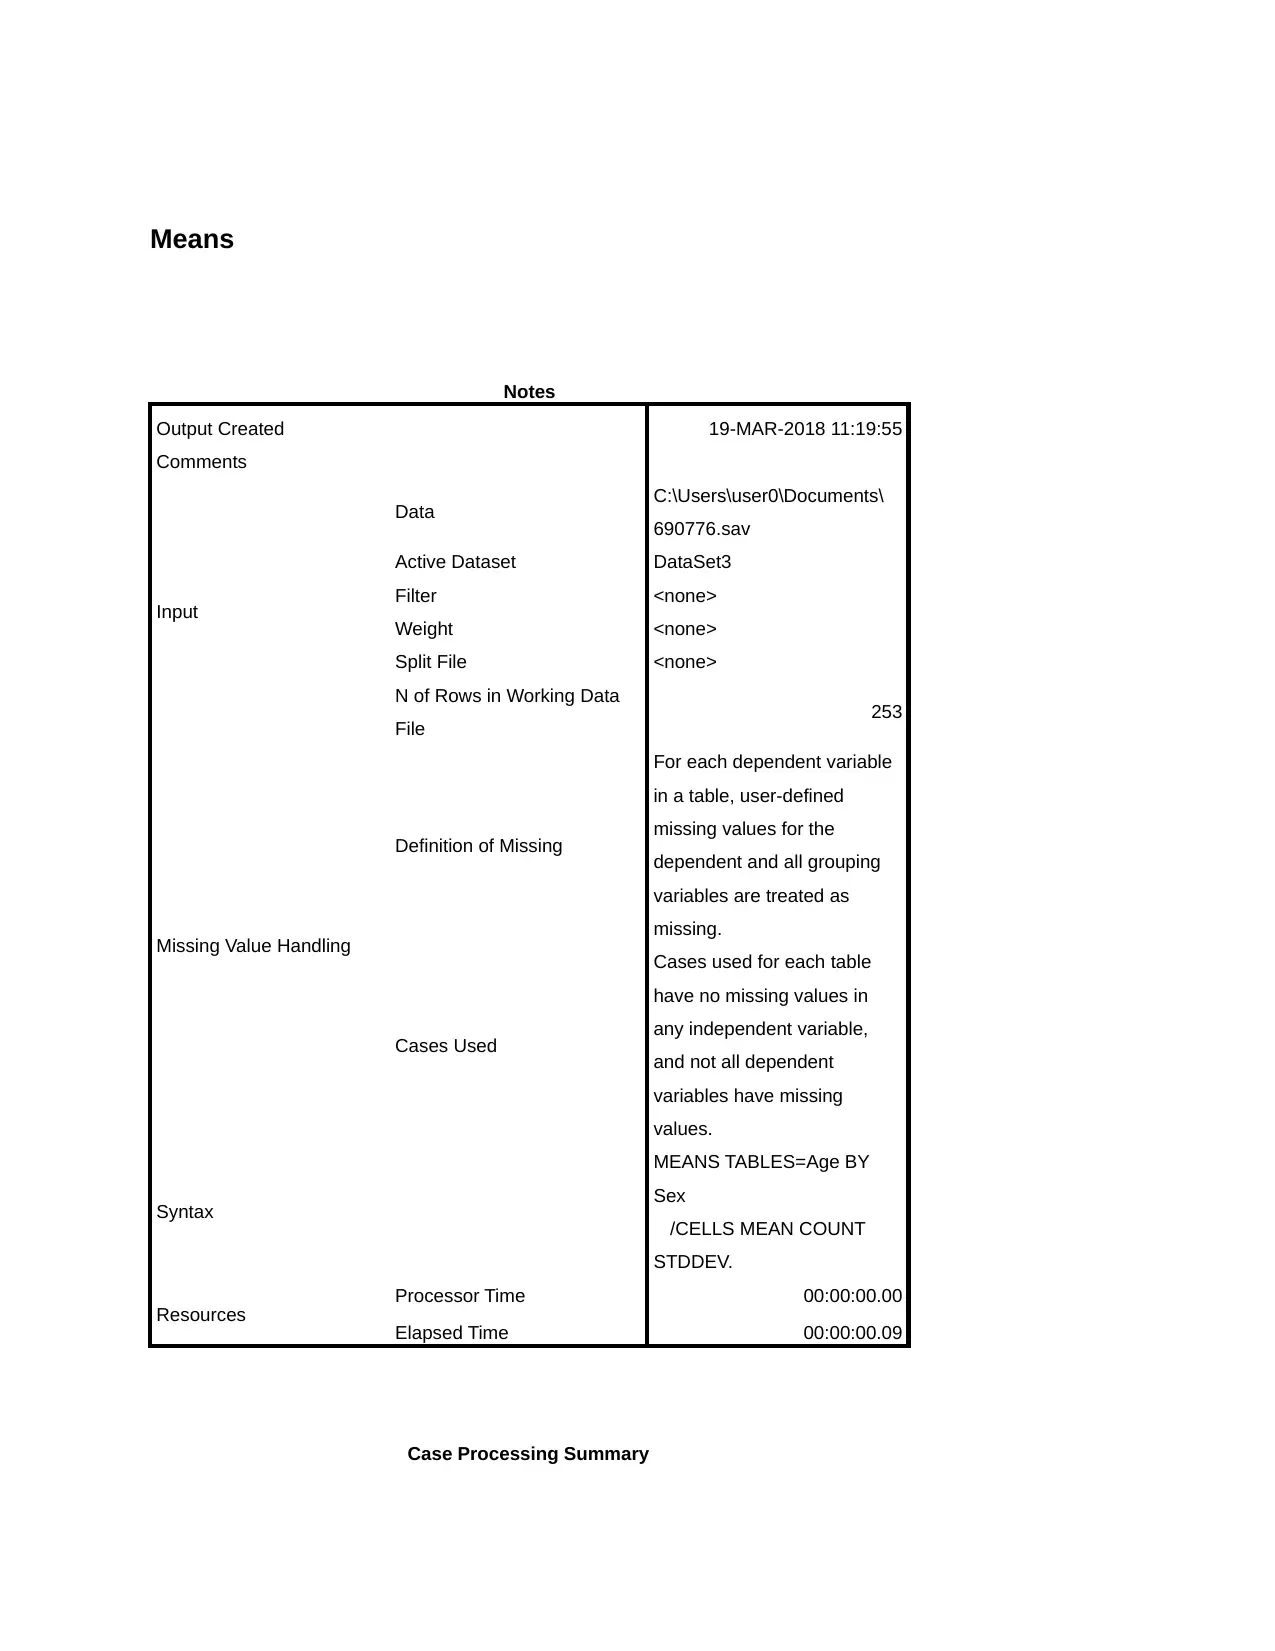
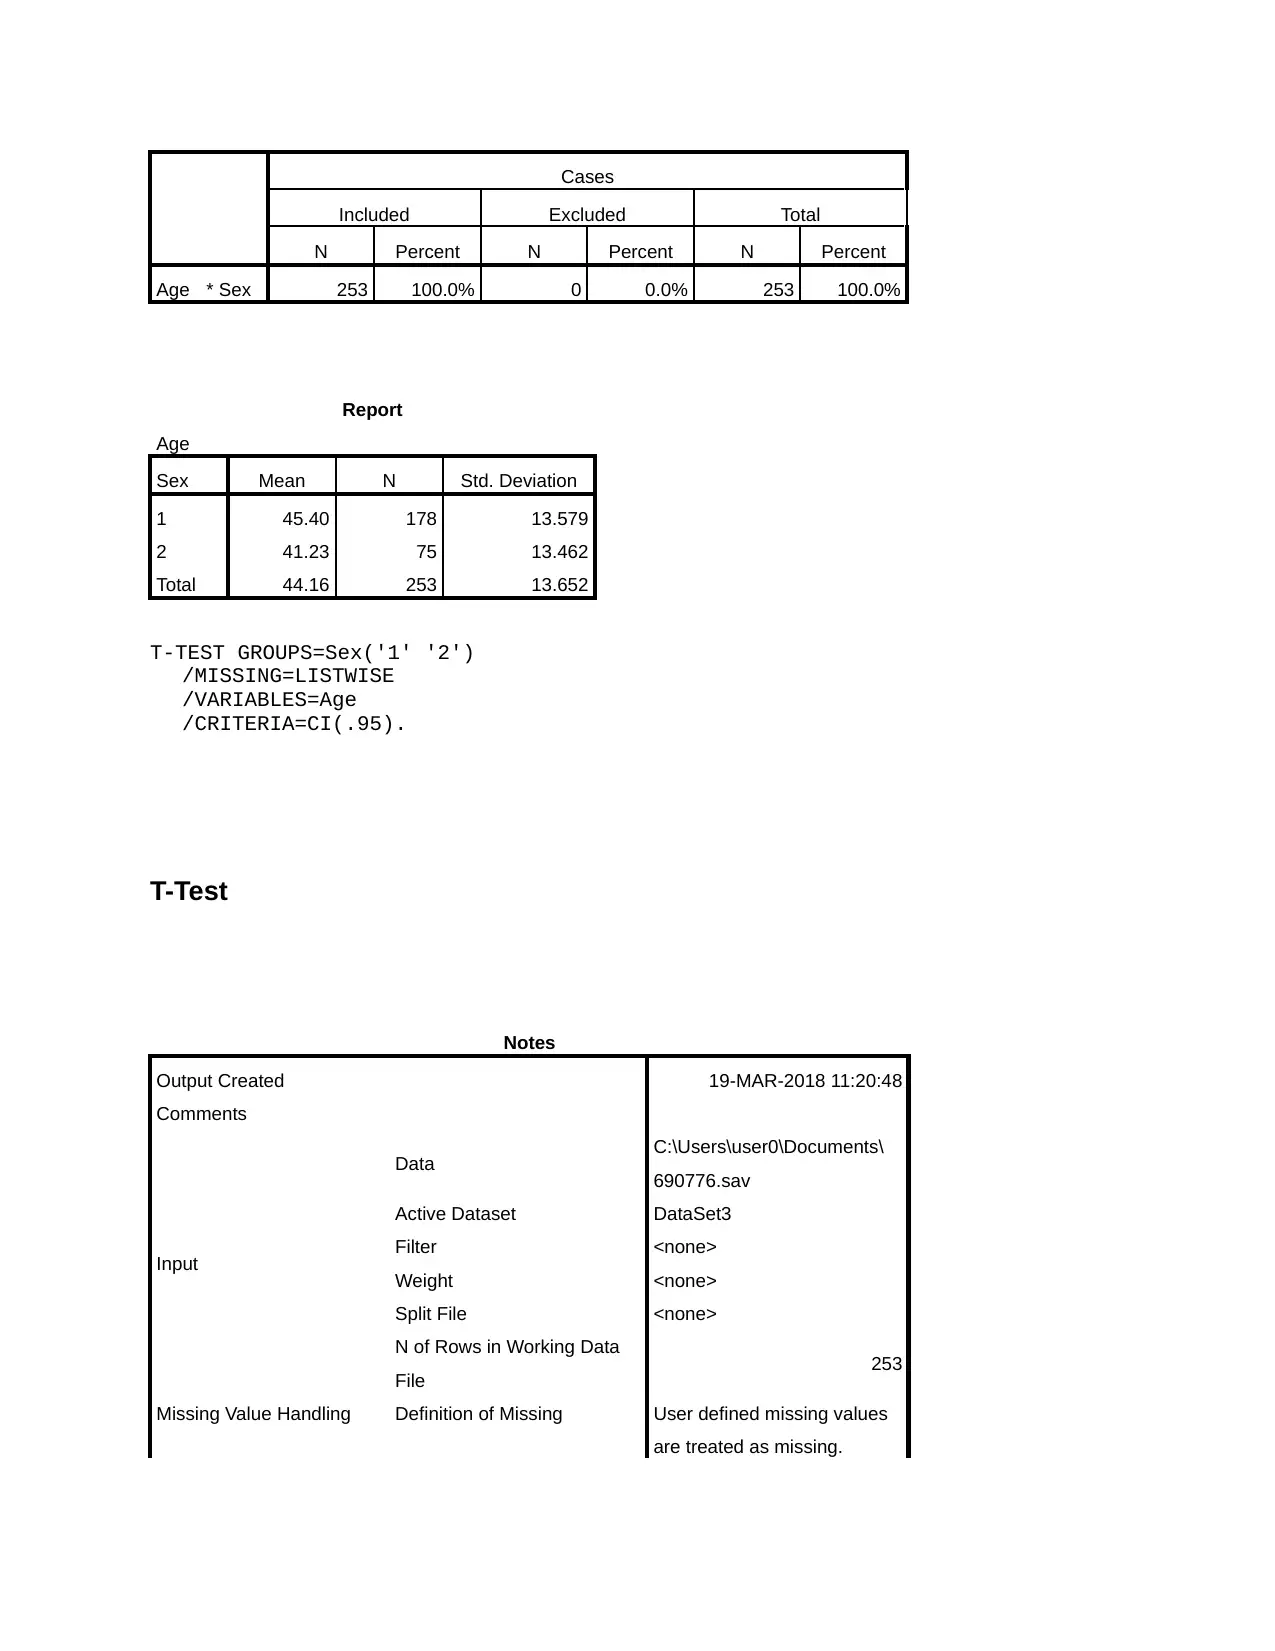
This assignment solution provides a detailed analysis of both qualitative and quantitative data analysis methods. The qualitative part includes an analysis of interview data, presenting findings under thematic headings and critically discussing the challenges of rigorous qualitative research with reference to methodological literature. The quantitative part focuses on null hypothesis significance testing, its underlying statistical theory, limitations, and the application of confidence intervals to inferential testing. The solution includes statistical outputs, descriptive statistics for male and female age data, t-tests, and means tables, demonstrating a comprehensive understanding of statistical analysis techniques and their application.

Graph
Notes
Output Created 19-MAR-2018 10:25:50
Comments
Input
Data C:\Users\user0\Documents\
690776_1.sav
Active Dataset DataSet2
Filter <none>
Weight <none>
Split File <none>
N of Rows in Working Data
File 178
Syntax
GRAPH
/HISTOGRAM=Male_age
/TITLE='Distribution of age
for males'.
Resources Processor Time 00:00:00.88
Elapsed Time 00:00:01.65
GRAPH
/HISTOGRAM=Female_age
/TITLE='Distribution of age for females'.
Notes
Output Created 19-MAR-2018 10:26:31
Comments
Input Data C:\Users\user0\Documents\
690776_1.sav
Active Dataset DataSet2
Filter <none>
Weight <none>
Notes
Output Created 19-MAR-2018 10:25:50
Comments
Input
Data C:\Users\user0\Documents\
690776_1.sav
Active Dataset DataSet2
Filter <none>
Weight <none>
Split File <none>
N of Rows in Working Data
File 178
Syntax
GRAPH
/HISTOGRAM=Male_age
/TITLE='Distribution of age
for males'.
Resources Processor Time 00:00:00.88
Elapsed Time 00:00:01.65
GRAPH
/HISTOGRAM=Female_age
/TITLE='Distribution of age for females'.
Notes
Output Created 19-MAR-2018 10:26:31
Comments
Input Data C:\Users\user0\Documents\
690776_1.sav
Active Dataset DataSet2
Filter <none>
Weight <none>
Paraphrase This Document
Need a fresh take? Get an instant paraphrase of this document with our AI Paraphraser

Split File <none>
N of Rows in Working Data
File 178
Syntax
GRAPH
/HISTOGRAM=Female_age
/TITLE='Distribution of age
for females'.
Resources Processor Time 00:00:00.73
Elapsed Time 00:00:01.67
N of Rows in Working Data
File 178
Syntax
GRAPH
/HISTOGRAM=Female_age
/TITLE='Distribution of age
for females'.
Resources Processor Time 00:00:00.73
Elapsed Time 00:00:01.67

Notes
Output Created 19-MAR-2018 10:28:52
Comments
Input
Data C:\Users\user0\Documents\
690776_1.sav
Active Dataset DataSet2
Filter <none>
Weight <none>
Split File <none>
N of Rows in Working Data
File 178
Syntax
GRAPH
/HISTOGRAM=Male_age
/TITLE='Distribution of age
for females'.
Resources Processor Time 00:00:00.75
Elapsed Time 00:00:01.33
Graph
Notes
Output Created 19-MAR-2018 10:29:16
Comments
Input
Data C:\Users\user0\Documents\
690776_1.sav
Active Dataset DataSet2
Filter <none>
Weight <none>
Split File <none>
N of Rows in Working Data
File 178
Syntax
GRAPH
/HISTOGRAM=Male_age
/TITLE='Distribution of age
for males'.
⊘ This is a preview!⊘
Do you want full access?
Subscribe today to unlock all pages.

Trusted by 1+ million students worldwide

Resources Processor Time 00:00:00.67
Elapsed Time 00:00:01.61
Notes
Output Created 19-MAR-2018 10:32:51
Comments
Input Data C:\Users\user0\Documents\
690776_1.sav
Active Dataset DataSet2
Filter <none>
Weight <none>
Elapsed Time 00:00:01.61
Notes
Output Created 19-MAR-2018 10:32:51
Comments
Input Data C:\Users\user0\Documents\
690776_1.sav
Active Dataset DataSet2
Filter <none>
Weight <none>
Paraphrase This Document
Need a fresh take? Get an instant paraphrase of this document with our AI Paraphraser

Split File <none>
N of Rows in Working Data
File 178
Missing Value Handling
Definition of Missing User defined missing values
are treated as missing.
Cases Used All non-missing data are
used.
Syntax
DESCRIPTIVES
VARIABLES=Male_age
/STATISTICS=MEAN SUM
STDDEV VARIANCE RANGE
MIN MAX SEMEAN
SKEWNESS.
Resources Processor Time 00:00:00.03
Elapsed Time 00:00:00.07
Descriptives
Notes
Output Created 19-MAR-2018 10:40:15
Comments
Input
Data C:\Users\user0\Documents\
690776_1.sav
Active Dataset DataSet2
Filter <none>
Weight <none>
Split File <none>
N of Rows in Working Data
File 178
Missing Value Handling
Definition of Missing User defined missing values
are treated as missing.
Cases Used All non-missing data are
used.
N of Rows in Working Data
File 178
Missing Value Handling
Definition of Missing User defined missing values
are treated as missing.
Cases Used All non-missing data are
used.
Syntax
DESCRIPTIVES
VARIABLES=Male_age
/STATISTICS=MEAN SUM
STDDEV VARIANCE RANGE
MIN MAX SEMEAN
SKEWNESS.
Resources Processor Time 00:00:00.03
Elapsed Time 00:00:00.07
Descriptives
Notes
Output Created 19-MAR-2018 10:40:15
Comments
Input
Data C:\Users\user0\Documents\
690776_1.sav
Active Dataset DataSet2
Filter <none>
Weight <none>
Split File <none>
N of Rows in Working Data
File 178
Missing Value Handling
Definition of Missing User defined missing values
are treated as missing.
Cases Used All non-missing data are
used.

Syntax
DESCRIPTIVES
VARIABLES=Female_age
/STATISTICS=MEAN SUM
STDDEV VARIANCE RANGE
MIN MAX SEMEAN
SKEWNESS.
Resources Processor Time 00:00:00.02
Elapsed Time 00:00:00.02
FREQUENCIES VARIABLES=Female_age
/FORMAT=NOTABLE
/STATISTICS=STDDEV VARIANCE RANGE MINIMUM MAXIMUM SEMEAN MEAN MEDIAN MODE
SUM SKEWNESS SESKEW
/ORDER=ANALYSIS.
Frequencies
Notes
Output Created 19-MAR-2018 11:02:08
Comments
Input
Data C:\Users\user0\Documents\
690776_1.sav
Active Dataset DataSet2
Filter <none>
Weight <none>
Split File <none>
N of Rows in Working Data
File 178
Missing Value Handling
Definition of Missing User-defined missing values
are treated as missing.
Cases Used Statistics are based on all
cases with valid data.
⊘ This is a preview!⊘
Do you want full access?
Subscribe today to unlock all pages.

Trusted by 1+ million students worldwide

Syntax
FREQUENCIES
VARIABLES=Female_age
/FORMAT=NOTABLE
/STATISTICS=STDDEV
VARIANCE RANGE
MINIMUM MAXIMUM
SEMEAN MEAN MEDIAN
MODE SUM SKEWNESS
SESKEW
/ORDER=ANALYSIS.
Resources Processor Time 00:00:00.03
Elapsed Time 00:00:00.14
Statistics
Age of females
N Valid 75
Missing 103
Mean 41.2267
Std. Error of Mean 1.55448
Median 41.0000
Mode 42.00
Std. Deviation 13.46223
Variance 181.232
Skewness .379
Std. Error of Skewness .277
Range 54.00
Minimum 20.00
Maximum 74.00
Sum 3092.00
FREQUENCIES VARIABLES=Male_age
/FORMAT=NOTABLE
/STATISTICS=STDDEV VARIANCE RANGE MINIMUM MAXIMUM SEMEAN MEAN MEDIAN MODE
SUM SKEWNESS SESKEW
/ORDER=ANALYSIS.
Paraphrase This Document
Need a fresh take? Get an instant paraphrase of this document with our AI Paraphraser

Frequencies
Notes
Output Created 19-MAR-2018 11:02:43
Comments
Input
Data C:\Users\user0\Documents\
690776_1.sav
Active Dataset DataSet2
Filter <none>
Weight <none>
Split File <none>
N of Rows in Working Data
File 178
Missing Value Handling
Definition of Missing User-defined missing values
are treated as missing.
Cases Used Statistics are based on all
cases with valid data.
Syntax
FREQUENCIES
VARIABLES=Male_age
/FORMAT=NOTABLE
/STATISTICS=STDDEV
VARIANCE RANGE
MINIMUM MAXIMUM
SEMEAN MEAN MEDIAN
MODE SUM SKEWNESS
SESKEW
/ORDER=ANALYSIS.
Resources Processor Time 00:00:00.02
Elapsed Time 00:00:00.19
Statistics
Age of males
N Valid 178
Missing 0
Mean 45.3989
Std. Error of Mean 1.01779

Median 46.0000
Mode 48.00
Std. Deviation 13.57896
Variance 184.388
Skewness .138
Std. Error of Skewness .182
Range 50.00
Minimum 23.00
Maximum 73.00
Sum 8081.00
DATASET ACTIVATE DataSet3.
T-TEST GROUPS=Sex('1' '2')
/MISSING=ANALYSIS
/VARIABLES=Age
/CRITERIA=CI(.95).
T-Test
Notes
Output Created 19-MAR-2018 11:09:11
Comments
Input
Data C:\Users\user0\Documents\
690776.sav
Active Dataset DataSet3
Filter <none>
Weight <none>
Split File <none>
N of Rows in Working Data
File 253
Missing Value Handling Definition of Missing User defined missing values
are treated as missing.
⊘ This is a preview!⊘
Do you want full access?
Subscribe today to unlock all pages.

Trusted by 1+ million students worldwide

Cases Used
Statistics for each analysis
are based on the cases with
no missing or out-of-range
data for any variable in the
analysis.
Syntax
T-TEST GROUPS=Sex('1' '2')
/MISSING=ANALYSIS
/VARIABLES=Age
/CRITERIA=CI(.95).
Resources Processor Time 00:00:00.00
Elapsed Time 00:00:00.28
Group Statistics
Sex N Mean Std. Deviation Std. Error Mean
Age 1 178 45.40 13.579 1.018
2 75 41.23 13.462 1.554
Independent Samples Test
Age
Equal variances
assumed
Equal variances not
assumed
Levene's Test for Equality of Variances
F .629
Sig. .429
t-test for Equality of Means
t 2.238 2.245
df 251 140.268
Sig. (2-tailed) .026 .026
Mean Difference 4.172 4.172
Std. Error Difference 1.865 1.858
95% Confidence Interval of the Difference
Lower .500 .499
Upper 7.844 7.846
MEANS TABLES=Age BY Sex
/CELLS MEAN COUNT STDDEV.
Paraphrase This Document
Need a fresh take? Get an instant paraphrase of this document with our AI Paraphraser

Means
Notes
Output Created 19-MAR-2018 11:19:55
Comments
Input
Data C:\Users\user0\Documents\
690776.sav
Active Dataset DataSet3
Filter <none>
Weight <none>
Split File <none>
N of Rows in Working Data
File 253
Missing Value Handling
Definition of Missing
For each dependent variable
in a table, user-defined
missing values for the
dependent and all grouping
variables are treated as
missing.
Cases Used
Cases used for each table
have no missing values in
any independent variable,
and not all dependent
variables have missing
values.
Syntax
MEANS TABLES=Age BY
Sex
/CELLS MEAN COUNT
STDDEV.
Resources Processor Time 00:00:00.00
Elapsed Time 00:00:00.09
Case Processing Summary

Cases
Included Excluded Total
N Percent N Percent N Percent
Age * Sex 253 100.0% 0 0.0% 253 100.0%
Report
Age
Sex Mean N Std. Deviation
1 45.40 178 13.579
2 41.23 75 13.462
Total 44.16 253 13.652
T-TEST GROUPS=Sex('1' '2')
/MISSING=LISTWISE
/VARIABLES=Age
/CRITERIA=CI(.95).
T-Test
Notes
Output Created 19-MAR-2018 11:20:48
Comments
Input
Data C:\Users\user0\Documents\
690776.sav
Active Dataset DataSet3
Filter <none>
Weight <none>
Split File <none>
N of Rows in Working Data
File 253
Missing Value Handling Definition of Missing User defined missing values
are treated as missing.
⊘ This is a preview!⊘
Do you want full access?
Subscribe today to unlock all pages.

Trusted by 1+ million students worldwide
1 out of 13
Related Documents
Your All-in-One AI-Powered Toolkit for Academic Success.
 +13062052269
info@desklib.com
Available 24*7 on WhatsApp / Email
Unlock your academic potential
Copyright © 2020–2025 A2Z Services. All Rights Reserved. Developed and managed by ZUCOL.


