Real Estate Data Analysis: Descriptive Statistics and Decision Making
VerifiedAdded on  2020/06/04
|8
|1401
|228
Report
AI Summary
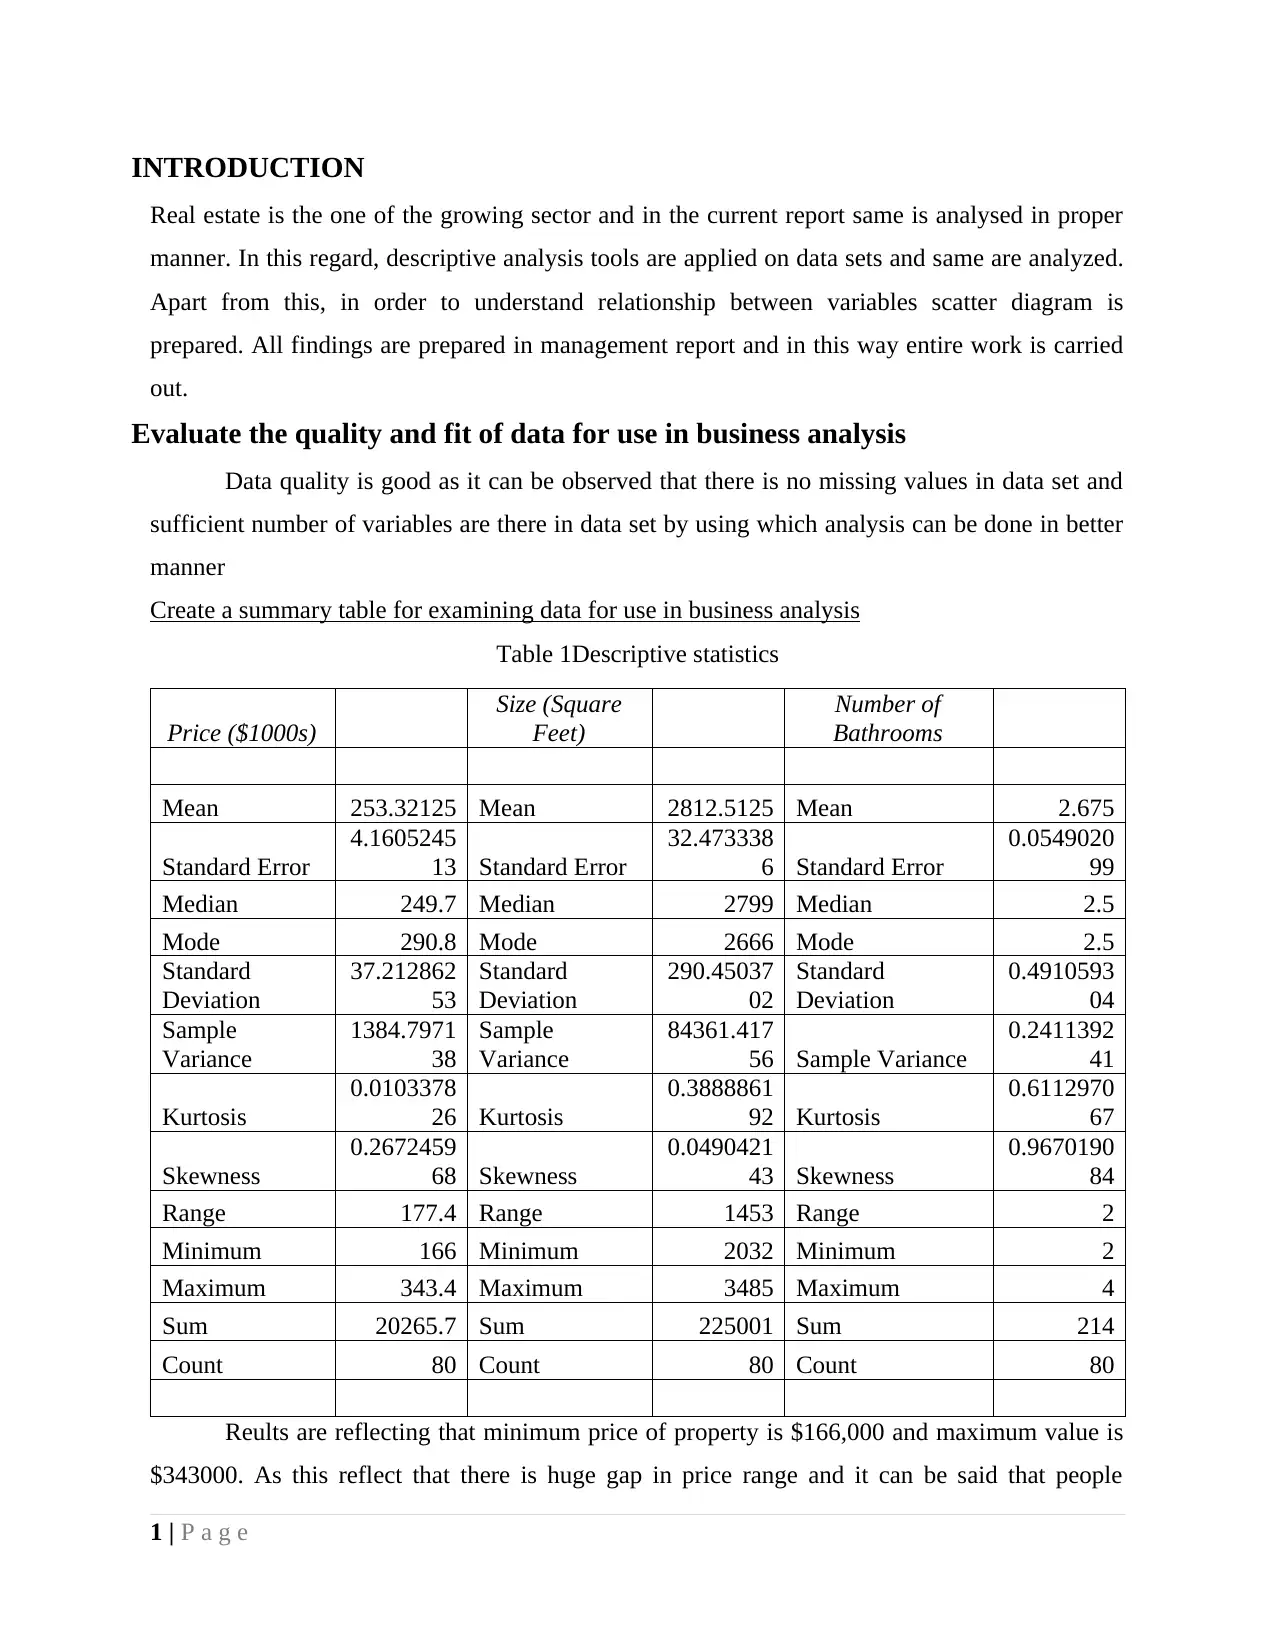
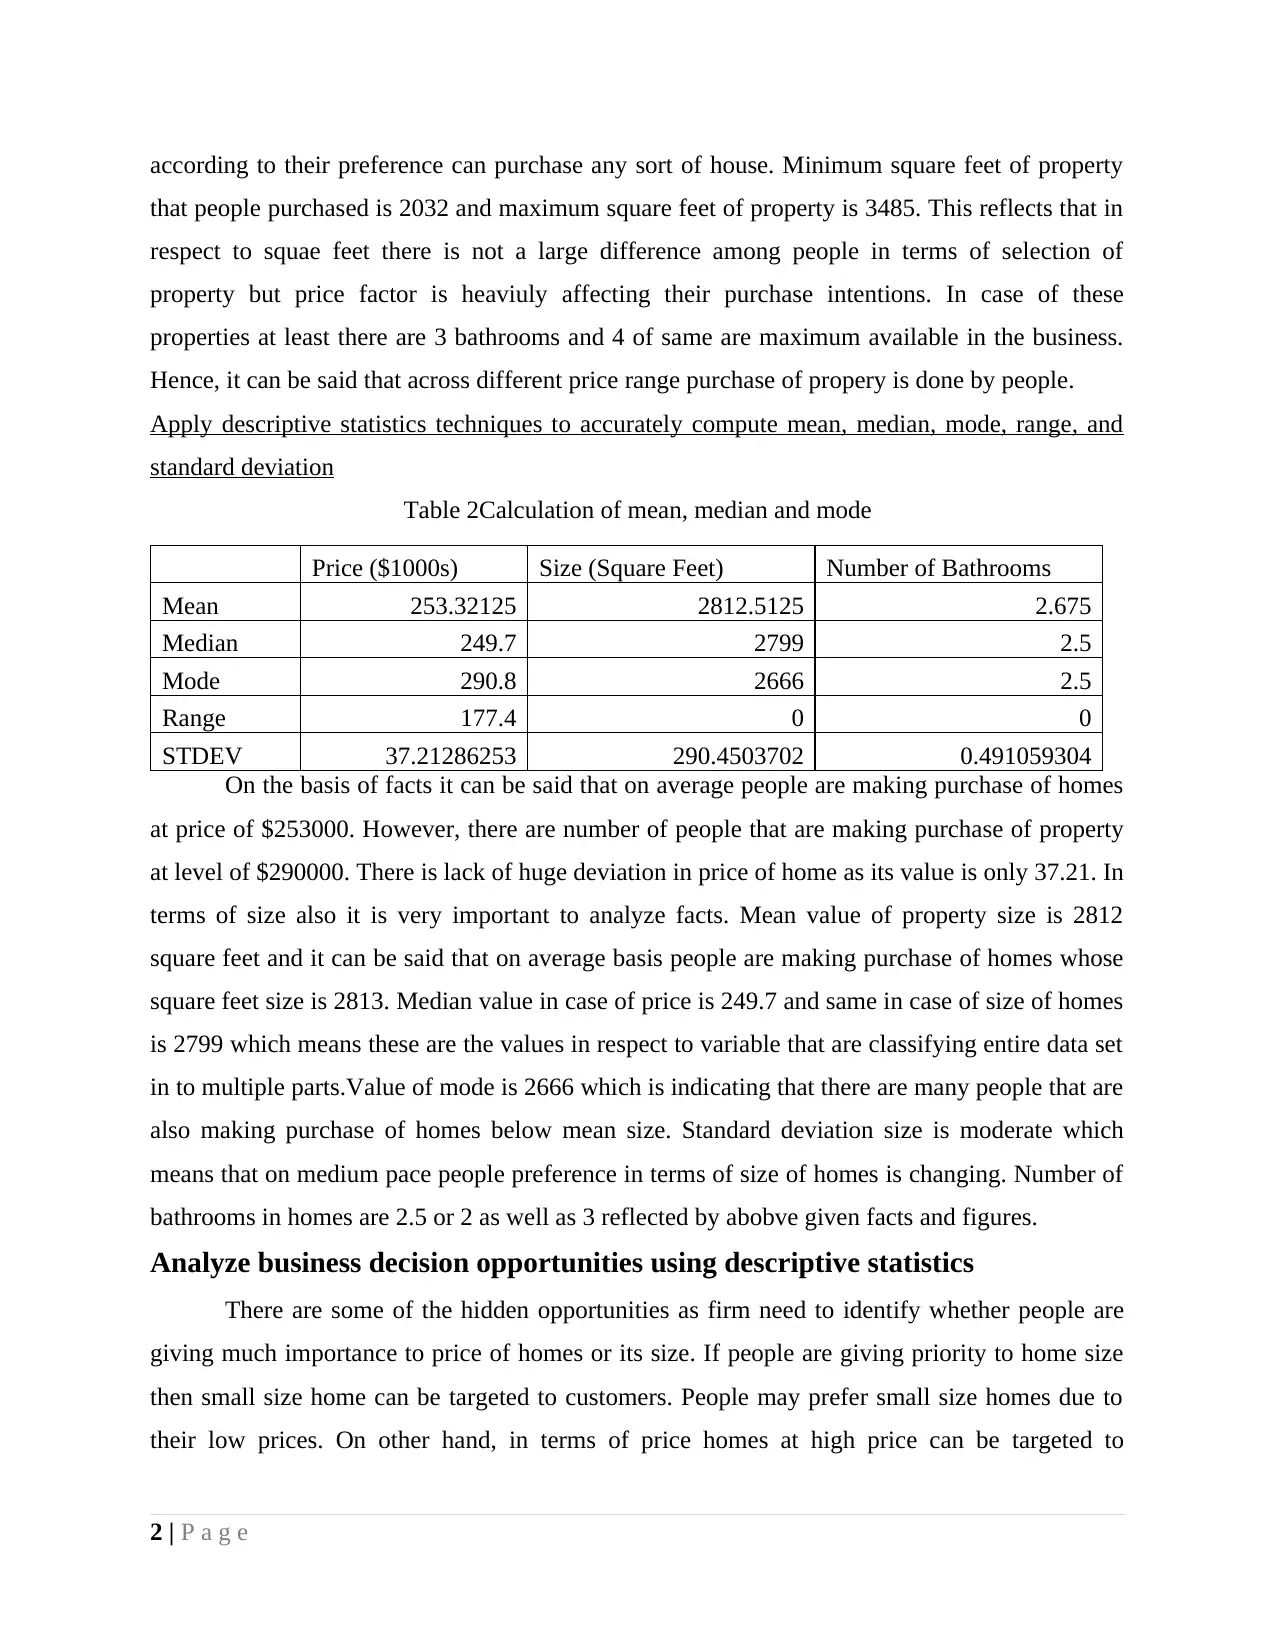
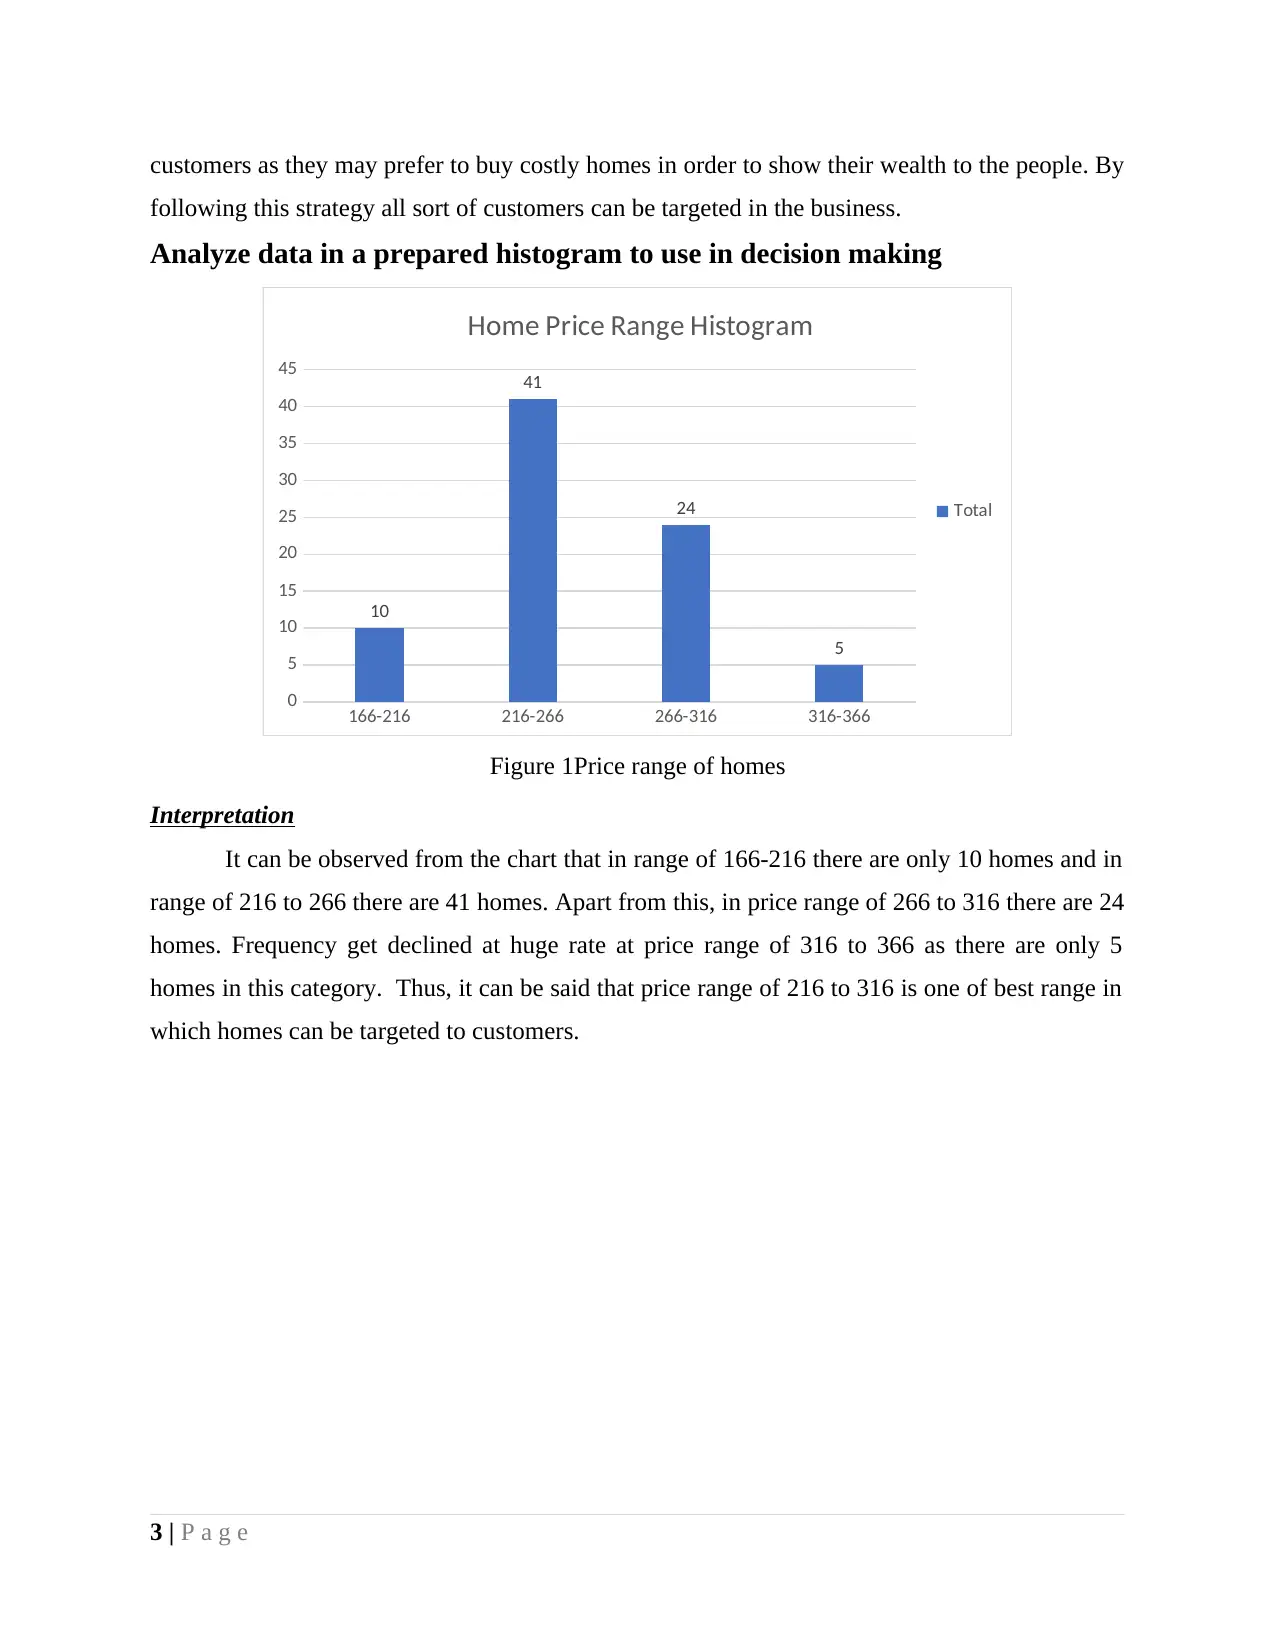
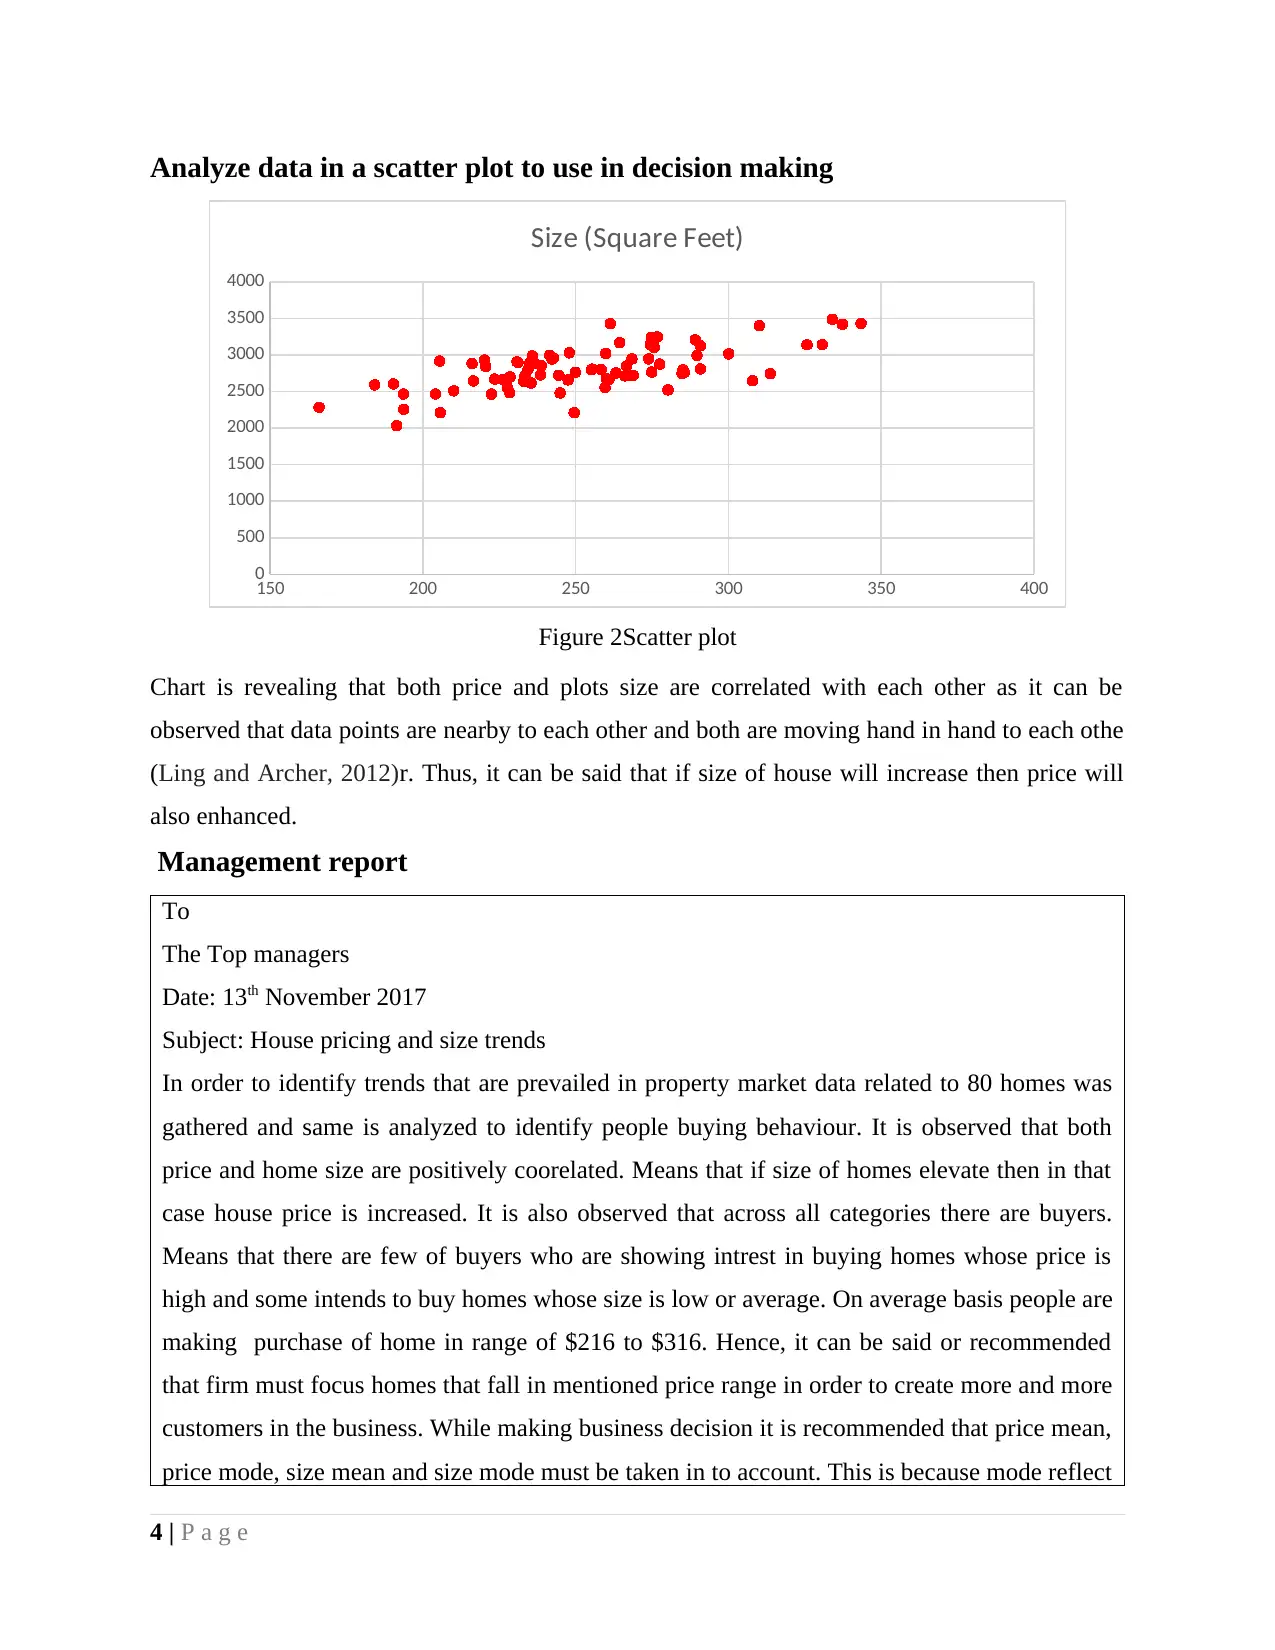
This report analyzes real estate data to provide insights for business decisions. The study utilizes descriptive statistics, including mean, median, mode, range, and standard deviation, to examine the quality and fit of the data. A summary table is created to present the findings, highlighting the price, size, and number of bathrooms in properties. The analysis reveals the minimum and maximum values for price and square footage, offering insights into consumer preferences. Furthermore, the report applies descriptive statistics to calculate the mean, median, and mode for price, size, and the number of bathrooms. The data is visualized using histograms and scatter plots to identify trends and correlations between price and size. A management report summarizes the key findings, emphasizing the positive correlation between house size and price, and recommends targeting homes within a specific price range to maximize customer acquisition. The report concludes by underscoring the significance of the relationship between house price and size, and suggests strategies for businesses to effectively target customers based on price range.

DATA ANALYSIS FOR BUSINESS
DECISIONS
DECISIONS
Paraphrase This Document
Need a fresh take? Get an instant paraphrase of this document with our AI Paraphraser

TABLE OF CONTENTS
INTRODUCTION...........................................................................................................................1
Evaluate the quality and fit of data for use in business analysis.....................................................1
Create a summary table for examining data for use in business analysis....................................1
Apply descriptive statistics techniques to accurately compute mean, median, mode, range, and
standard deviation........................................................................................................................2
Analyze business decision opportunities using descriptive statistics..............................................2
Analyze data in a prepared histogram to use in decision making....................................................3
Analyze data in a scatter plot to use in decision making.................................................................4
Management report..........................................................................................................................4
CONCLUSION................................................................................................................................5
REFERENCES................................................................................................................................6
Table 1Descriptive statistics............................................................................................................1
Table 2Calculation of mean, median and mode..............................................................................2
Figure 1Price range of homes..........................................................................................................3
Figure 2Scatter plot..........................................................................................................................3

INTRODUCTION
Real estate is the one of the growing sector and in the current report same is analysed in proper
manner. In this regard, descriptive analysis tools are applied on data sets and same are analyzed.
Apart from this, in order to understand relationship between variables scatter diagram is
prepared. All findings are prepared in management report and in this way entire work is carried
out.
Evaluate the quality and fit of data for use in business analysis
Data quality is good as it can be observed that there is no missing values in data set and
sufficient number of variables are there in data set by using which analysis can be done in better
manner
Create a summary table for examining data for use in business analysis
Table 1Descriptive statistics
Price ($1000s)
Size (Square
Feet)
Number of
Bathrooms
Mean 253.32125 Mean 2812.5125 Mean 2.675
Standard Error
4.1605245
13 Standard Error
32.473338
6 Standard Error
0.0549020
99
Median 249.7 Median 2799 Median 2.5
Mode 290.8 Mode 2666 Mode 2.5
Standard
Deviation
37.212862
53
Standard
Deviation
290.45037
02
Standard
Deviation
0.4910593
04
Sample
Variance
1384.7971
38
Sample
Variance
84361.417
56 Sample Variance
0.2411392
41
Kurtosis
0.0103378
26 Kurtosis
0.3888861
92 Kurtosis
0.6112970
67
Skewness
0.2672459
68 Skewness
0.0490421
43 Skewness
0.9670190
84
Range 177.4 Range 1453 Range 2
Minimum 166 Minimum 2032 Minimum 2
Maximum 343.4 Maximum 3485 Maximum 4
Sum 20265.7 Sum 225001 Sum 214
Count 80 Count 80 Count 80
Reults are reflecting that minimum price of property is $166,000 and maximum value is
$343000. As this reflect that there is huge gap in price range and it can be said that people
1 | P a g e
⊘ This is a preview!⊘
Do you want full access?
Subscribe today to unlock all pages.

Trusted by 1+ million students worldwide

according to their preference can purchase any sort of house. Minimum square feet of property
that people purchased is 2032 and maximum square feet of property is 3485. This reflects that in
respect to squae feet there is not a large difference among people in terms of selection of
property but price factor is heaviuly affecting their purchase intentions. In case of these
properties at least there are 3 bathrooms and 4 of same are maximum available in the business.
Hence, it can be said that across different price range purchase of propery is done by people.
Apply descriptive statistics techniques to accurately compute mean, median, mode, range, and
standard deviation
Table 2Calculation of mean, median and mode
Price ($1000s) Size (Square Feet) Number of Bathrooms
Mean 253.32125 2812.5125 2.675
Median 249.7 2799 2.5
Mode 290.8 2666 2.5
Range 177.4 0 0
STDEV 37.21286253 290.4503702 0.491059304
On the basis of facts it can be said that on average people are making purchase of homes
at price of $253000. However, there are number of people that are making purchase of property
at level of $290000. There is lack of huge deviation in price of home as its value is only 37.21. In
terms of size also it is very important to analyze facts. Mean value of property size is 2812
square feet and it can be said that on average basis people are making purchase of homes whose
square feet size is 2813. Median value in case of price is 249.7 and same in case of size of homes
is 2799 which means these are the values in respect to variable that are classifying entire data set
in to multiple parts.Value of mode is 2666 which is indicating that there are many people that are
also making purchase of homes below mean size. Standard deviation size is moderate which
means that on medium pace people preference in terms of size of homes is changing. Number of
bathrooms in homes are 2.5 or 2 as well as 3 reflected by abobve given facts and figures.
Analyze business decision opportunities using descriptive statistics
There are some of the hidden opportunities as firm need to identify whether people are
giving much importance to price of homes or its size. If people are giving priority to home size
then small size home can be targeted to customers. People may prefer small size homes due to
their low prices. On other hand, in terms of price homes at high price can be targeted to
2 | P a g e
Paraphrase This Document
Need a fresh take? Get an instant paraphrase of this document with our AI Paraphraser

customers as they may prefer to buy costly homes in order to show their wealth to the people. By
following this strategy all sort of customers can be targeted in the business.
Analyze data in a prepared histogram to use in decision making
166-216 216-266 266-316 316-366
0
5
10
15
20
25
30
35
40
45
10
41
24
5
Home Price Range Histogram
Total
Figure 1Price range of homes
Interpretation
It can be observed from the chart that in range of 166-216 there are only 10 homes and in
range of 216 to 266 there are 41 homes. Apart from this, in price range of 266 to 316 there are 24
homes. Frequency get declined at huge rate at price range of 316 to 366 as there are only 5
homes in this category. Thus, it can be said that price range of 216 to 316 is one of best range in
which homes can be targeted to customers.
3 | P a g e

Analyze data in a scatter plot to use in decision making
150 200 250 300 350 400
0
500
1000
1500
2000
2500
3000
3500
4000
Size (Square Feet)
Figure 2Scatter plot
Chart is revealing that both price and plots size are correlated with each other as it can be
observed that data points are nearby to each other and both are moving hand in hand to each othe
(Ling and Archer, 2012)r. Thus, it can be said that if size of house will increase then price will
also enhanced.
Management report
To
The Top managers
Date: 13th November 2017
Subject: House pricing and size trends
In order to identify trends that are prevailed in property market data related to 80 homes was
gathered and same is analyzed to identify people buying behaviour. It is observed that both
price and home size are positively coorelated. Means that if size of homes elevate then in that
case house price is increased. It is also observed that across all categories there are buyers.
Means that there are few of buyers who are showing intrest in buying homes whose price is
high and some intends to buy homes whose size is low or average. On average basis people are
making purchase of home in range of $216 to $316. Hence, it can be said or recommended
that firm must focus homes that fall in mentioned price range in order to create more and more
customers in the business. While making business decision it is recommended that price mean,
price mode, size mean and size mode must be taken in to account. This is because mode reflect
4 | P a g e
⊘ This is a preview!⊘
Do you want full access?
Subscribe today to unlock all pages.

Trusted by 1+ million students worldwide

specific sort of customers that are small in size but can be important for the firm. Whereas
mean value reflect customers that are usually making purchase of asset at specific price range
and size of home. Thus, for proper targeting business managers must use both sort of statistical
tools.
CONCLUSION
On the basis of above discussion it is concluded that there is significent relationship
between house price and size. This means that if house size is high then price of the house will
also skyrocket. Price range related strategy can be formulated by the firms to target customers in
proper manner in the business.
5 | P a g e
Paraphrase This Document
Need a fresh take? Get an instant paraphrase of this document with our AI Paraphraser

REFERENCES
Books and Journals
Ling, D. and Archer, W., 2012. Real estate principles: A value approach. McGraw-Hill Higher
Education.
6 | P a g e
Books and Journals
Ling, D. and Archer, W., 2012. Real estate principles: A value approach. McGraw-Hill Higher
Education.
6 | P a g e
1 out of 8
Related Documents

Your All-in-One AI-Powered Toolkit for Academic Success.
 +13062052269
info@desklib.com
Available 24*7 on WhatsApp / Email
Unlock your academic potential
Copyright © 2020–2025 A2Z Services. All Rights Reserved. Developed and managed by ZUCOL.