Data Collection, Design, and Implementation: Research Report Analysis

Verified

Added on  2020/03/16

|22
|2345
|37
Report
AI Summary
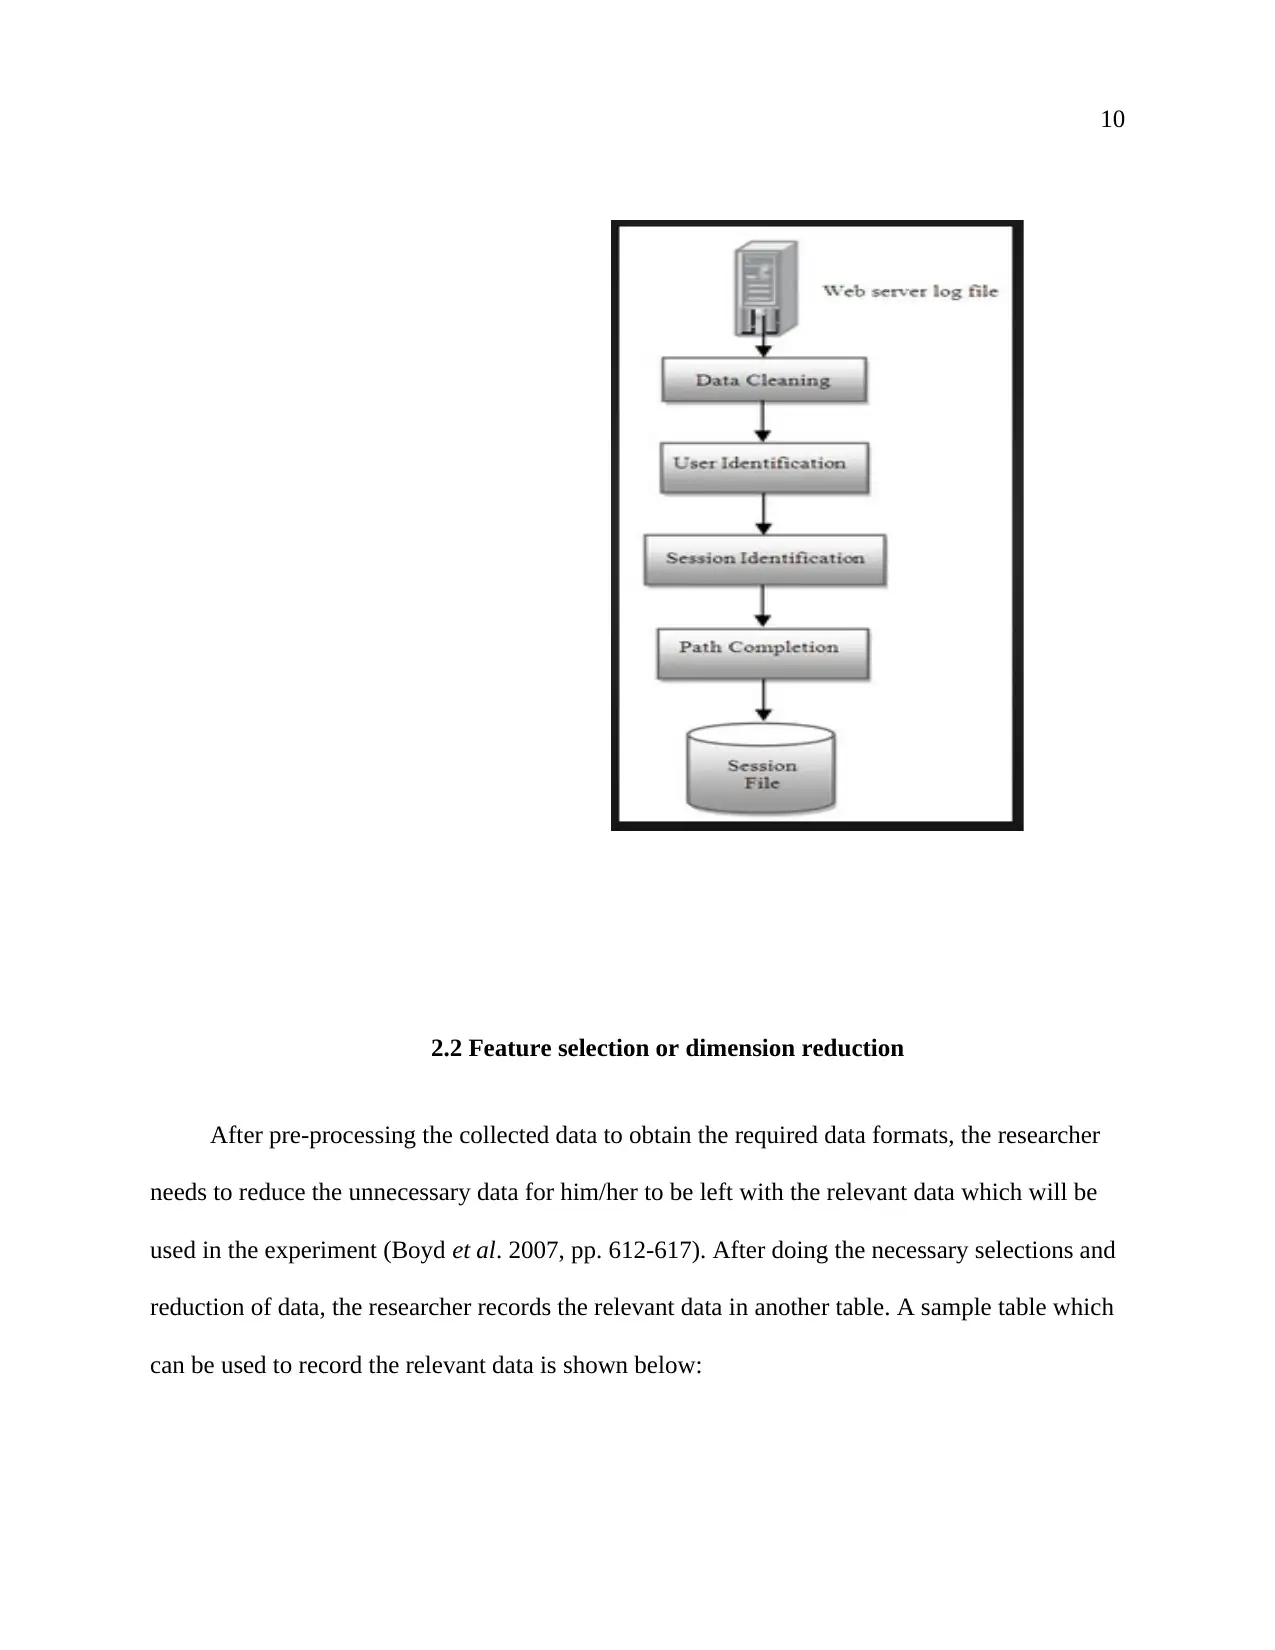
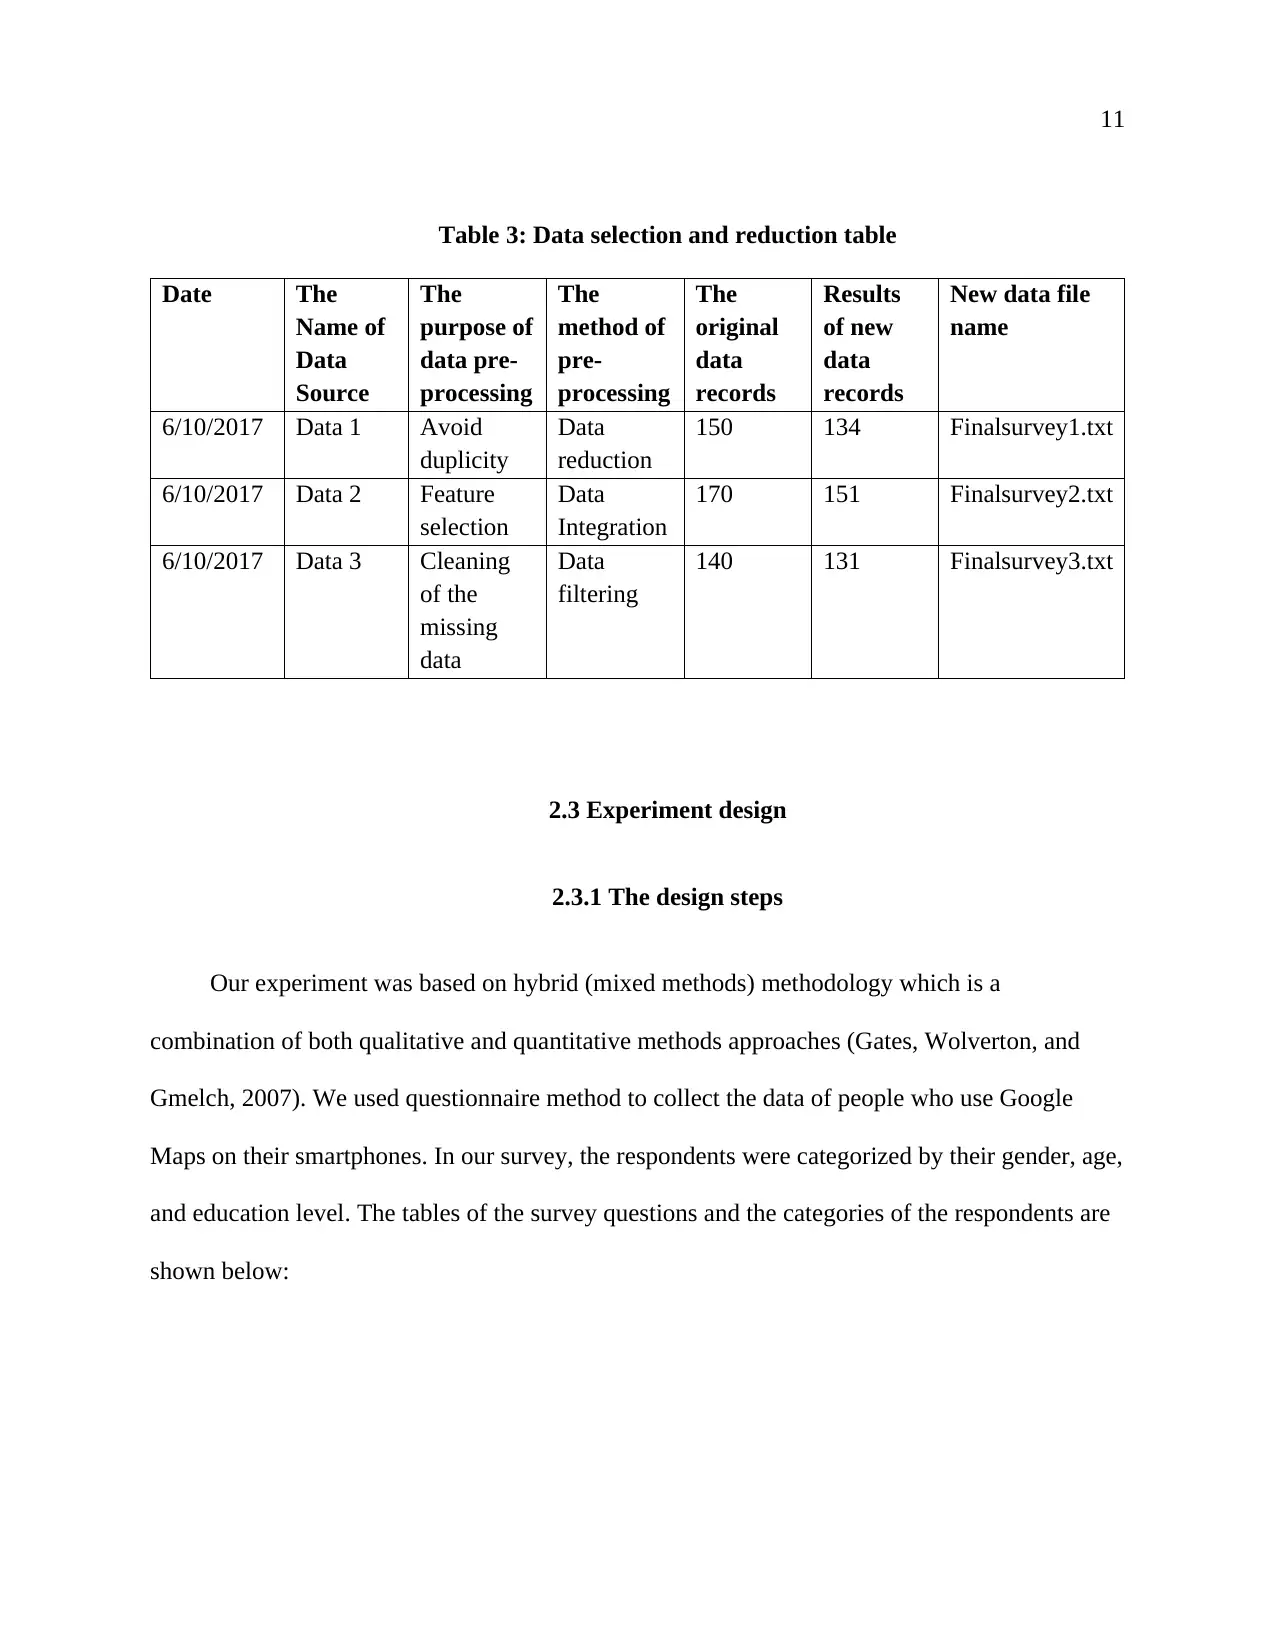
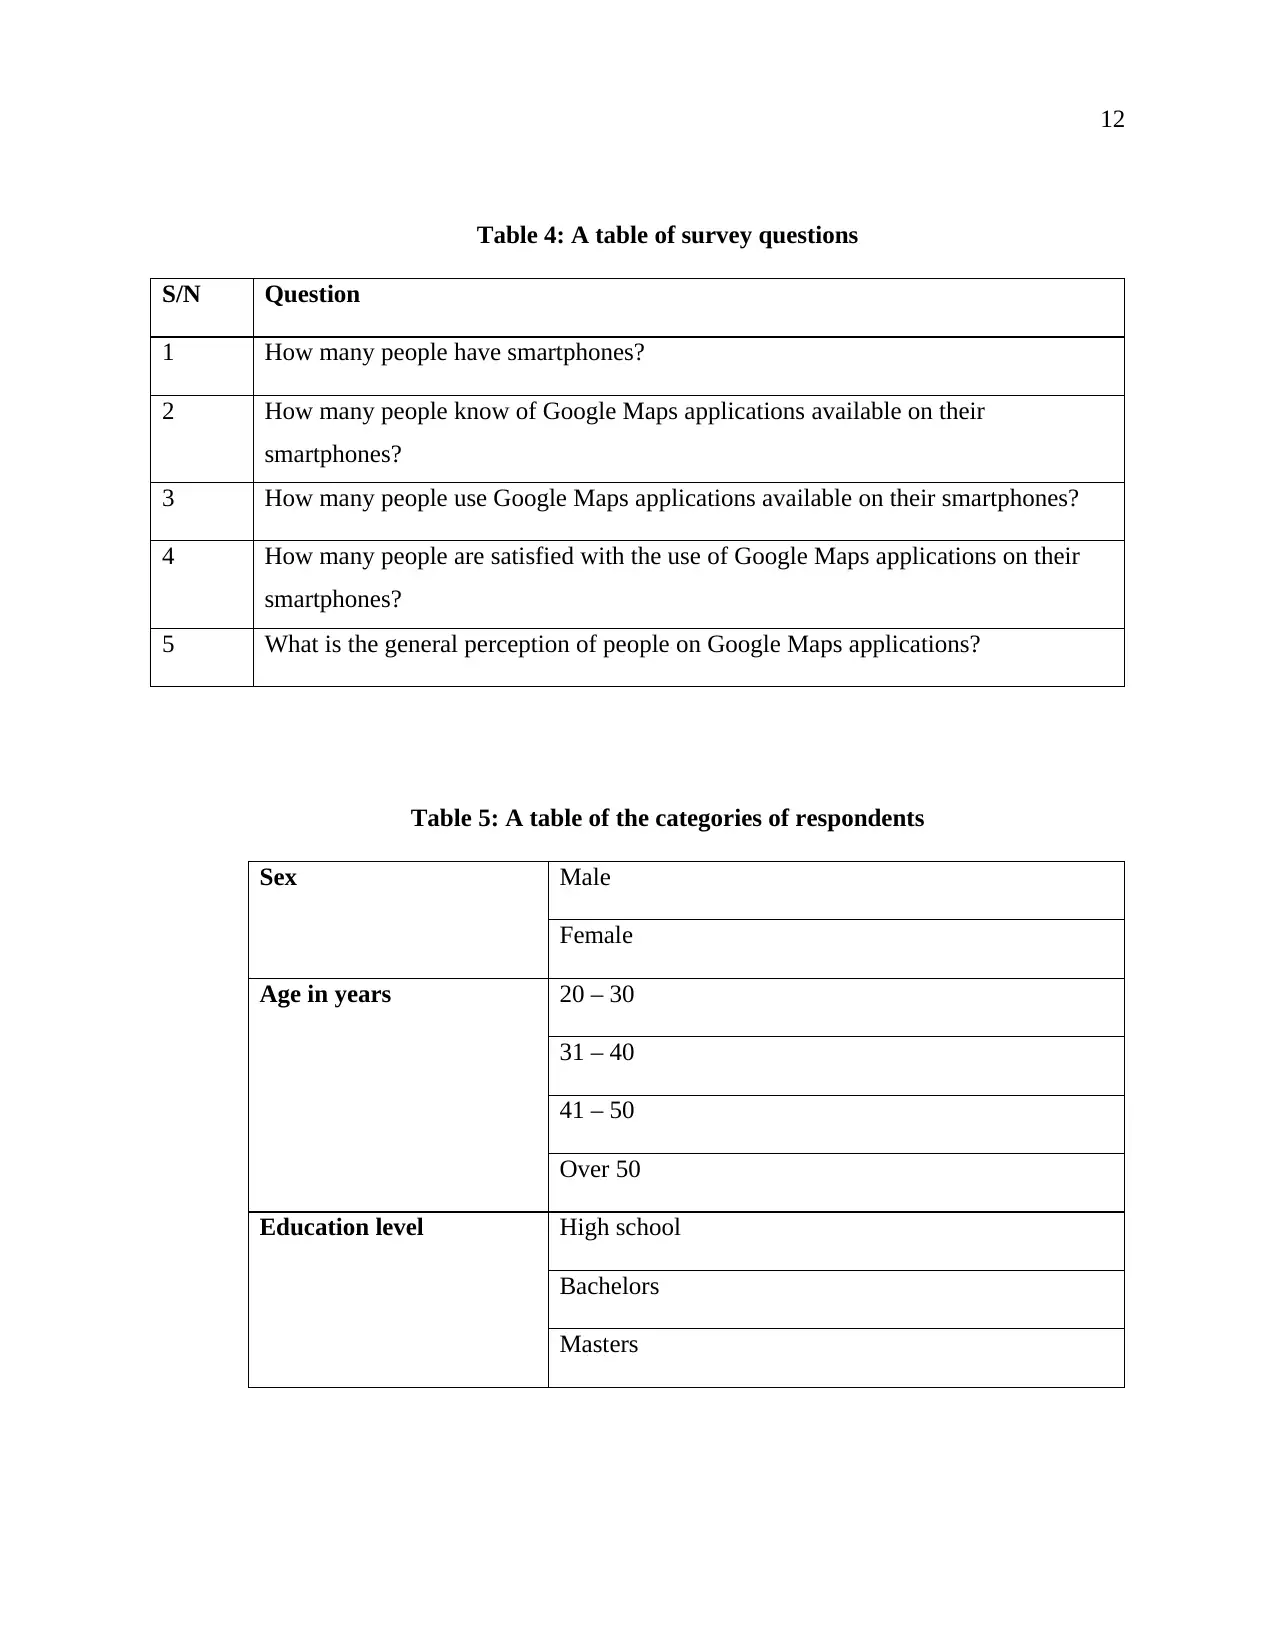
This report provides a comprehensive overview of a research project focused on data collection, design, and implementation. The study begins with an introduction to data collection, detailing the sources of data and methods for its acquisition and storage. It then delves into the design and implementation phases, including data pre-processing techniques, feature selection, and experiment design, with specific focus on the use of hybrid methodologies. The implementation section highlights the software and tools used, along with data representation through charts and graphs. The report concludes with an analysis of the results, summarizing the findings and comparing them to the expected outcomes. The research utilized a survey methodology, categorizing respondents by gender, age, and education level, to gather data on smartphone and Google Maps usage, and the results are presented in tables and charts.
Document Page
1
INTRODUCTION TO RESEARCH
The Name of the Student
The Name of the Course
The Name of the Professor
The Name of the School
The City and State where it is located
Date
tabler-icon-diamond-filled.svg

Secure Best Marks with AI Grader

Need help grading? Try our AI Grader for instant feedback on your assignments.
Document Page
2
Table of contents
List of tables..........................................................................................................................4
List of figures........................................................................................................................5
1.0 Data collection................................................................................................................6
1.1 The sources of data.....................................................................................................6
1.2 Collection of data........................................................................................................6
1.3 Storage of data............................................................................................................7
2.0 Design and implementation...........................................................................................8
2.1 Data pre-processing...................................................................................................8
2.2 Feature selection or dimension reduction................................................................9
2.3 Experiment design....................................................................................................10
2.3.1 The design steps.................................................................................................10
2.4 Implementation........................................................................................................12
2.4.1 The software and tools used in the implementation.......................................12
2.4.2 Representation of the numbers of respondents using charts/graphs...........13
Document Page
3
2.4.3 The results of the experiment...........................................................................15
3.0 Results analysis and summary....................................................................................18
3.1 The expected results.................................................................................................18
3.2 The summary of the results.....................................................................................18
4.0 Outline of experiment and result analysis.................................................................19
References...........................................................................................................................21
Document Page
4
List of tables
Table 1: Data collection table..............................................................................................4
Table 2: Data storage table..................................................................................................5
Table 3: Data selection and reduction table......................................................................7
Table 4: A table of survey questions...................................................................................8
Table 5: A table of the categories of respondents..............................................................9
Table 6: Table of respondents (The total number of participants =500)......................10
tabler-icon-diamond-filled.svg

Secure Best Marks with AI Grader

Need help grading? Try our AI Grader for instant feedback on your assignments.
Document Page
5
Table 7: A table of survey questions and results.............................................................14
List of figures
Figure 1: Data pre-processing.............................................................................................7
Figure 2: A pie chart showing the percentages of respondents according to their age
.......................................................................................................................................................12
Figure 3: A pie chart showing the percentages of the respondents according to their
age in years...................................................................................................................................13
Figure 4: A bar graph showing the percentages of the respondents according to their
education level..............................................................................................................................14
Figure 5: A bar graph showing the results of the research questions...........................16
Document Page
6
1.0 Data collection
Data collection is usually the first step in any experiment. Before we start any experiment,
we need to collect the data to be used in our experiment. The data collected will help the
researcher to get the solutions of his or her experiment (Goodman, Cryder, and Cheema, 2013,
pp.213-224). The data is usually collected from different sources which contain the required
data.
1.1 The sources of data
In carrying out any research, we need to collect the required data from the relevant sources.
The sources of data may be institutions, organizations, different people, or any other relevant
Document Page
7
source which contain the required data. The researchers have the responsibilities of identifying
the relevant sources of the required data (Hinkelmann, 2011).
1.2 Collection of data
After collection of the required data from the relevant sources, we should record the data in
in tables. A sample table which can be used to record the collected data is shown below:
Table 1: Data collection table
The Name
of Data
Source
Source
Organization
(institutions,
organizations,
people’s parks)
Data Description Data File
Format
Charge
Fee
The
Target
Data
Source
Data 1 The public How many people
have smartphones?
Text Free Yes
Data 2 The public How many people
know of Google Maps
applications available
on their smartphones?
Text Free Yes
Data 3 The public How many people use
Google Maps
applications available
on their smartphones?
Text Free Yes
Data 4 The public How is the general
perception of the
people on the Google
Maps applications?
Text Free Yes
Data 5 The public How many people are
satisfied with the use
Google Maps
applications on their
smartphones?
Text Free Yes
tabler-icon-diamond-filled.svg

Paraphrase This Document

Need a fresh take? Get an instant paraphrase of this document with our AI Paraphraser
Document Page
8
1.3 Storage of data
After collection and recording of data, we should generate another table which should store
the raw data which was collected from the field during data collection. This data storage table
will help in storing the raw data safely for future use (Heckman and Falk, 2009, pp. 535-538). A
table which can be used for storage of raw data is shown below:
Table 2: Data storage table
The Name of
Data Source
Date of Data
Collection
Saved File
Location
Saved File
Name
Saved File
Format
Number of
Data
Records
Survey from
institutions
25/9/2017 //raw data/ Survey.txt Text 150
Survey from
organizations
29/9/2017 //raw data/ Survey.txt Text 170
Survey from
people’s
parks
4/10/2017 //raw data/ Survey.txt Text 140
2.0 Design and implementation
After the process of data collection and data storage, the researcher needs to design and
implement the experiment (Myers and Montgomery, 2016). The design process involves
describing and explaining some variations of the experiment, while implementation entails
carrying out the actual experiment process (Talbi, 2009). Design and implementation of the
Document Page
9
experiment will help to obtain the desired results of the experiment. The design and
implementation process involves some experimental activities such as data pre-processing,
dimensions reductions, and other activities meant to achieve good experimental results (Fleiss,
2011).
2.1 Data pre-processing
Sometimes the researchers may collect some raw data which is not ready for use in the
experiment and needs some modifications for it to be used in the experiment. This data needs to
be pre-processed for it to fit well in the methodology (Montgomery, 2017). The step of data pre-
processing involves doing all the modifications necessary to the collected data for the data to fit
well in the experimental analysis (Figo, Diniz, and Ferreira, 2010, pp.645-662). A sample data
pre-processing process is shown in the figure below:
Figure 1: Data pre-processing
Document Page
10
2.2 Feature selection or dimension reduction
After pre-processing the collected data to obtain the required data formats, the researcher
needs to reduce the unnecessary data for him/her to be left with the relevant data which will be
used in the experiment (Boyd et al. 2007, pp. 612-617). After doing the necessary selections and
reduction of data, the researcher records the relevant data in another table. A sample table which
can be used to record the relevant data is shown below:
tabler-icon-diamond-filled.svg

Secure Best Marks with AI Grader

Need help grading? Try our AI Grader for instant feedback on your assignments.
Document Page
11
Table 3: Data selection and reduction table
Date The
Name of
Data
Source
The
purpose of
data pre-
processing
The
method of
pre-
processing
The
original
data
records
Results
of new
data
records
New data file
name
6/10/2017 Data 1 Avoid
duplicity
Data
reduction
150 134 Finalsurvey1.txt
6/10/2017 Data 2 Feature
selection
Data
Integration
170 151 Finalsurvey2.txt
6/10/2017 Data 3 Cleaning
of the
missing
data
Data
filtering
140 131 Finalsurvey3.txt
2.3 Experiment design
2.3.1 The design steps
Our experiment was based on hybrid (mixed methods) methodology which is a
combination of both qualitative and quantitative methods approaches (Gates, Wolverton, and
Gmelch, 2007). We used questionnaire method to collect the data of people who use Google
Maps on their smartphones. In our survey, the respondents were categorized by their gender, age,
and education level. The tables of the survey questions and the categories of the respondents are
shown below:
Document Page
12
Table 4: A table of survey questions
S/N Question
1 How many people have smartphones?
2 How many people know of Google Maps applications available on their
smartphones?
3 How many people use Google Maps applications available on their smartphones?
4 How many people are satisfied with the use of Google Maps applications on their
smartphones?
5 What is the general perception of people on Google Maps applications?
Table 5: A table of the categories of respondents
Sex Male
Female
Age in years 20 – 30
31 – 40
41 – 50
Over 50
Education level High school
Bachelors
Masters
Document Page
13
2.4 Implementation
2.4.1 The software and tools used in the implementation
Our implementation will use Excel software to analyze the collected data. We shall covert
the collected data into percentage and draw pie charts and bar graphs to tabulate the results in
graphical forms. The pie charts and bar graphs will enhance the visualization of the results
(Peters and Schonlau, 2008). The table of the collected data is shown below:
Table 6: Table of respondents (The total number of participants =500)
Features Responses Responses in percentage
(%)
Sex Male 305 61%
Female 195 39%
Age in
years
20-30 221 44.2%
31-40 115 23%
41-50 90 18%
Over 50 74 14.8%
Education
Level
High school 155 31%
Bachelors 239 47.8%
Masters 106 21.2%
tabler-icon-diamond-filled.svg

Paraphrase This Document

Need a fresh take? Get an instant paraphrase of this document with our AI Paraphraser
Document Page
14
2.4.2 Representation of the numbers of respondents using charts/graphs
Figure 2: A pie chart showing the percentages of respondents according to their age
Figure 3: A pie chart showing the percentages of the respondents according to their
age in years
61%
39%
Male Female
Document Page
15
44%
23%
18%
15%
20-30 31-40 41-50 Over 50
Document Page
16
Figure 4: A bar graph showing the percentages of the respondents according to their
education level
2.4.3 The results of the experiment
In our research, we used five hundred respondents, and the following table summarizes our
research results:
High school Bachelors Masters
0%
10%
20%
30%
40%
50%
60%
31.00%
47.80%
21.20%
Education level
% of respondents
tabler-icon-diamond-filled.svg

Secure Best Marks with AI Grader

Need help grading? Try our AI Grader for instant feedback on your assignments.
Document Page
17
Table 7: A table of survey questions and results
S/N Question Result Result as %
of total
sample size
1 How many people have smartphones? 426 85.2%
2 How many people know of Google Maps
applications available on their smartphones?
355 71%
3 How many people use Google Maps
applications available on their smartphones?
286 57.2%
4 How many people are satisfied with the use
of Google Maps applications on their
smartphones?
264 52.8%
5 What is the general perception of people on
Google Maps applications?
Google Maps
are generally
good
-----
Document Page
18
Figure 5: A bar graph showing the results of the research questions
Number of people with
smartphones Number of people who
know of Google Maps
applications
Number of people who use
Google Maps applications Number of people satisfied
with Google Maps
applications
0
50
100
150
200
250
300
350
400
450
426
355
286 264
Results
Number of people
Document Page
19
3.0 Results analysis and summary
3.1 The expected results
Due to the increasing literacy level and a rise in the level of technology, most people in the
world have embraced the use of smartphones due to their many advantages to the users (Tossell,
Kortum, and Rahmati, 2012, pp. 2769-2778). In our research, we expect that about seventy
percent of the respondents use smartphones and about thirty percent of the users of smartphones
normally use Google Maps applications.
3.2 The summary of the results
After doing our research which involved surveying 500 respondents, we obtained the
following results:
426 people have smartphones.
355 know of Google Maps applications available on their smartphones.
286 people use Google Maps applications.
264 people are satisfied with Google Maps applications on their smartphones.
From our research, we can also conclude by saying the perception towards Google Maps
applications from the people who use the applications is generally good. From our research, we
realized most of the people who were using Google Maps applications were happy and
comfortable with the applications.
tabler-icon-diamond-filled.svg

Paraphrase This Document

Need a fresh take? Get an instant paraphrase of this document with our AI Paraphraser
Document Page
20
4.0 Outline of experiment and result analysis
1.0 Data collection
1.1 The sources of data
1.2 Collection of data
1.3 Storage of data
2.0 Design and implementation
2.1 Data pre-processing
2.2 Feature selection or dimension reduction
2.3 Experiment design
2.3.1 The design steps
2.4 Implementation
2.4.1 The software and tools used in the implementation
2.4.2 Representation of the results using charts/graphs
2.4.3 The results of the experiment
Document Page
21
3.0 Results analysis and summary
3.1 The expected results
3.2 The summary of the results
Document Page
22
References
Chad Tossell, P. K. a. A. R., 2012. Characterizing web use on smartphones. The ACM Guide to
Computing Literature, pp. 2769-2778 .
Davide Figo, P. C. D. a. D. R. F., 2010. Preprocessing techniques for context recognition from
accelerometer data. Personal and Ubiquitous Computing, 14(7), pp. 645-662 .
Fleiss, J. L., 2011. Design and Analysis of Clinical Experiments. 1st ed. New York: John Wiley
and Sons, Inc.
Gordon S. Gates, M. W. a. W. H. G., 2007. Emerging Thought and Research on Student,
Teacher, and Administrator Stress and Coping. Washington DC: Information Age Publishing,
Inc.
Heckman, A. F. a. J. J., 2009. Lab Experiments Are a Major Source of Knowledge in the Social
Sciences. Science, 326(5952), pp. 535-538.
Hinkelmann, K., 2011. Design and Analysis of Experiments, Volume 3: Special Designs and
Applications. 3rd ed. Virginia: Wiley and sons Inc.
Joseph K. Goodman, C. E. C. a. A. C., 2013. Data Collection in a Flat World: The Strengths and
Weaknesses of Mechanical Turk Samples. Journal of Behavioral Decision Making, 26(3), p.
213–224.
chevron_up_icon
1 out of 22
circle_padding
hide_on_mobile
zoom_out_icon
[object Object]