Numeracy and Data Analysis of Dorking West Railway Station Data

Verified

Added on  2020/10/23

|9
|1236
|372
Report
AI Summary
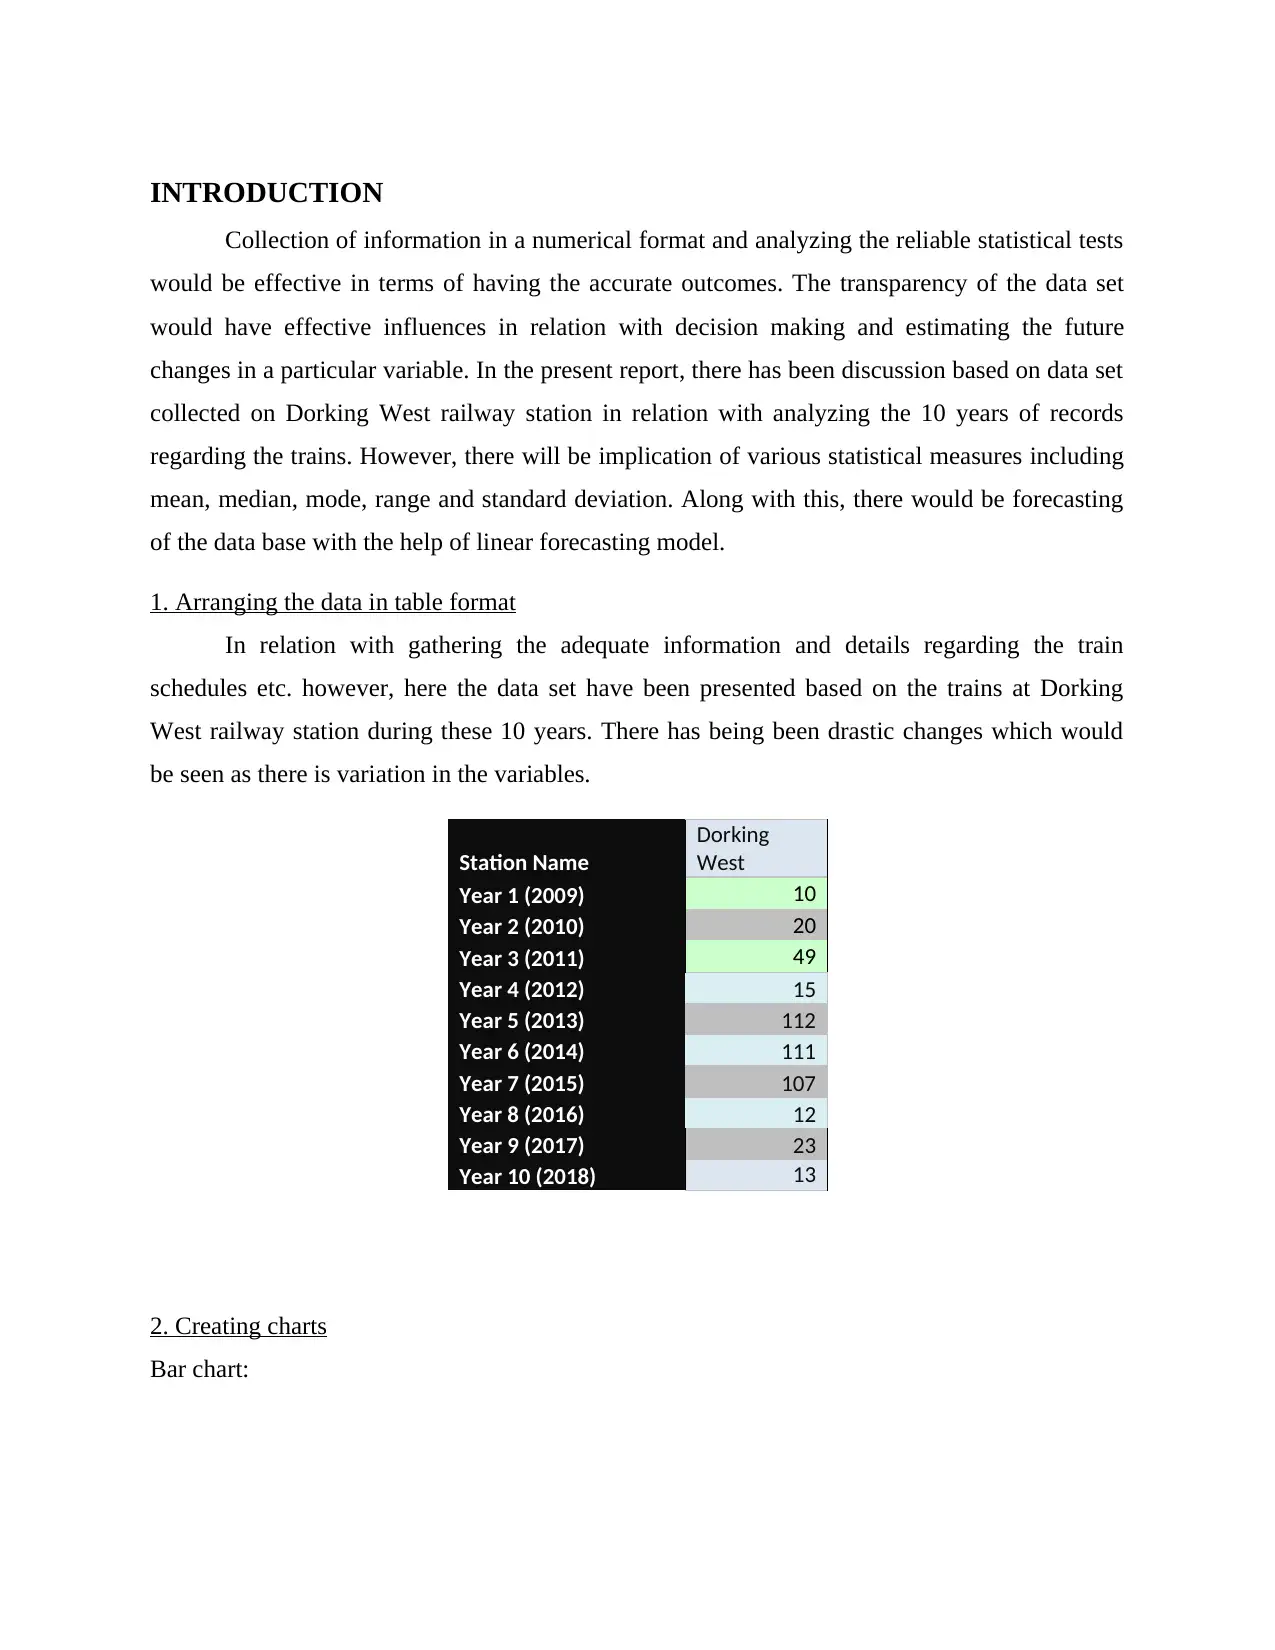
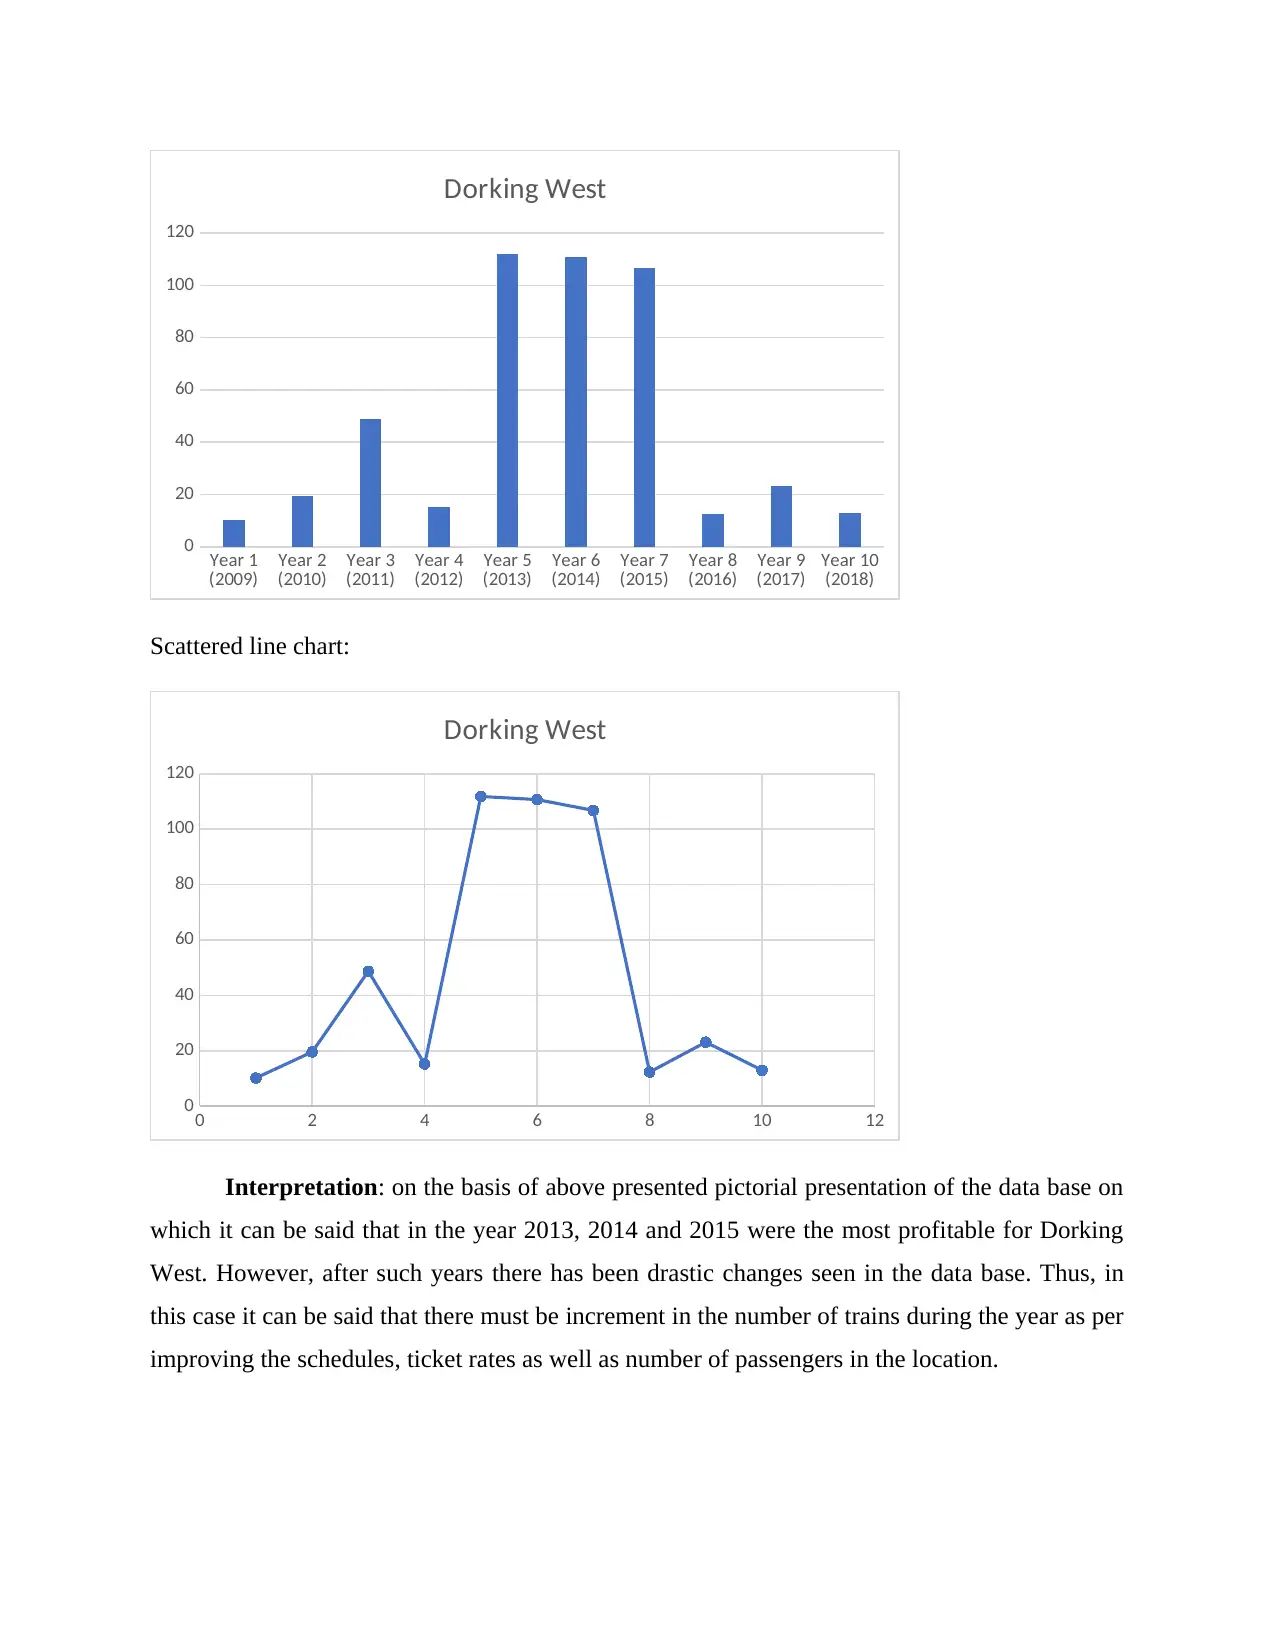
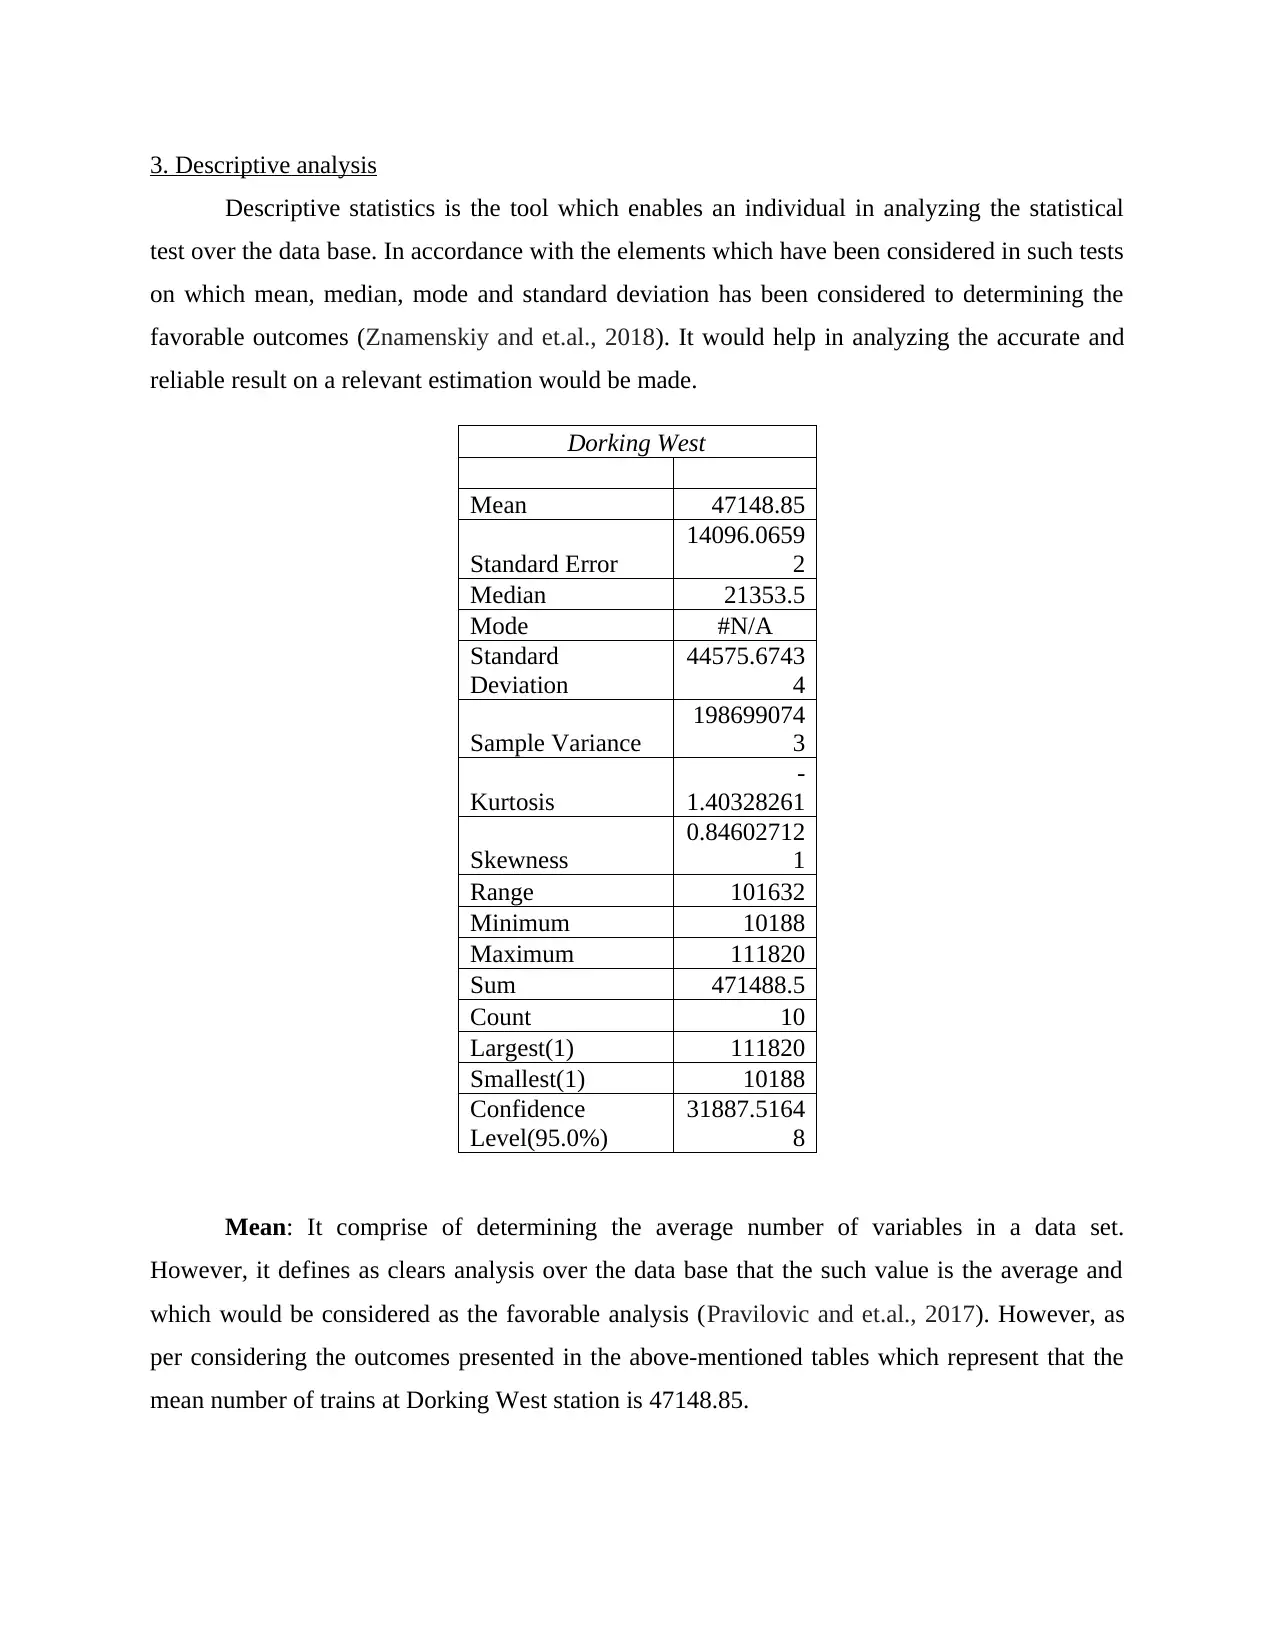
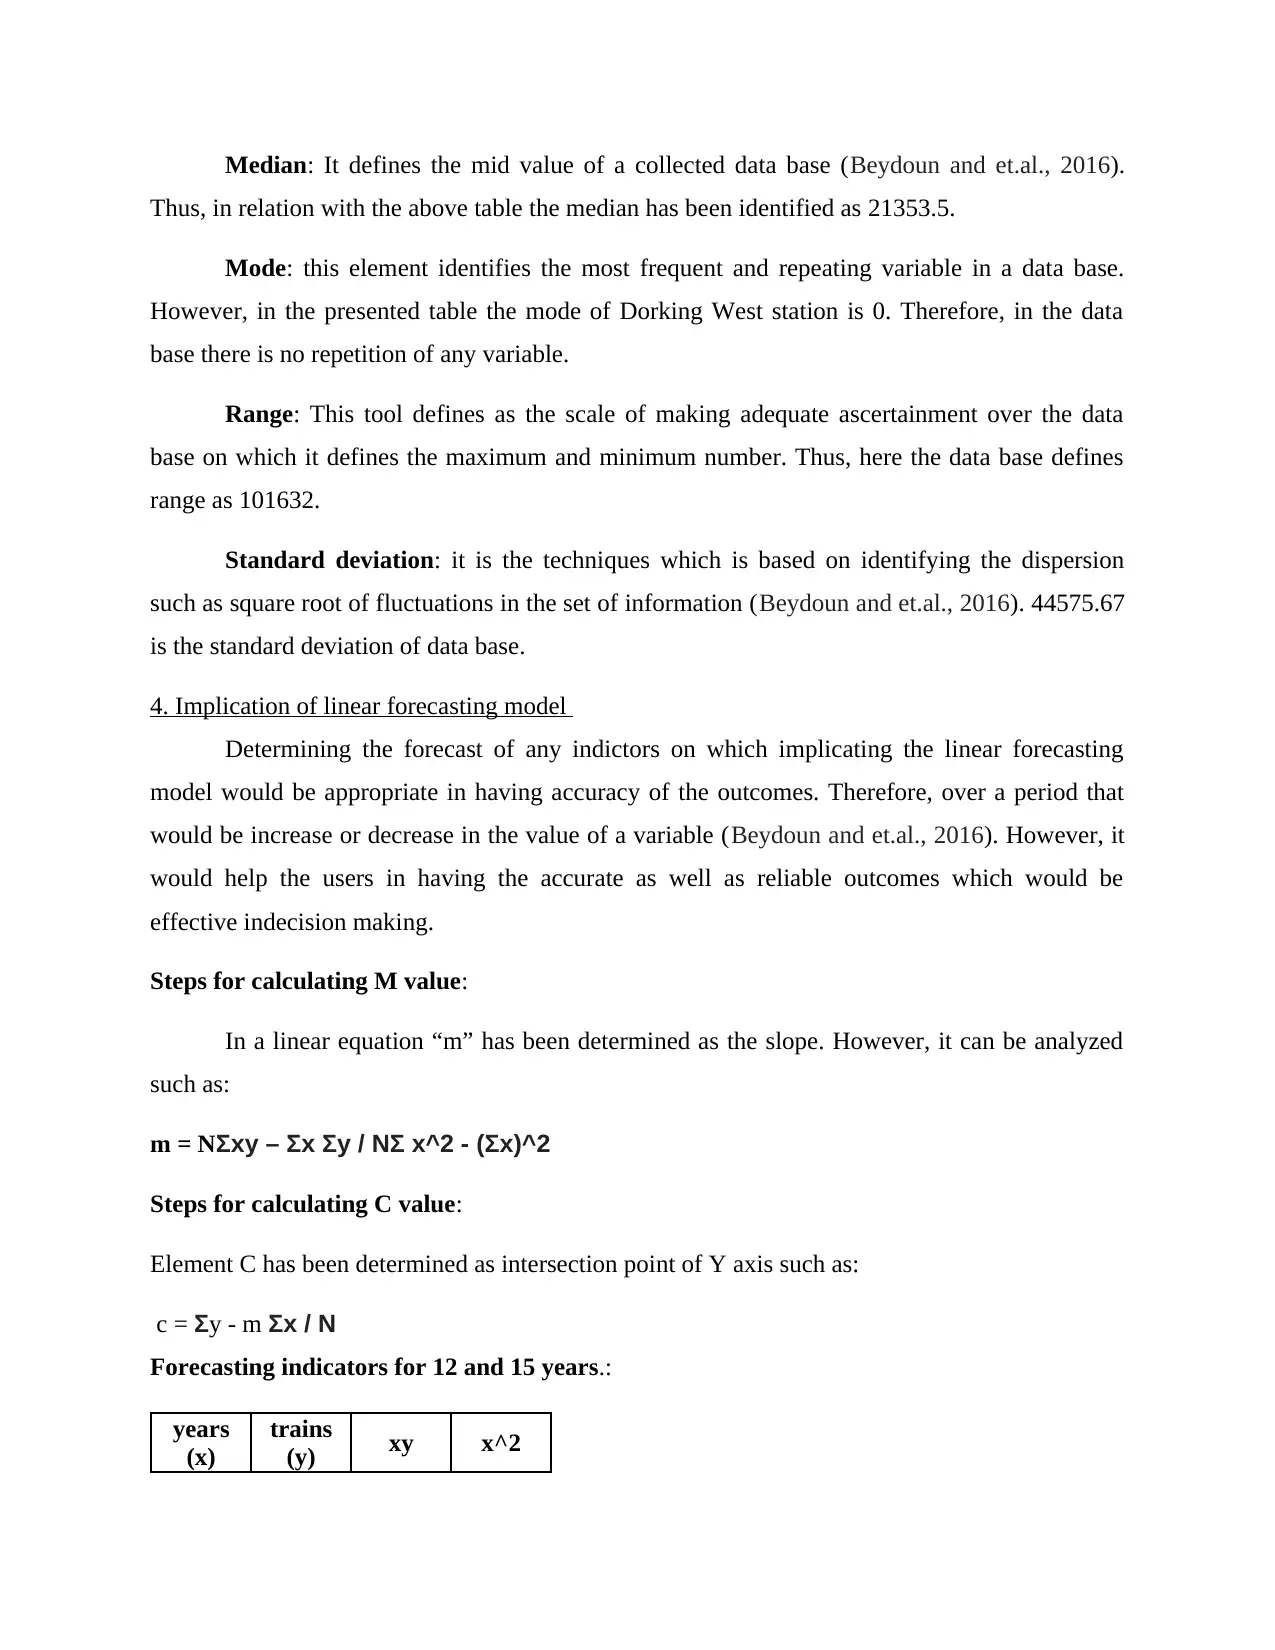
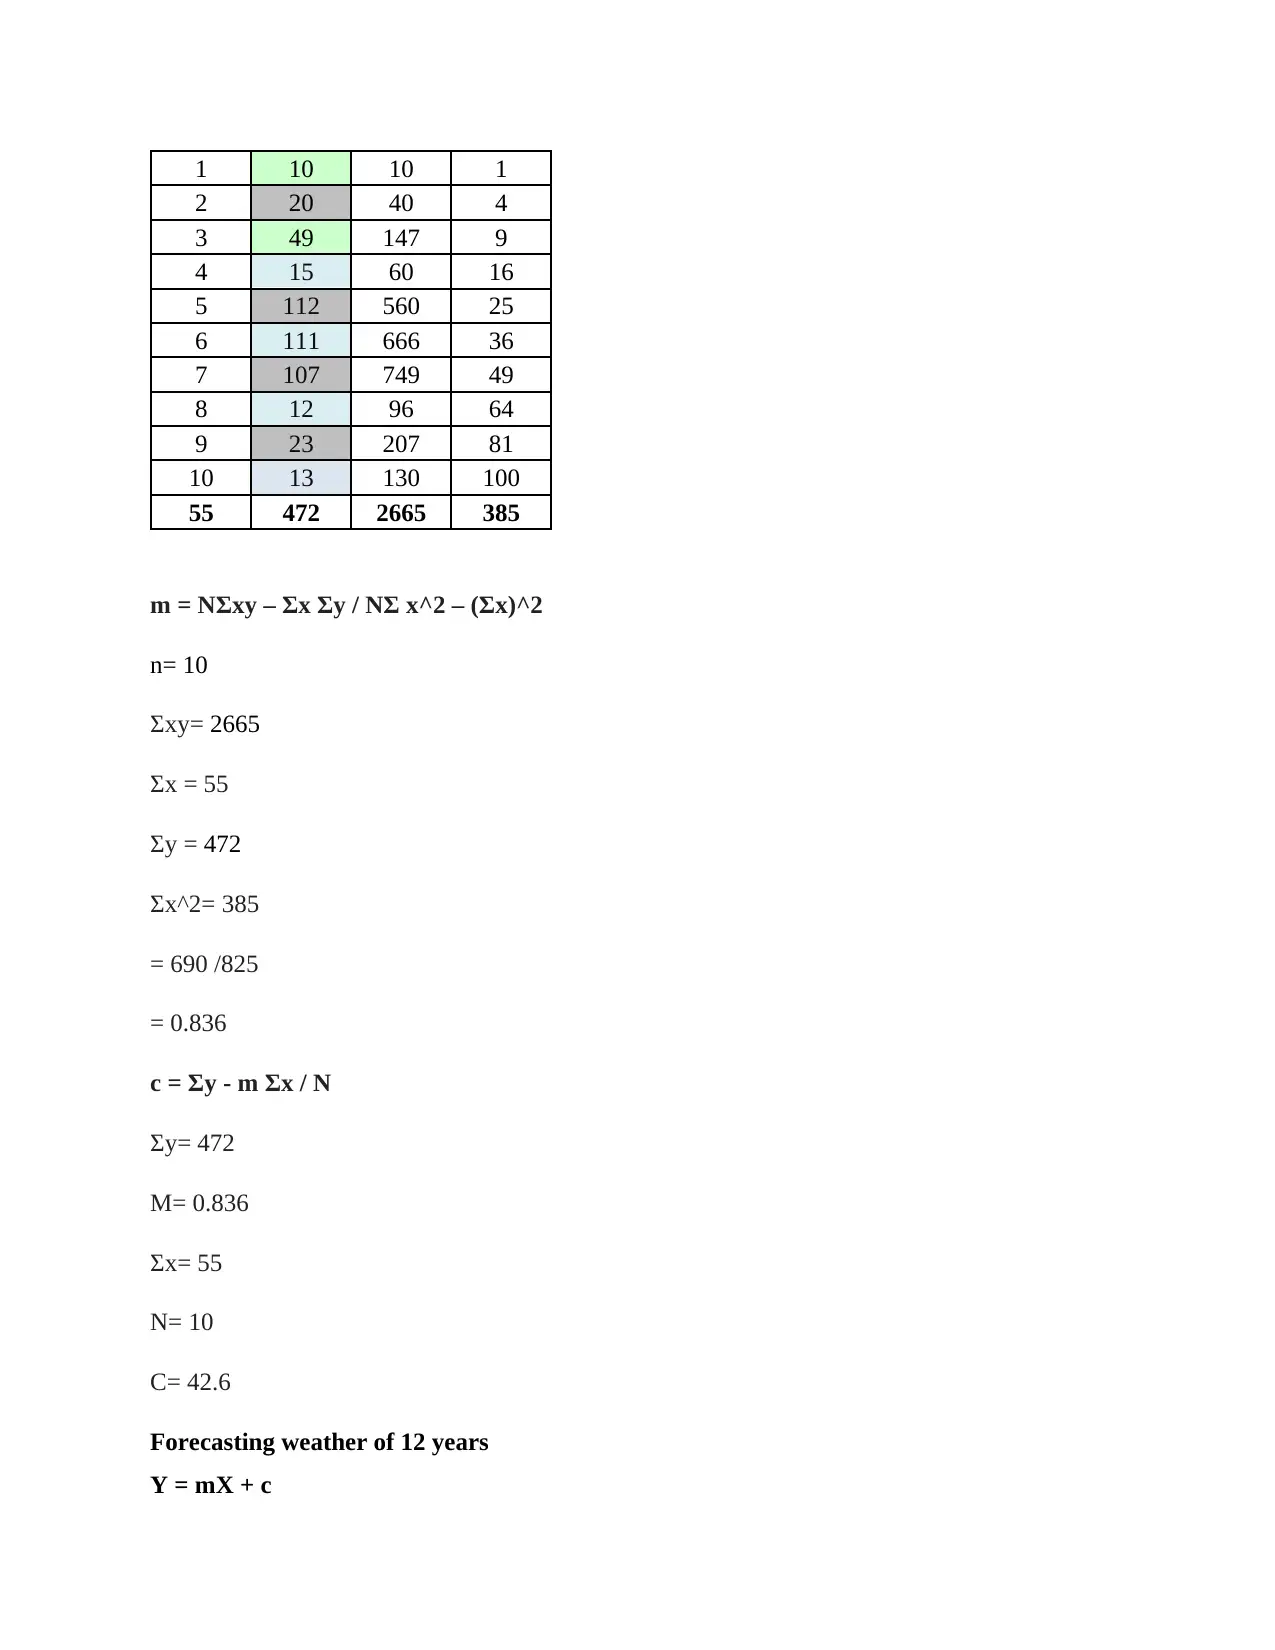
This report presents a comprehensive analysis of train data from Dorking West railway station over a 10-year period. It begins by arranging the data in a tabular format and creating visual representations using bar and scattered line charts to highlight trends. The core of the report involves descriptive statistical analysis, including calculations of mean, median, mode, range, and standard deviation to provide insights into the data's central tendencies and dispersion. Furthermore, the report applies a linear forecasting model to predict future trends in the data, specifically forecasting for the 12th and 15th years. The report concludes by summarizing the findings and emphasizing the importance of statistical measures and forecasting models in drawing accurate conclusions and making informed decisions based on the data.
Document Page
NUMERACY AND DATA ANALYSIS
tabler-icon-diamond-filled.svg

Secure Best Marks with AI Grader

Need help grading? Try our AI Grader for instant feedback on your assignments.
Document Page
TABLE OF CONTENTS
INTRODUCTION...........................................................................................................................3
1. Arranging the data in table format...........................................................................................3
2. Creating charts.........................................................................................................................3
3. Descriptive analysis.................................................................................................................5
4. Implication of linear forecasting model...................................................................................6
CONCLUSION................................................................................................................................8
REFERENCES................................................................................................................................9
Document Page
INTRODUCTION
Collection of information in a numerical format and analyzing the reliable statistical tests
would be effective in terms of having the accurate outcomes. The transparency of the data set
would have effective influences in relation with decision making and estimating the future
changes in a particular variable. In the present report, there has been discussion based on data set
collected on Dorking West railway station in relation with analyzing the 10 years of records
regarding the trains. However, there will be implication of various statistical measures including
mean, median, mode, range and standard deviation. Along with this, there would be forecasting
of the data base with the help of linear forecasting model.
1. Arranging the data in table format
In relation with gathering the adequate information and details regarding the train
schedules etc. however, here the data set have been presented based on the trains at Dorking
West railway station during these 10 years. There has being been drastic changes which would
be seen as there is variation in the variables.
Station Name
Dorking
West
Year 1 (2009) 10
Year 2 (2010) 20
Year 3 (2011) 49
Year 4 (2012) 15
Year 5 (2013) 112
Year 6 (2014) 111
Year 7 (2015) 107
Year 8 (2016) 12
Year 9 (2017) 23
Year 10 (2018) 13
2. Creating charts
Bar chart:
Document Page
Year 1
(2009) Year 2
(2010) Year 3
(2011) Year 4
(2012) Year 5
(2013) Year 6
(2014) Year 7
(2015) Year 8
(2016) Year 9
(2017) Year 10
(2018)
0
20
40
60
80
100
120
Dorking West
Scattered line chart:
0 2 4 6 8 10 12
0
20
40
60
80
100
120
Dorking West
Interpretation: on the basis of above presented pictorial presentation of the data base on
which it can be said that in the year 2013, 2014 and 2015 were the most profitable for Dorking
West. However, after such years there has been drastic changes seen in the data base. Thus, in
this case it can be said that there must be increment in the number of trains during the year as per
improving the schedules, ticket rates as well as number of passengers in the location.
tabler-icon-diamond-filled.svg

Secure Best Marks with AI Grader

Need help grading? Try our AI Grader for instant feedback on your assignments.
Document Page
3. Descriptive analysis
Descriptive statistics is the tool which enables an individual in analyzing the statistical
test over the data base. In accordance with the elements which have been considered in such tests
on which mean, median, mode and standard deviation has been considered to determining the
favorable outcomes (Znamenskiy and et.al., 2018). It would help in analyzing the accurate and
reliable result on a relevant estimation would be made.
Dorking West
Mean 47148.85
Standard Error
14096.0659
2
Median 21353.5
Mode #N/A
Standard
Deviation
44575.6743
4
Sample Variance
198699074
3
Kurtosis
-
1.40328261
Skewness
0.84602712
1
Range 101632
Minimum 10188
Maximum 111820
Sum 471488.5
Count 10
Largest(1) 111820
Smallest(1) 10188
Confidence
Level(95.0%)
31887.5164
8
Mean: It comprise of determining the average number of variables in a data set.
However, it defines as clears analysis over the data base that the such value is the average and
which would be considered as the favorable analysis (Pravilovic and et.al., 2017). However, as
per considering the outcomes presented in the above-mentioned tables which represent that the
mean number of trains at Dorking West station is 47148.85.
Document Page
Median: It defines the mid value of a collected data base (Beydoun and et.al., 2016).
Thus, in relation with the above table the median has been identified as 21353.5.
Mode: this element identifies the most frequent and repeating variable in a data base.
However, in the presented table the mode of Dorking West station is 0. Therefore, in the data
base there is no repetition of any variable.
Range: This tool defines as the scale of making adequate ascertainment over the data
base on which it defines the maximum and minimum number. Thus, here the data base defines
range as 101632.
Standard deviation: it is the techniques which is based on identifying the dispersion
such as square root of fluctuations in the set of information (Beydoun and et.al., 2016). 44575.67
is the standard deviation of data base.
4. Implication of linear forecasting model
Determining the forecast of any indictors on which implicating the linear forecasting
model would be appropriate in having accuracy of the outcomes. Therefore, over a period that
would be increase or decrease in the value of a variable (Beydoun and et.al., 2016). However, it
would help the users in having the accurate as well as reliable outcomes which would be
effective indecision making.
Steps for calculating M value:
In a linear equation “m” has been determined as the slope. However, it can be analyzed
such as:
m = NΣxy – Σx Σy / NΣ x^2 - (Σx)^2
Steps for calculating C value:
Element C has been determined as intersection point of Y axis such as:
c = Σy - m Σx / N
Forecasting indicators for 12 and 15 years.:
years
(x)
trains
(y) xy x^2
Document Page
1 10 10 1
2 20 40 4
3 49 147 9
4 15 60 16
5 112 560 25
6 111 666 36
7 107 749 49
8 12 96 64
9 23 207 81
10 13 130 100
55 472 2665 385
m = NΣxy – Σx Σy / NΣ x^2 – (Σx)^2
n= 10
Σxy= 2665
Σx = 55
Σy = 472
Σx^2= 385
= 690 /825
= 0.836
c = Σy - m Σx / N
Σy= 472
M= 0.836
Σx= 55
N= 10
C= 42.6
Forecasting weather of 12 years
Y = mX + c
tabler-icon-diamond-filled.svg

Paraphrase This Document

Need a fresh take? Get an instant paraphrase of this document with our AI Paraphraser
Document Page
X= 12
= 0.836*12 + 42.6
= 52.632
Forecasting weather of 15 years
Y = mX + c
X= 12
= 0.836*15 + 42.6
= 55.14
CONCLUSION
On the basis of above analyzed report, on which it can be said that, implication of
statistical measures has effective influences in defining the accurate outcomes. The report has
presented the outcomes on the basis of mean, median, mode, rage and standard deviation levied
over the data base of 10 years trains at Dorking West. Along with this, in relation with
forecasting the variables for 12 and 15 years, there was application of linear forecasting model.
Document Page
REFERENCES
Books and Journals
Beydoun, M. A. and et.al., 2016. Racial disparities in adult all-cause and cause-specific mortality
among us adults: mediating and moderating factors. BMC public health. 16(1). p.1113.
Pravilovic, S. and et.al., 2017. Using multiple time series analysis for geosensor data
forecasting. Information Sciences. 380. pp.31-52.
Znamenskiy, P. and et.al., 2018. Functional selectivity and specific connectivity of inhibitory
neurons in primary visual cortex. bioRxiv, p.294835.
chevron_up_icon
1 out of 9
circle_padding
hide_on_mobile
zoom_out_icon
[object Object]