Business Data and Analytics and IT Skills Data Analysis Report

Verified

Added on  2023/01/07

|17
|1249
|74
Report
AI Summary
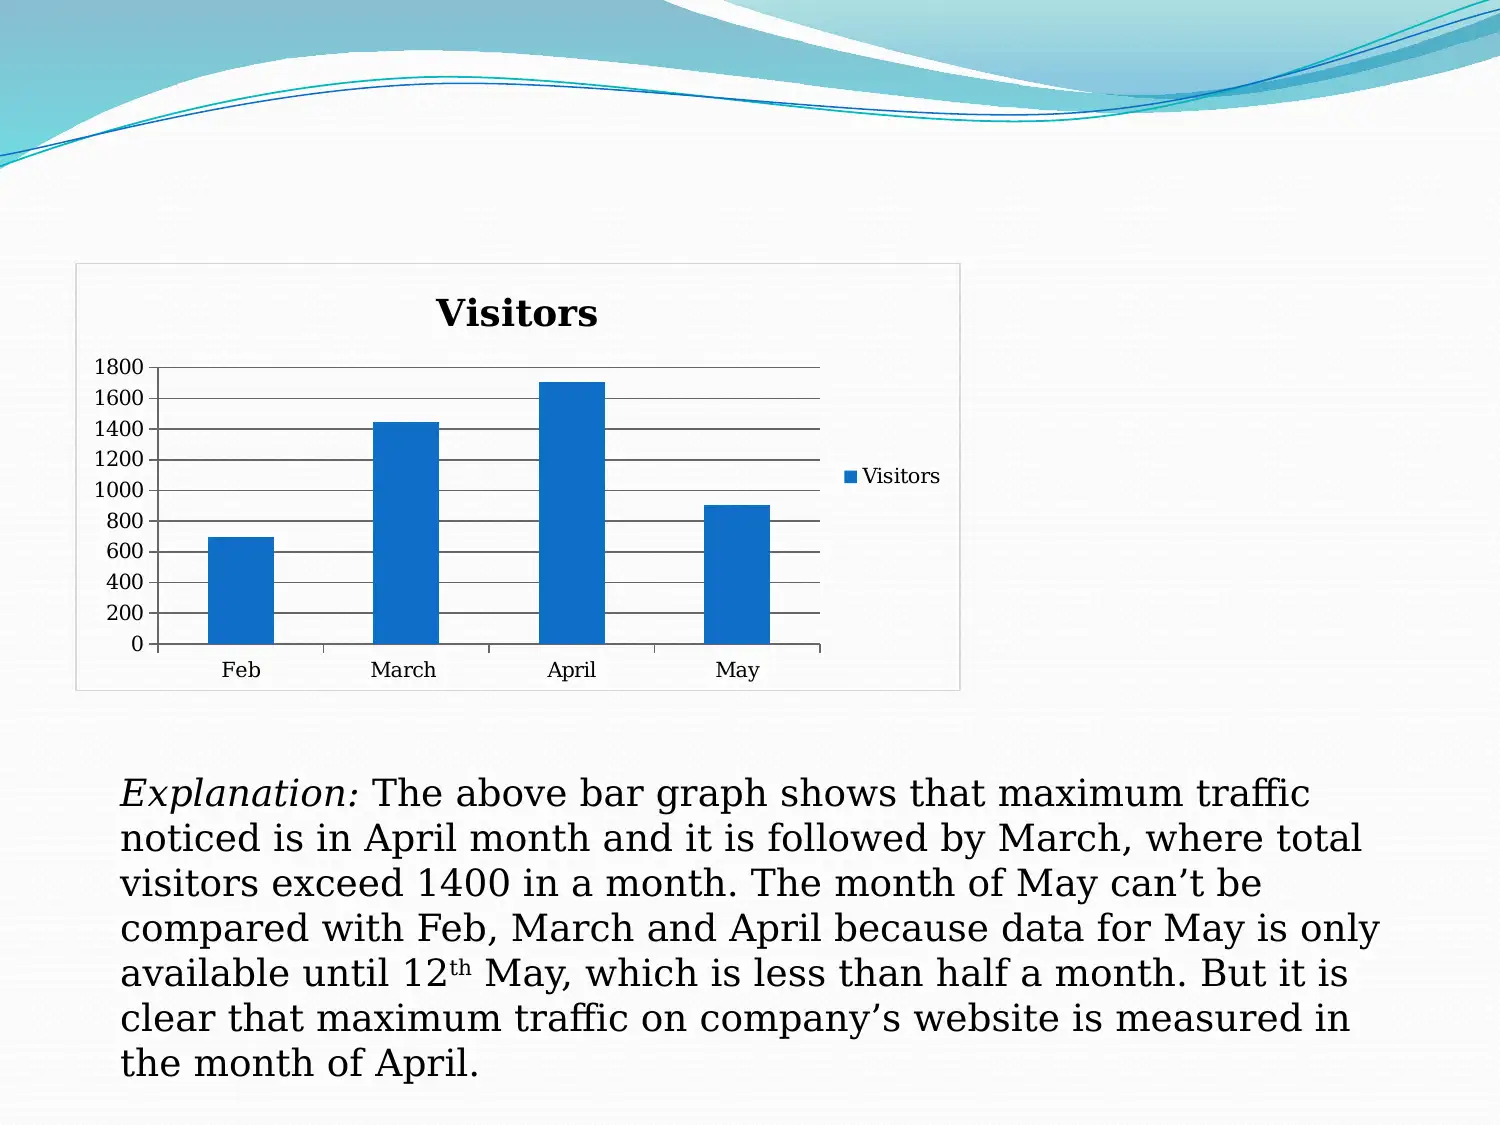
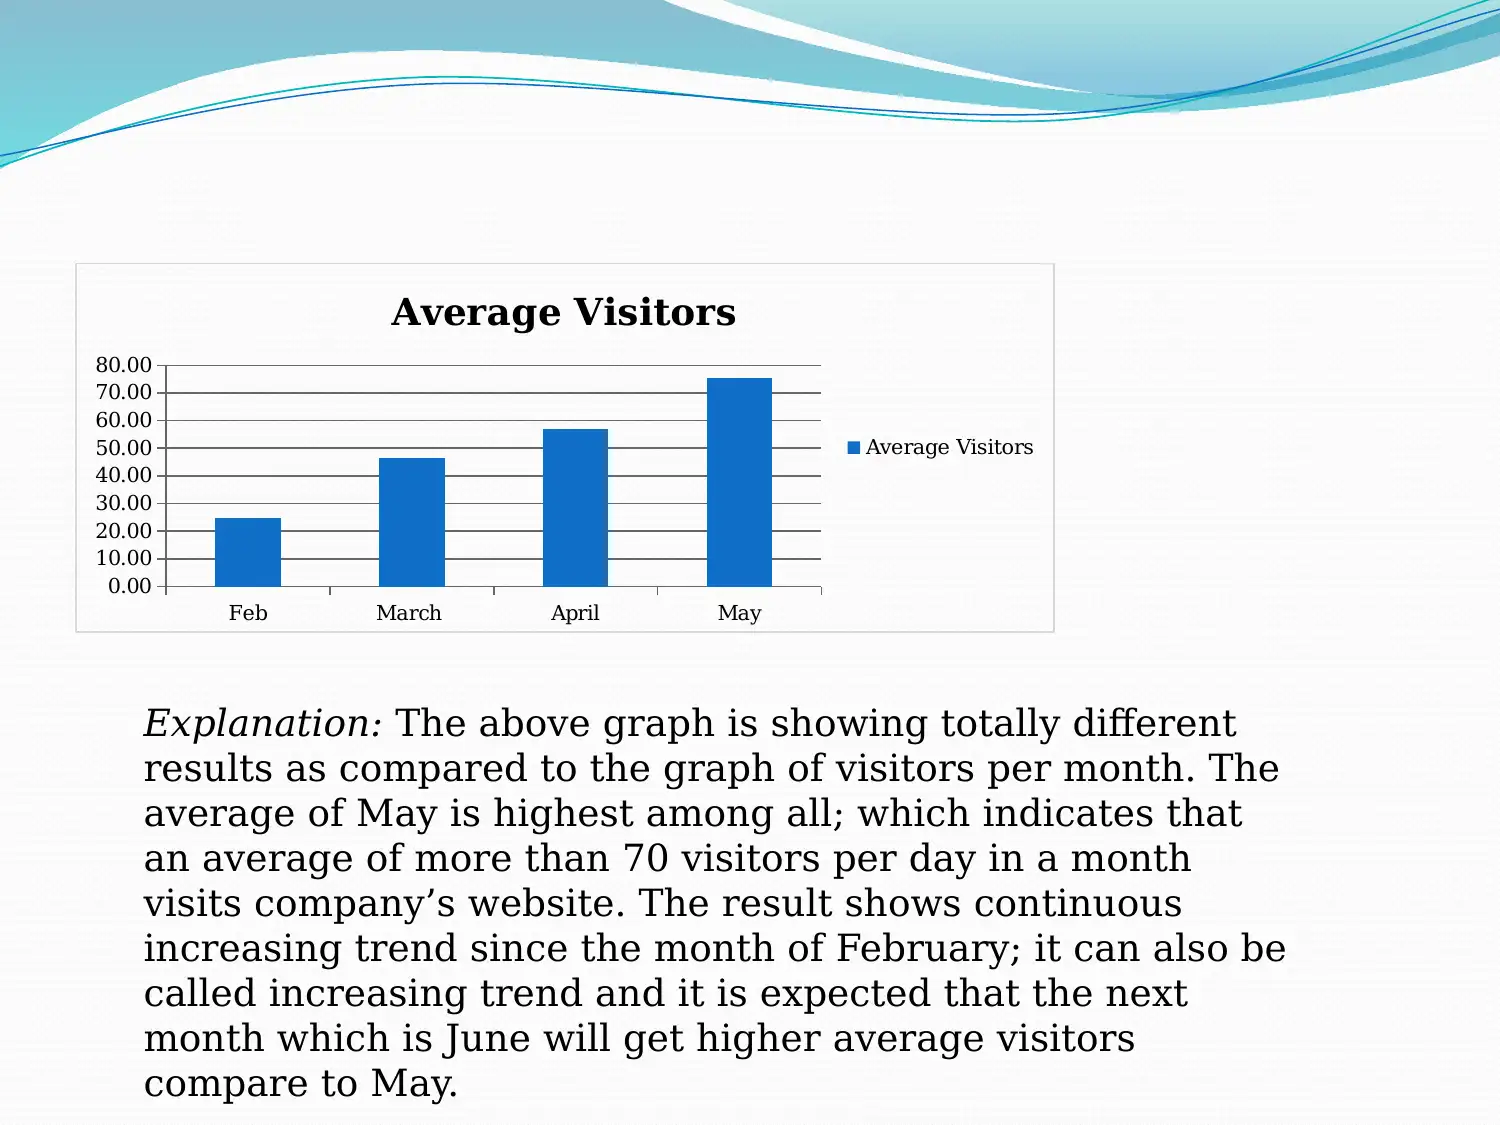
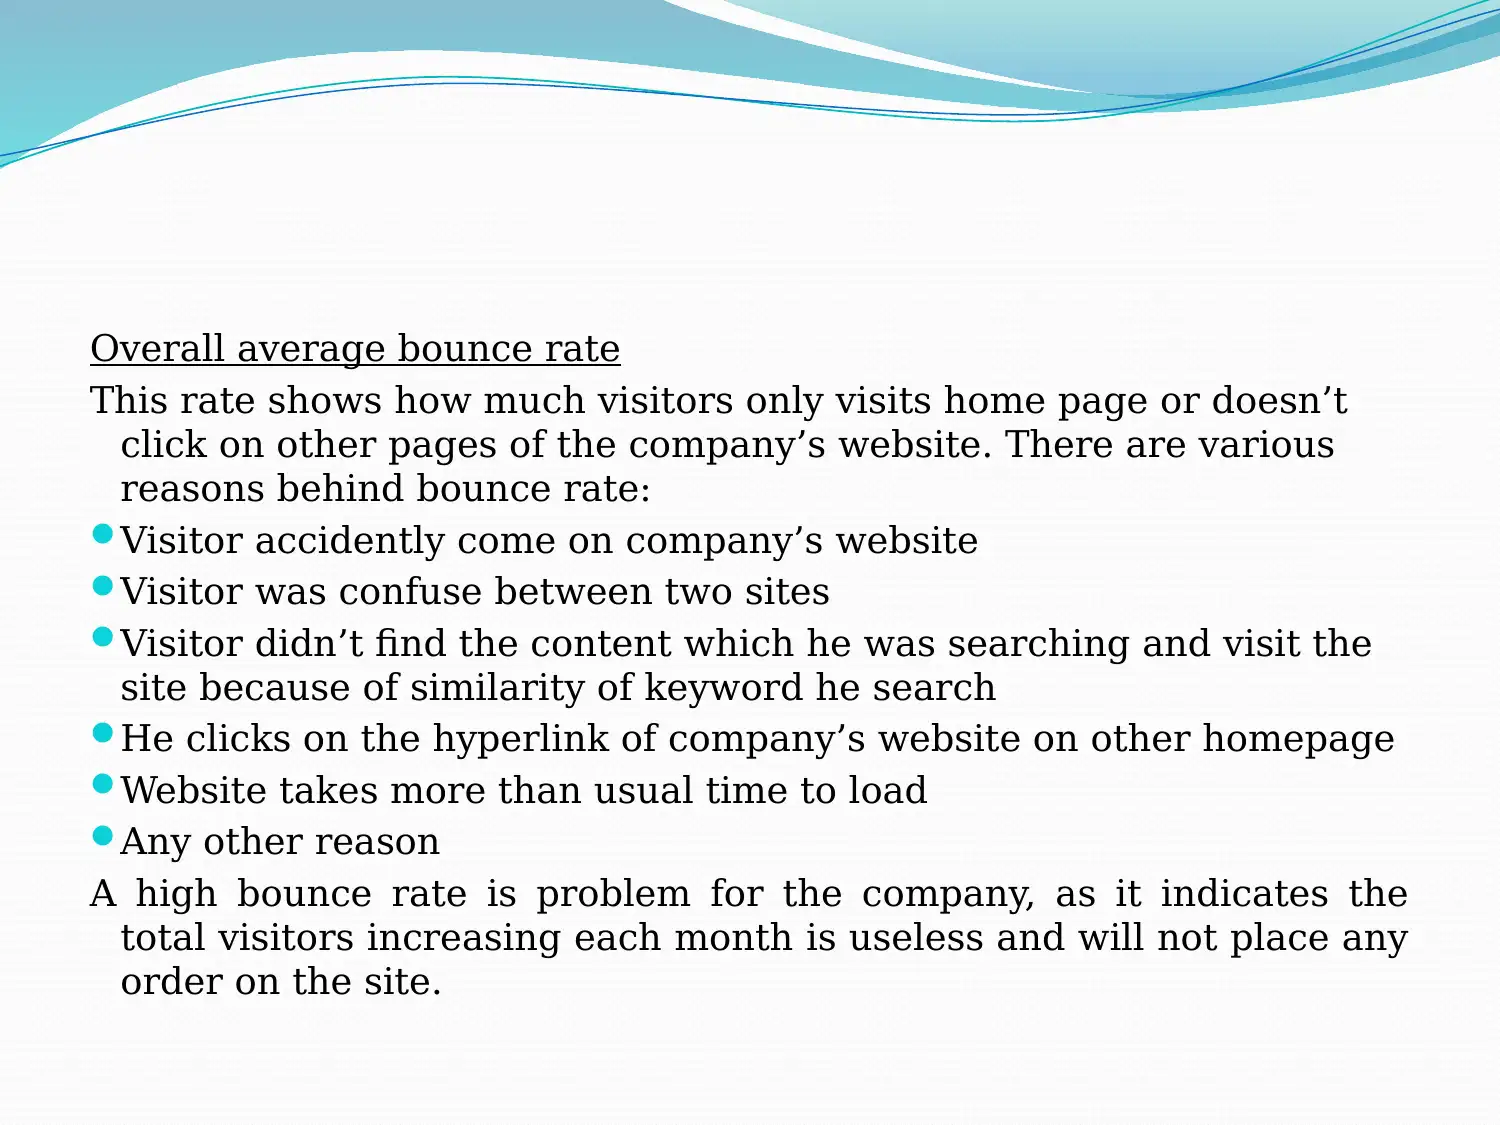
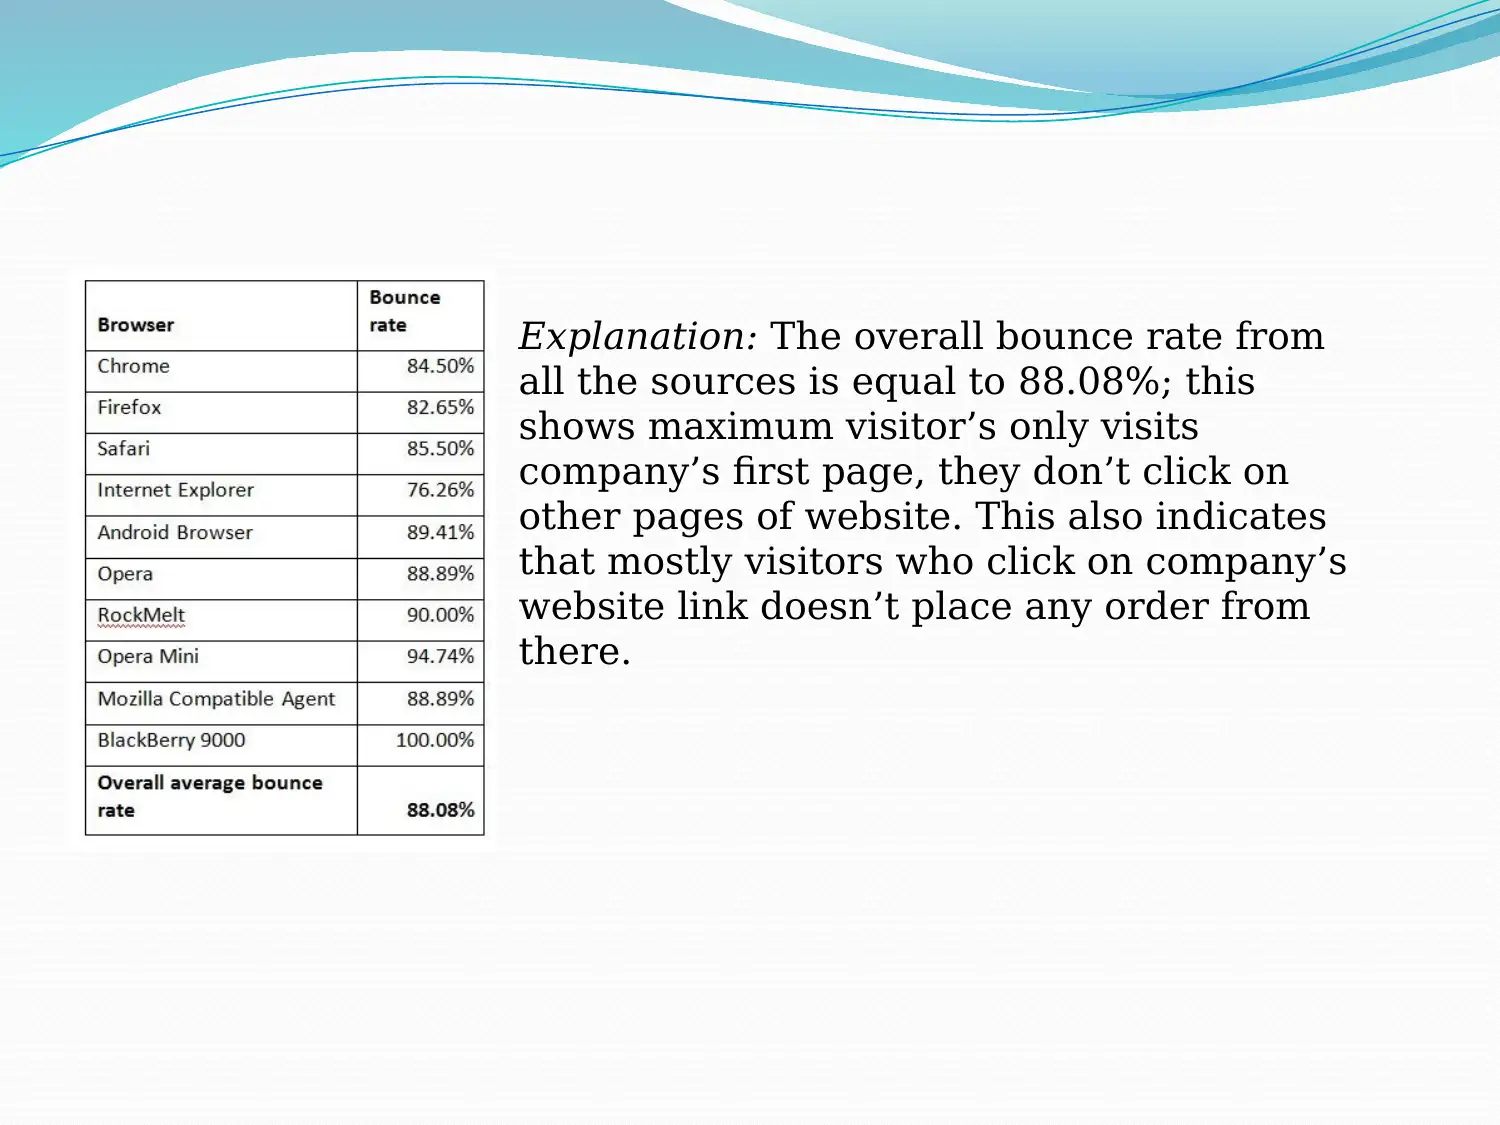
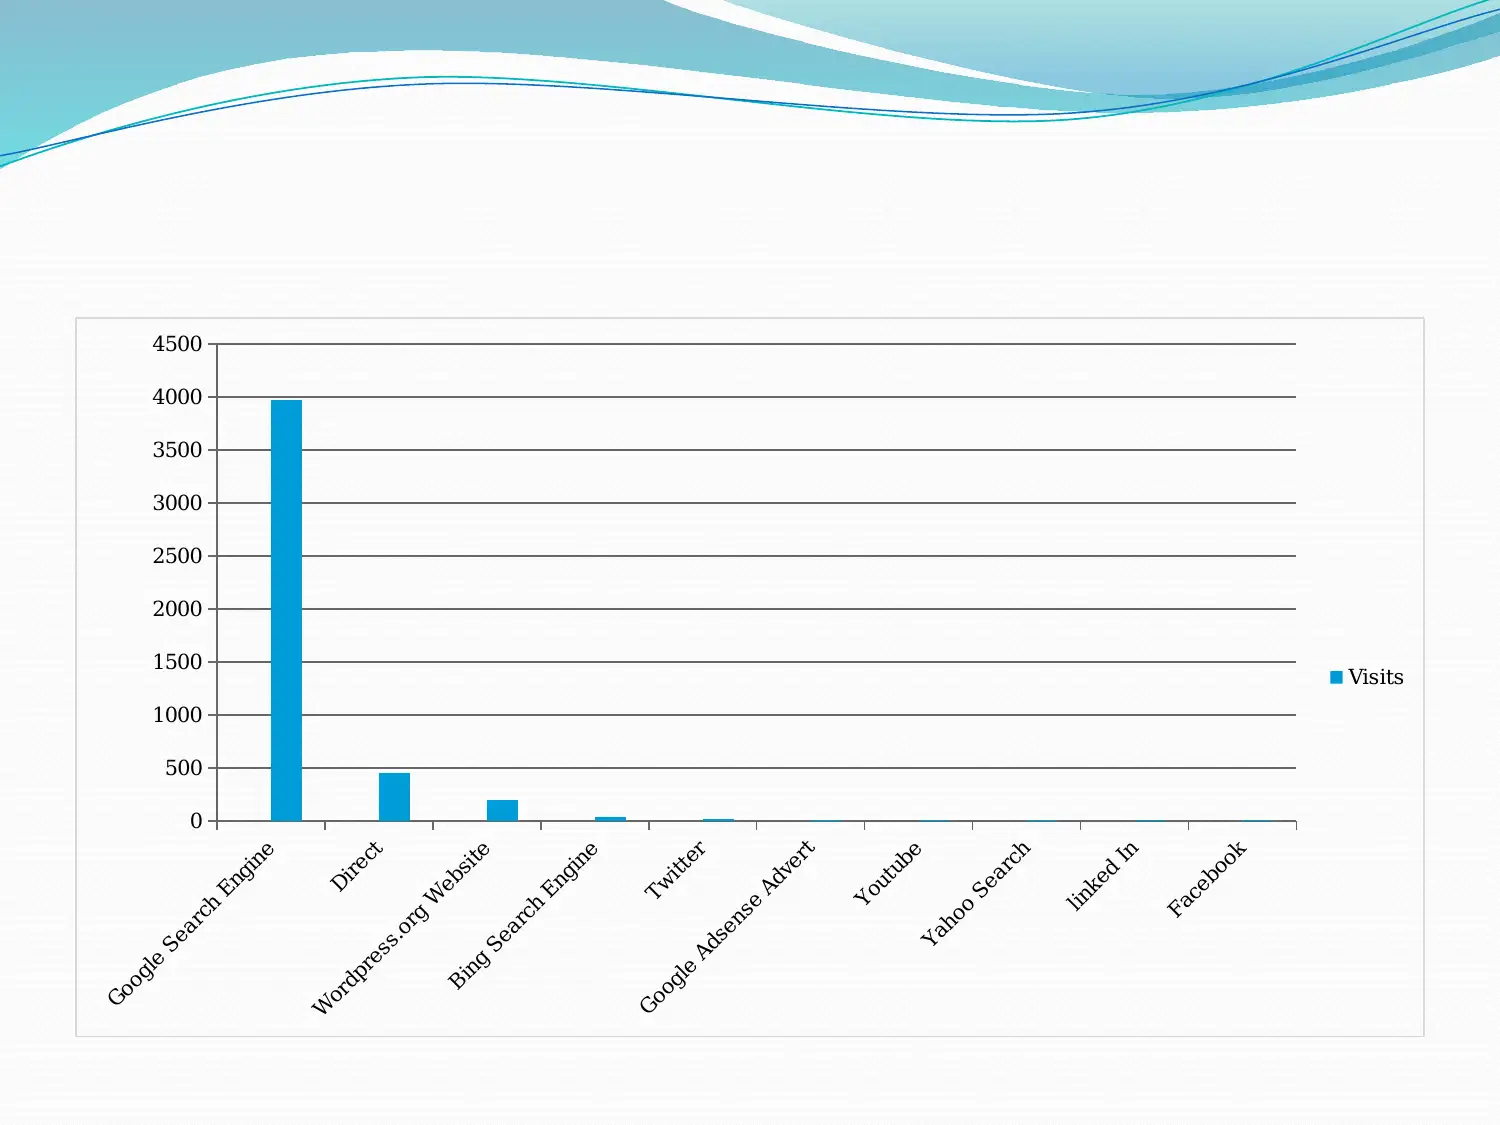
This report presents a data analysis of a company's website traffic, bounce rate, and visitor sources. The analysis reveals trends in monthly visitors, highlighting the highest traffic in April but acknowledging the limited data for May. The report then delves into the mean average number of visitors per month, showing an increasing trend in average daily visitors, with May having the highest average. A significant finding is the high overall bounce rate (88.08%), indicating that most visitors only view the homepage without further engagement. The report examines traffic sources, identifying Google Search as the primary source. The core problem identified is the low conversion of website traffic into sales, likely due to misleading information and a high bounce rate. Recommendations include improving website content, implementing analytical tools, testing site speed, and visualizing top-trending products. The report emphasizes the need to shift focus from simply increasing website visitors to enhancing product promotion and website content to improve conversion rates and overall business performance.
Document Page
Business Data and
Analytics and IT Skills
tabler-icon-diamond-filled.svg

Paraphrase This Document

Need a fresh take? Get an instant paraphrase of this document with our AI Paraphraser
Document Page
Data Analysis
Total number of visitors per month
It is also known as total traffic on website in a
month. Data is given on the basis of per day
visitor which later converted into per month by
taking sum of total visitors during particular
month. These are the visitors who click on the
website link, they either be place order or left
without placing an order. It is not defined
whether these visitors have repeated customers
or unique. Here, visitor is defined as a person
who visits company’s website.
Document Page
Feb March April May
0
200
400
600
800
1000
1200
1400
1600
1800
Visitors
Visitors
Explanation: The above bar graph shows that maximum traffic
noticed is in April month and it is followed by March, where total
visitors exceed 1400 in a month. The month of May can’t be
compared with Feb, March and April because data for May is only
available until 12th May, which is less than half a month. But it is
clear that maximum traffic on company’s website is measured in
the month of April.
Document Page
Mean average number of visitors per month
The main problem in getting data of Visitors
per month above is unequal number of days
in a month. For instance, February has only
28 days while in the month of May, only 12
days data is available. Hence, to get more
detailed information; mean of daily visitors in
a month has been taken to get information on
most likely number of visitors click on
website during a month.
tabler-icon-diamond-filled.svg

Paraphrase This Document

Need a fresh take? Get an instant paraphrase of this document with our AI Paraphraser
Document Page
Feb March April May
0.00
10.00
20.00
30.00
40.00
50.00
60.00
70.00
80.00
Average Visitors
Average Visitors
Explanation: The above graph is showing totally different
results as compared to the graph of visitors per month. The
average of May is highest among all; which indicates that
an average of more than 70 visitors per day in a month
visits company’s website. The result shows continuous
increasing trend since the month of February; it can also be
called increasing trend and it is expected that the next
month which is June will get higher average visitors
compare to May.
Document Page
Overall average bounce rate
This rate shows how much visitors only visits home page or doesn’t
click on other pages of the company’s website. There are various
reasons behind bounce rate:
Visitor accidently come on company’s website
Visitor was confuse between two sites
Visitor didn’t find the content which he was searching and visit the
site because of similarity of keyword he search
He clicks on the hyperlink of company’s website on other homepage
Website takes more than usual time to load
Any other reason
A high bounce rate is problem for the company, as it indicates the
total visitors increasing each month is useless and will not place any
order on the site.
Document Page
Explanation: The overall bounce rate from
all the sources is equal to 88.08%; this
shows maximum visitor’s only visits
company’s first page, they don’t click on
other pages of website. This also indicates
that mostly visitors who click on company’s
website link doesn’t place any order from
there.
tabler-icon-diamond-filled.svg

Paraphrase This Document

Need a fresh take? Get an instant paraphrase of this document with our AI Paraphraser
Document Page
Number of visits by Source
This will show the sources and the number of
visitors who visits from these sources. As
there are many options available with person
who uses internet like google search engine,
directly visit through company’s URL
address, wordpress.org website, bing search
engine, twitter, google adsense, youtube,
yahoo search, linked In and facebook.
Document Page
Google Search Engine
Direct
Wordpress.org Website
Bing Search Engine
Twitter
Google Adsense Advert
Youtube
Yahoo Search
linked In
Facebook
0
500
1000
1500
2000
2500
3000
3500
4000
4500
Visits
Document Page
Findings
After analyzing complete data related to average visitors, bounce
rate and source of traffic; it was found that the main problem
behind non conversion of traffic into sales through placing order
on website is misleading information about the company to
visitors. It could be evidence through high bounce rate. As this
overall high bounce rate proves that most of the visitor’s only
visits webpage due to e-marketing tool not with the intention to
purchase or place order. This is the main reason behind constant
order rate even with increasing of visitors at website. This shows
that traffic comes to company’s website accidently or due to
matching of keywords search by him. Company’s main motive is
to increase the sales revenue by selling products online; not to
increase the visitors at website. So, strategy to increase traffic
has proved to be failure due to divert from main motive of the
company.
tabler-icon-diamond-filled.svg

Paraphrase This Document

Need a fresh take? Get an instant paraphrase of this document with our AI Paraphraser
Document Page
Area for improving the performance of
website
The main problem with providing appropriate
solution to this problem is unclear reason
behind the higher bounce rate. As there are
many reasons which could increase the
bounce rate at particular website.
Document Page
Incomplete or misleading information
If the problem behind high bounce rate is
incomplete information about company’s product
provided through digital marketing employees
through their e-marketing campaign and tools; the
area of improvement could be change the focus
from visiting website to promotion of products.
Improvement of website content
Improvement in content of website includes;
appearance of web page, design of catalogue,
presentation of product information, convenience of
understanding and so on.
chevron_up_icon
1 out of 17
circle_padding
hide_on_mobile
zoom_out_icon
[object Object]