BABS Foundation: Data Analysis and Forecasting Report - Liverpool
VerifiedAdded on 2023/01/16
|9
|1378
|46
Report
AI Summary
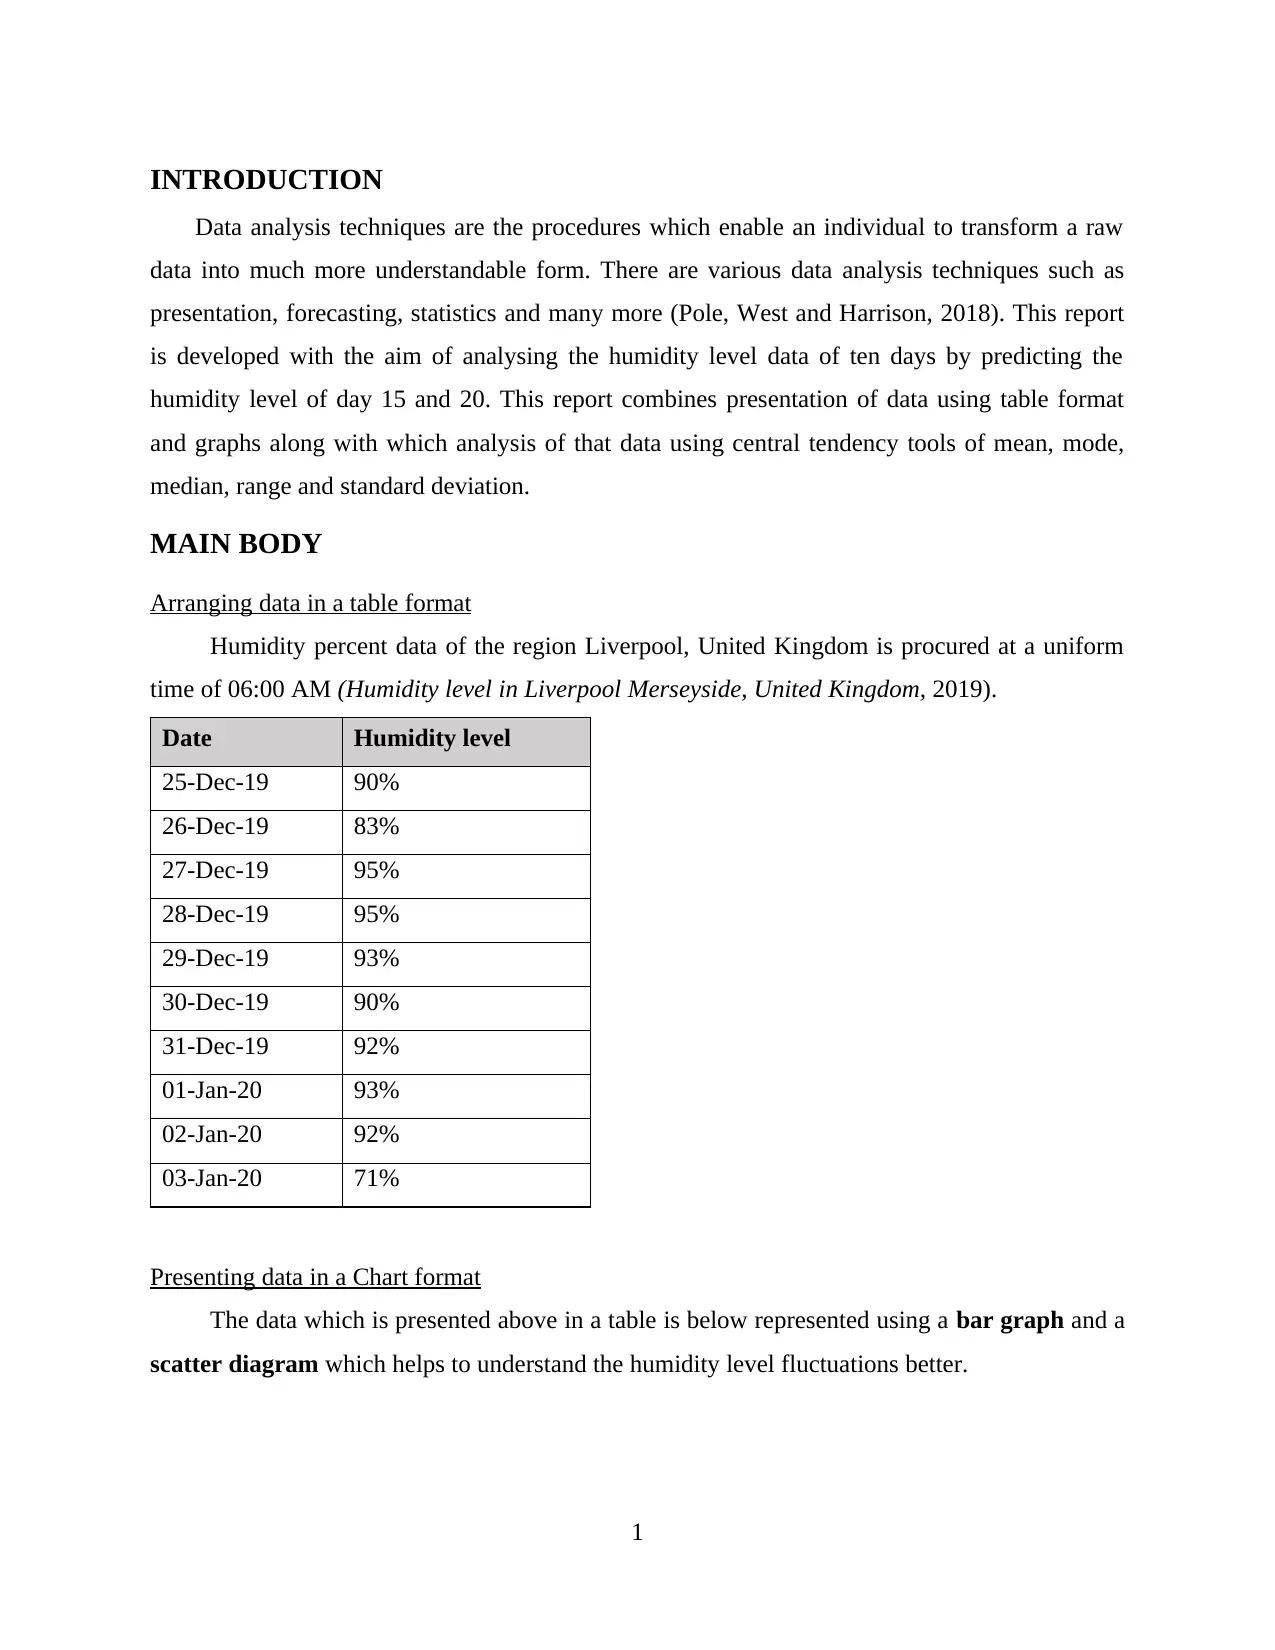
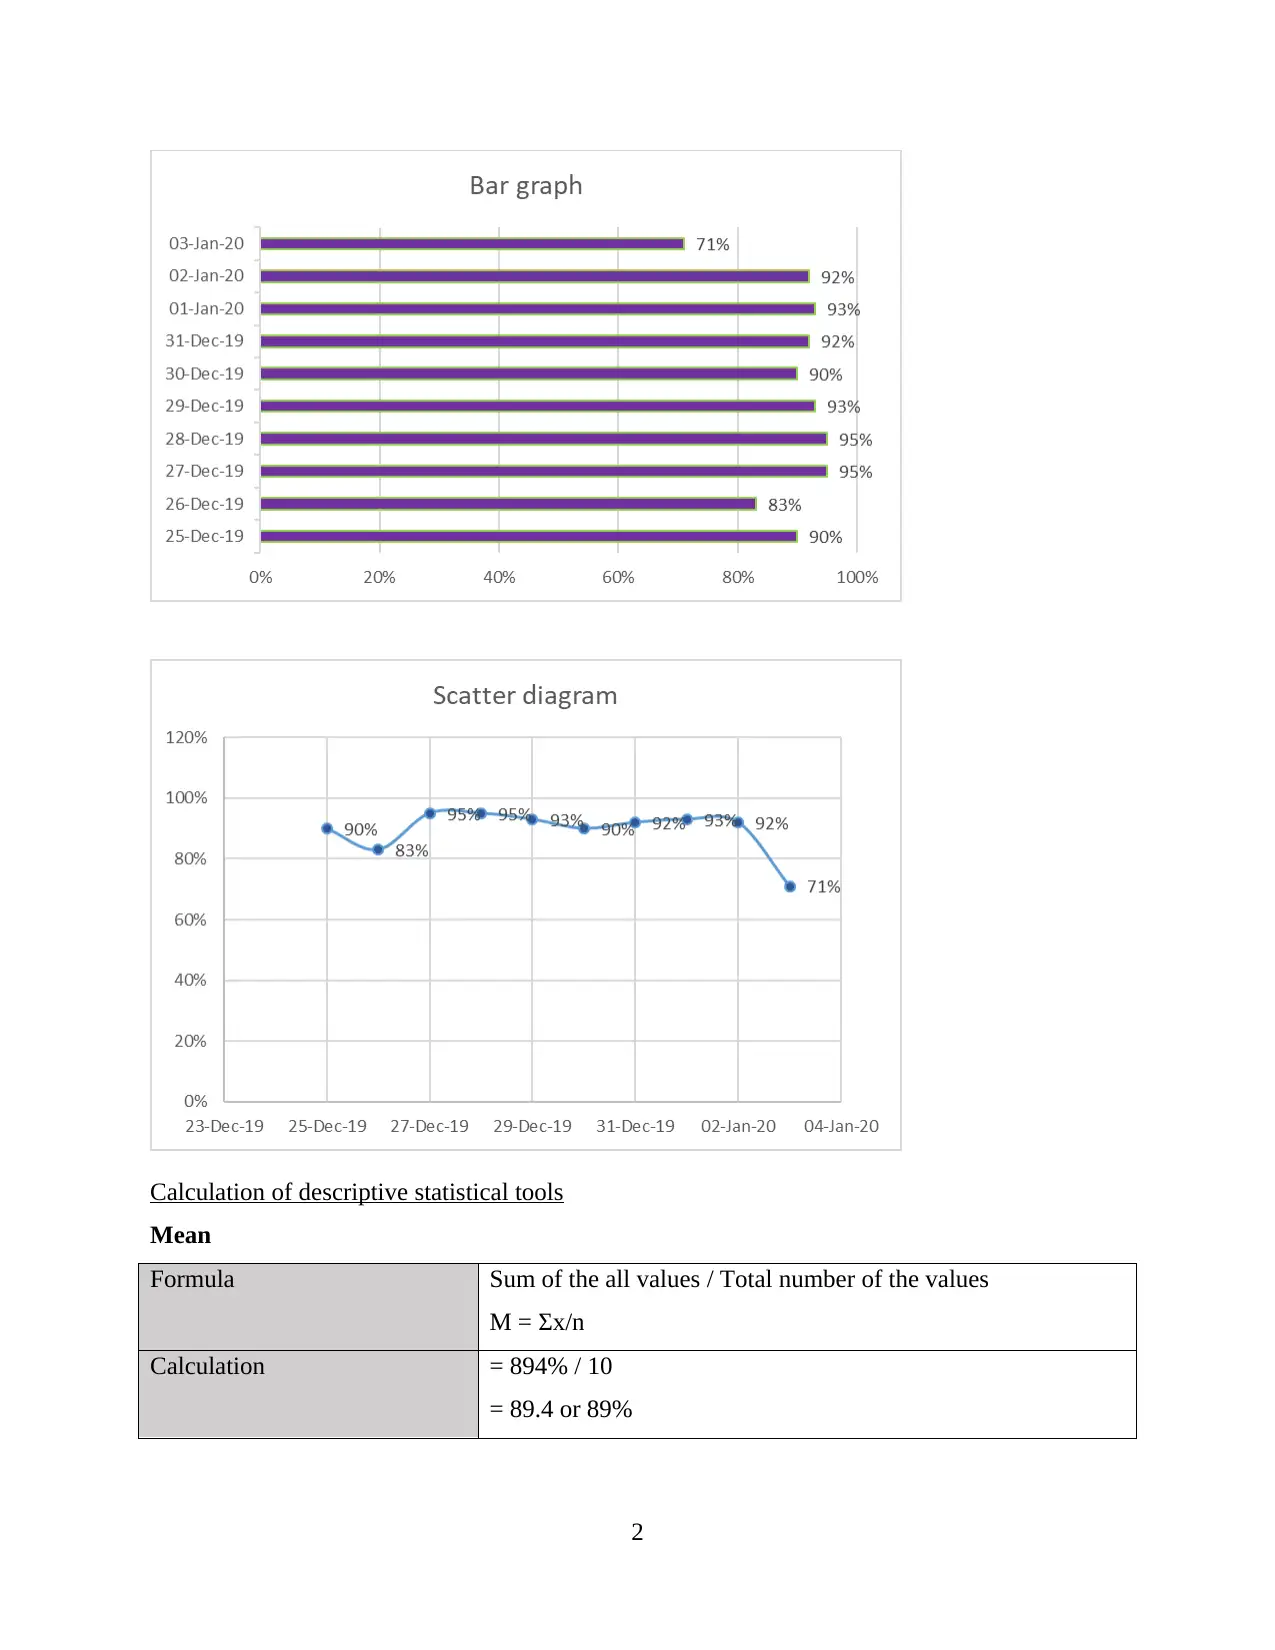
This report presents a comprehensive data analysis of Liverpool's humidity levels over a ten-day period, employing various data analysis techniques to understand humidity patterns and forecast future values. The analysis begins with arranging the humidity data in a table format and presenting it visually through bar graphs and scatter diagrams. Descriptive statistical tools, including mean, median, mode, range, and standard deviation, are calculated to provide insights into the central tendency and dispersion of the data. Furthermore, the report uses the data to forecast humidity levels for the 15th and 20th days, employing linear regression techniques. The findings reveal the average humidity level, the most frequent humidity values, and the dispersion of humidity levels. The report concludes that forecasting is essential in data analysis as it provides a better understanding of the data and helps predict future values, and highlights the effective use of statistical and Microsoft Excel tools for data presentation and transformation.

DATA ANALYSIS
TECHNIQUES
TECHNIQUES
Paraphrase This Document
Need a fresh take? Get an instant paraphrase of this document with our AI Paraphraser

Contents
INTRODUCTION...........................................................................................................................1
MAIN BODY..................................................................................................................................1
Arranging data in a table format..................................................................................................1
Presenting data in a Chart format................................................................................................1
Calculation of descriptive statistical tools...................................................................................2
Calculation of humidity level for day 15 and day 20..................................................................4
CONCLUSION................................................................................................................................6
REFERENCES................................................................................................................................7

INTRODUCTION
Data analysis techniques are the procedures which enable an individual to transform a raw
data into much more understandable form. There are various data analysis techniques such as
presentation, forecasting, statistics and many more (Pole, West and Harrison, 2018). This report
is developed with the aim of analysing the humidity level data of ten days by predicting the
humidity level of day 15 and 20. This report combines presentation of data using table format
and graphs along with which analysis of that data using central tendency tools of mean, mode,
median, range and standard deviation.
MAIN BODY
Arranging data in a table format
Humidity percent data of the region Liverpool, United Kingdom is procured at a uniform
time of 06:00 AM (Humidity level in Liverpool Merseyside, United Kingdom, 2019).
Date Humidity level
25-Dec-19 90%
26-Dec-19 83%
27-Dec-19 95%
28-Dec-19 95%
29-Dec-19 93%
30-Dec-19 90%
31-Dec-19 92%
01-Jan-20 93%
02-Jan-20 92%
03-Jan-20 71%
Presenting data in a Chart format
The data which is presented above in a table is below represented using a bar graph and a
scatter diagram which helps to understand the humidity level fluctuations better.
1
⊘ This is a preview!⊘
Do you want full access?
Subscribe today to unlock all pages.

Trusted by 1+ million students worldwide

Calculation of descriptive statistical tools
Mean
Formula Sum of the all values / Total number of the values
M = Σx/n
Calculation = 894% / 10
= 89.4 or 89%
2
Mean
Formula Sum of the all values / Total number of the values
M = Σx/n
Calculation = 894% / 10
= 89.4 or 89%
2
Paraphrase This Document
Need a fresh take? Get an instant paraphrase of this document with our AI Paraphraser

Mean is the average value of the frequencies present in a data set. In the present case,
Mean is calculated by totalling the values of humidity level i.e., 894% and then dividing it with
total number of days i.e., 10. The determined mean of 89% shows that the average humidity level
of the region of Liverpool is 89% which is considerably high, interpreting Liverpool to be a
humid region.
Median
Formula (n + 1)/2th position
Calculation = (10+1) / 2
= 5.5th position
= 92%
Median refers to the middle point frequency of a data set which categorizes the whole set
into two equal categories (Afshar and Bigdeli, 2011). In the present case, all the frequencies are
first cleansed by converting them in an ascending order. After which the frequency of 5.5th or 6th
position is considered as a median that is 92%.
Mode
Mode is usually the most repeated frequency value in a data set. This measure helps to
understand the humid level which is most experienced in the region of Liverpool (Bisgaard and
Kulahci, 2011). By observing the data set, it has been seen that 90% humid level is recurring two
times, hence considered as mode.
Range
Formula Maximum band value – Minimum band value
Calculation 95% - 71%
= 24%
Range is the difference between maximum and minimum frequency value which shows
the range by which humid level of Liverpool is dispersed. The maximum humid level Liverpool
experienced from 25 December 2019 to 3 January 2020 is 95% and 71% to be the minimum.
These values have a difference of 24% which is the range of this data set.
Standard deviation
Formula Standard Deviations = √ (variance)
Variance 2 = {∑ (x – mean) / N}2
= {∑ (x2 / N – (mean)2}
3

Calculation = {804% / 10 – (89%) 2}
= {80.4% – 80%}
= 0.4
Std. Dev. = √ 0.4
Standard deviation = 0.63
Standard deviation is the dispersion by which frequencies of the data set disperse from its
average mean. In the present case, the measure is calculated as 0.63 which implies that the
dispersion rate of humid level in Liverpool is low and the fluctuations in humidity in this region
is lower.
Calculation of humidity level for day 15 and day 20
Calculation of m value
Date Day
(X)
Humidity
data (%) (Y) XY X^2
25-Dec-19 1 90% 90% 1
26-Dec-19 2 83% 166% 4
27-Dec-19 3 95% 285% 9
28-Dec-19 4 95% 380% 16
29-Dec-19 5 93% 465% 25
30-Dec-19 6 90% 540% 36
31-Dec-19 7 92% 644% 49
01-Jan-20 8 93% 744% 64
02-Jan-20 9 92% 828% 81
03-Jan-20 10 71% 710% 100
Total 55 894% 4852% 385
Particulars Details
m NΣxy – Σx Σy / NΣ x ^ 2 – (Σx) ^ 2
(10 * 4852) - (55 * 894) / (10 * 385) -
(55) ^ 2
(48520 - 49170) / (3850 - 3025)
4
⊘ This is a preview!⊘
Do you want full access?
Subscribe today to unlock all pages.

Trusted by 1+ million students worldwide

-0.78
The “m” variable is the sum combination of days and humidity level which acts as a base
to predict future humidity level. In the present case of Liverpool, the equation of “y = mx + c” is
used by which the value of m is computed as -0.78.
Calculation of c value
Particulars Details
c Σy - m Σx / N
(894 - ( - 0.78 * 55)) / 10
93.69
The variable “c” is the predictive date by which the future humid level can increase or
decrease (Croushore, 2011). This variable in the case of Liverpool is determined as 93.69.
Forecasting humidity level for 15th and 20th day
Forecast of 15th day
y = mx + c
y -0.78 (x) + 93.69
x 15
y 0.78 (15) + 93.69
81.99
Humidity level of ten consecutive days for the region of Liverpool is considered in this
data analysis. Using these known frequency levels, the humidity for day 15th is determined as
81.99 or 82%.
Forecast of 20th day
y = mx + c
y -0.78 (x) + 93.69
x 20
y -0.78 (20) + 93.69
78.09
The humidity level for the 20th day is calculated as 78.09 or 78%. This disperse humid
level shows that there are high chances of experiencing fluctuations in the future.
5
Paraphrase This Document
Need a fresh take? Get an instant paraphrase of this document with our AI Paraphraser

CONCLUSION
From the above report, it has been concluded that the procedure of forecasting is essential in
study of data analysis as it does not only help in presenting the data in much more
understandable form but also help in predicting the future values of that data set. It is observed
and found from above analysis report that effective usage of statistical and Microsoft Excel tool,
the raw data cannot only be effectively presented but can also be transformed.
6

REFERENCES
Books and Journals
Afshar, K. and Bigdeli, N., 2011. Data analysis and short term load forecasting in Iran electricity
market using singular spectral analysis (SSA). Energy. 36(5). pp.2620-2627.
Bisgaard, S. and Kulahci, M., 2011. Time series analysis and forecasting by example. John
Wiley & Sons.
Croushore, D., 2011. Frontiers of real-time data analysis. Journal of economic literature. 49(1).
pp.72-100.
Pole, A., West, M. and Harrison, J., 2018. Applied Bayesian forecasting and time series analysis.
Chapman and Hall/CRC.
Online
Humidity level in Liverpool Merseyside, United Kingdom. 2019. [Online]. Available through:
<https://www.worldweatheronline.com/liverpool-weather-history/merseyside/gb.aspx>
7
⊘ This is a preview!⊘
Do you want full access?
Subscribe today to unlock all pages.

Trusted by 1+ million students worldwide
1 out of 9
Related Documents
Your All-in-One AI-Powered Toolkit for Academic Success.
+13062052269
info@desklib.com
Available 24*7 on WhatsApp / Email
Unlock your academic potential
Copyright © 2020–2025 A2Z Services. All Rights Reserved. Developed and managed by ZUCOL.


