Data Analysis and Information Management: A Comprehensive Report

Verified

Added on  2022/12/17

|11
|670
|91
Homework Assignment
AI Summary
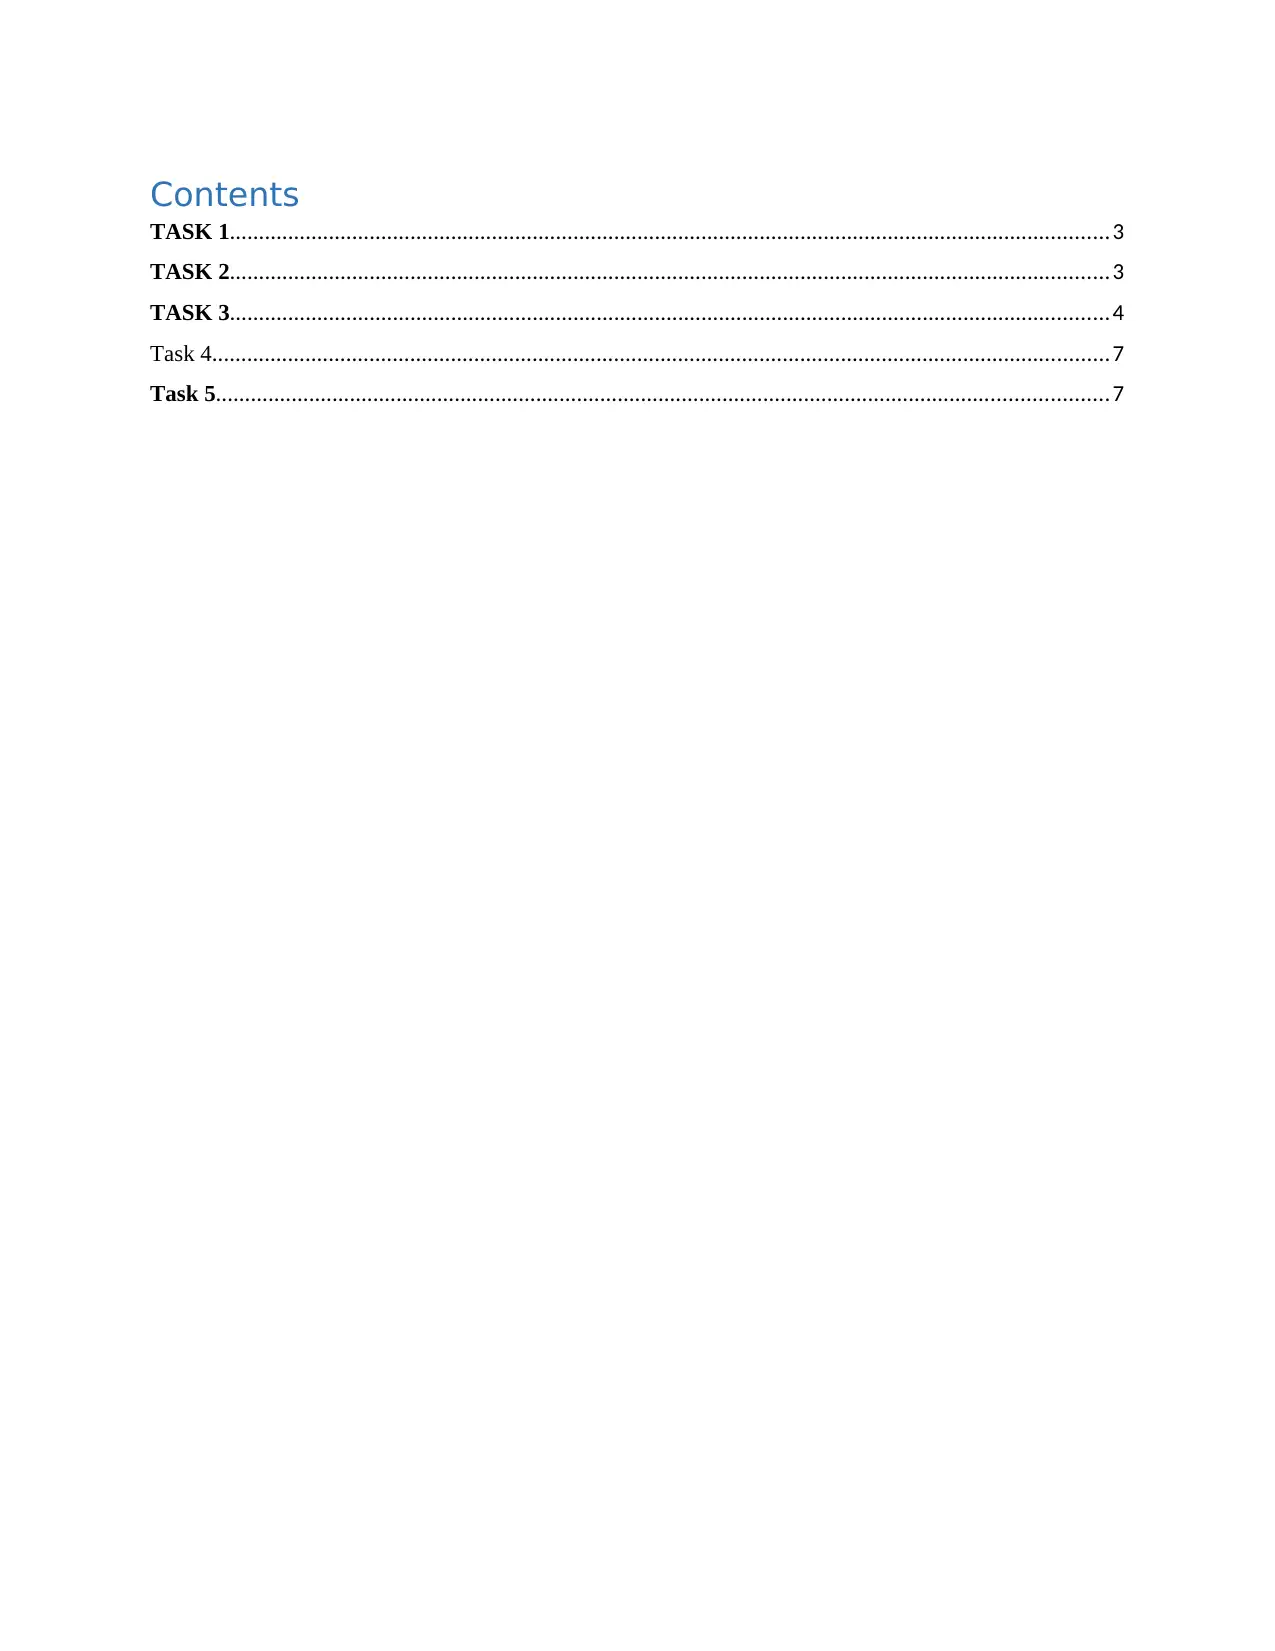
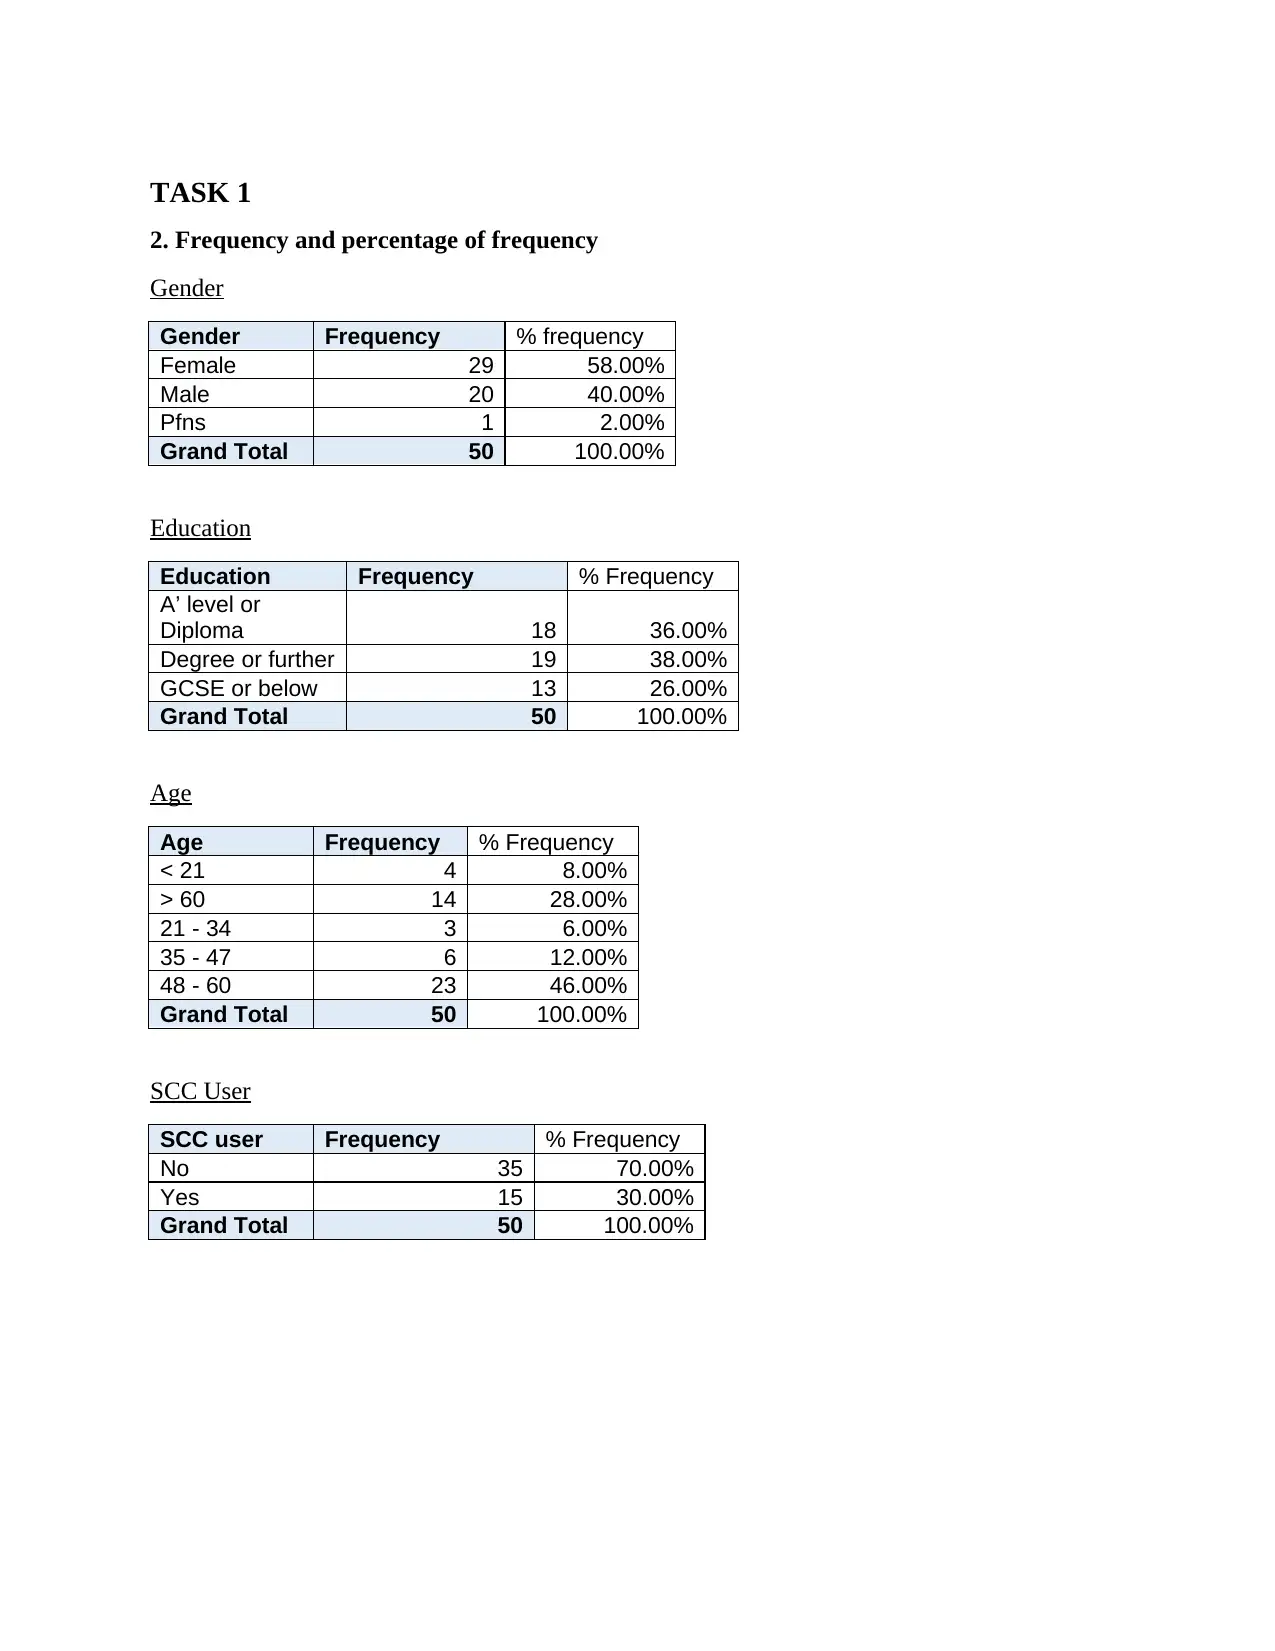
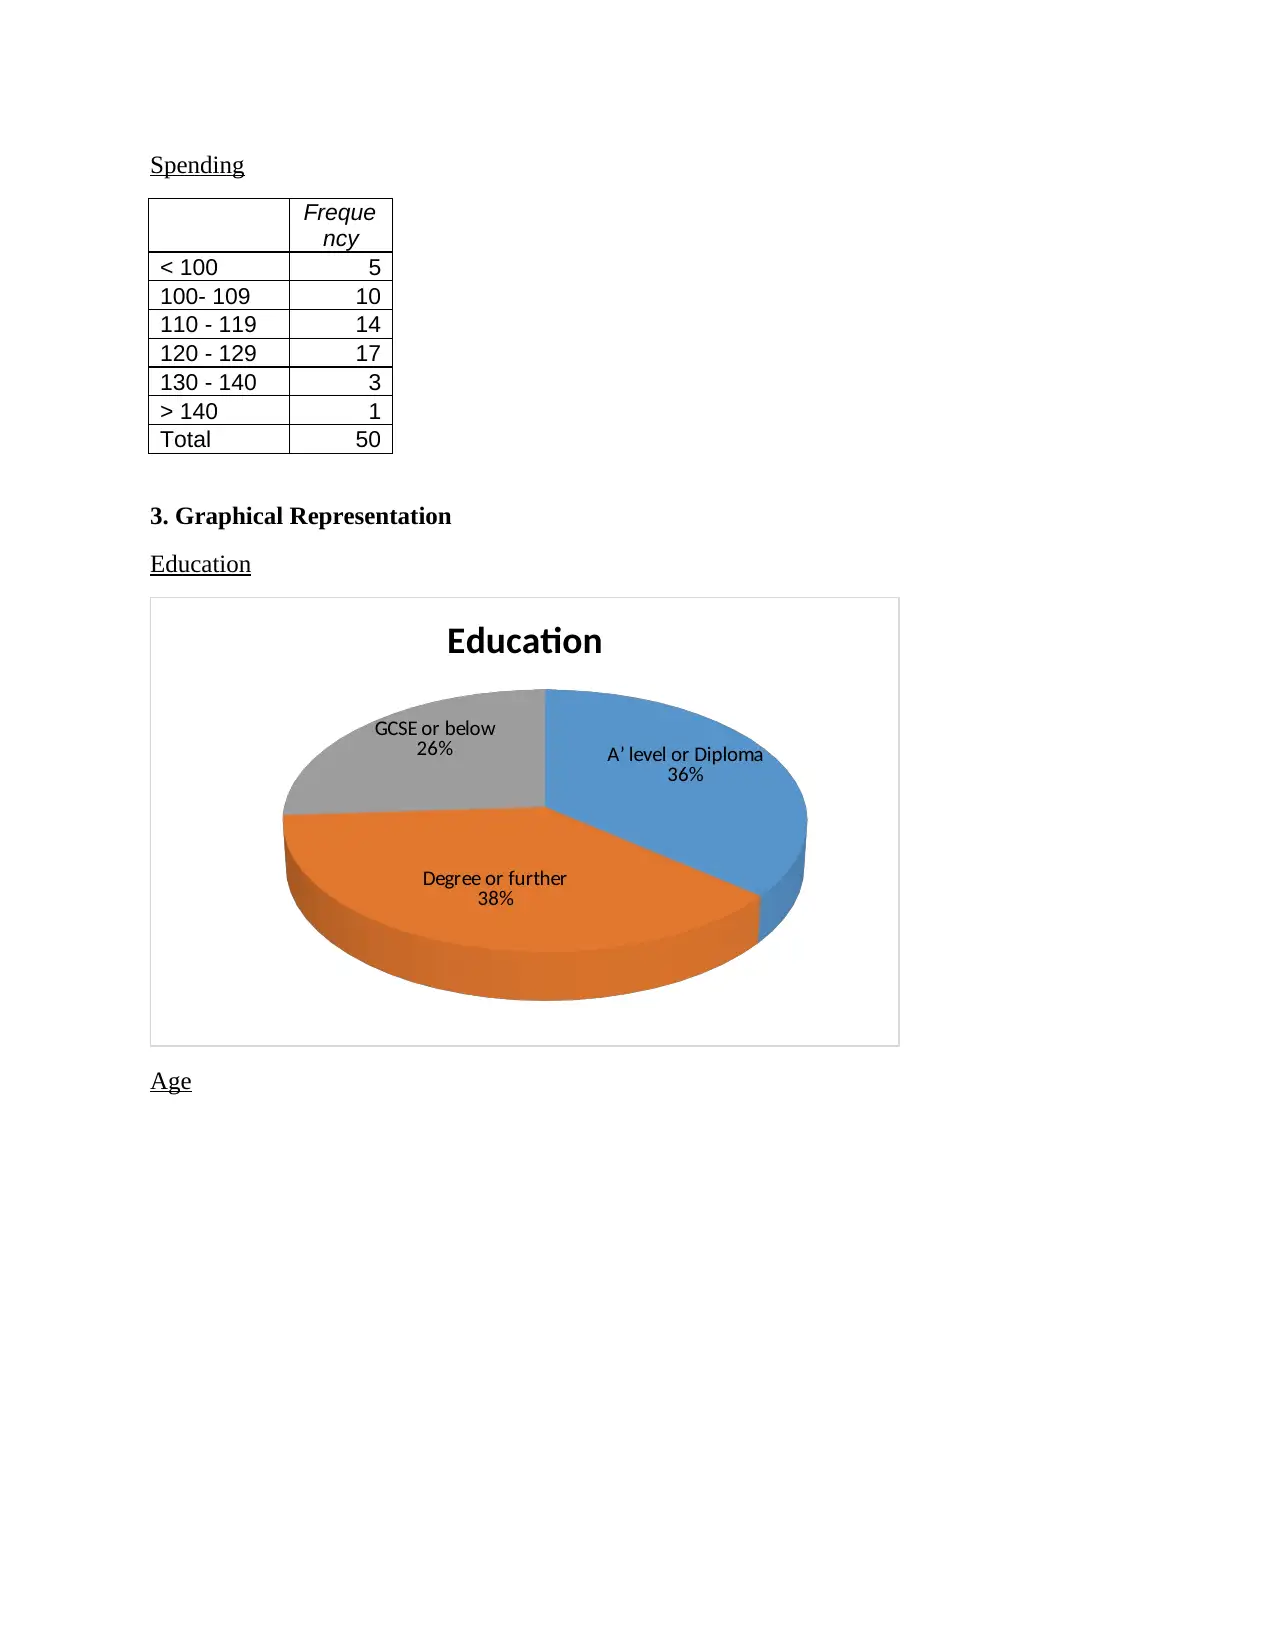
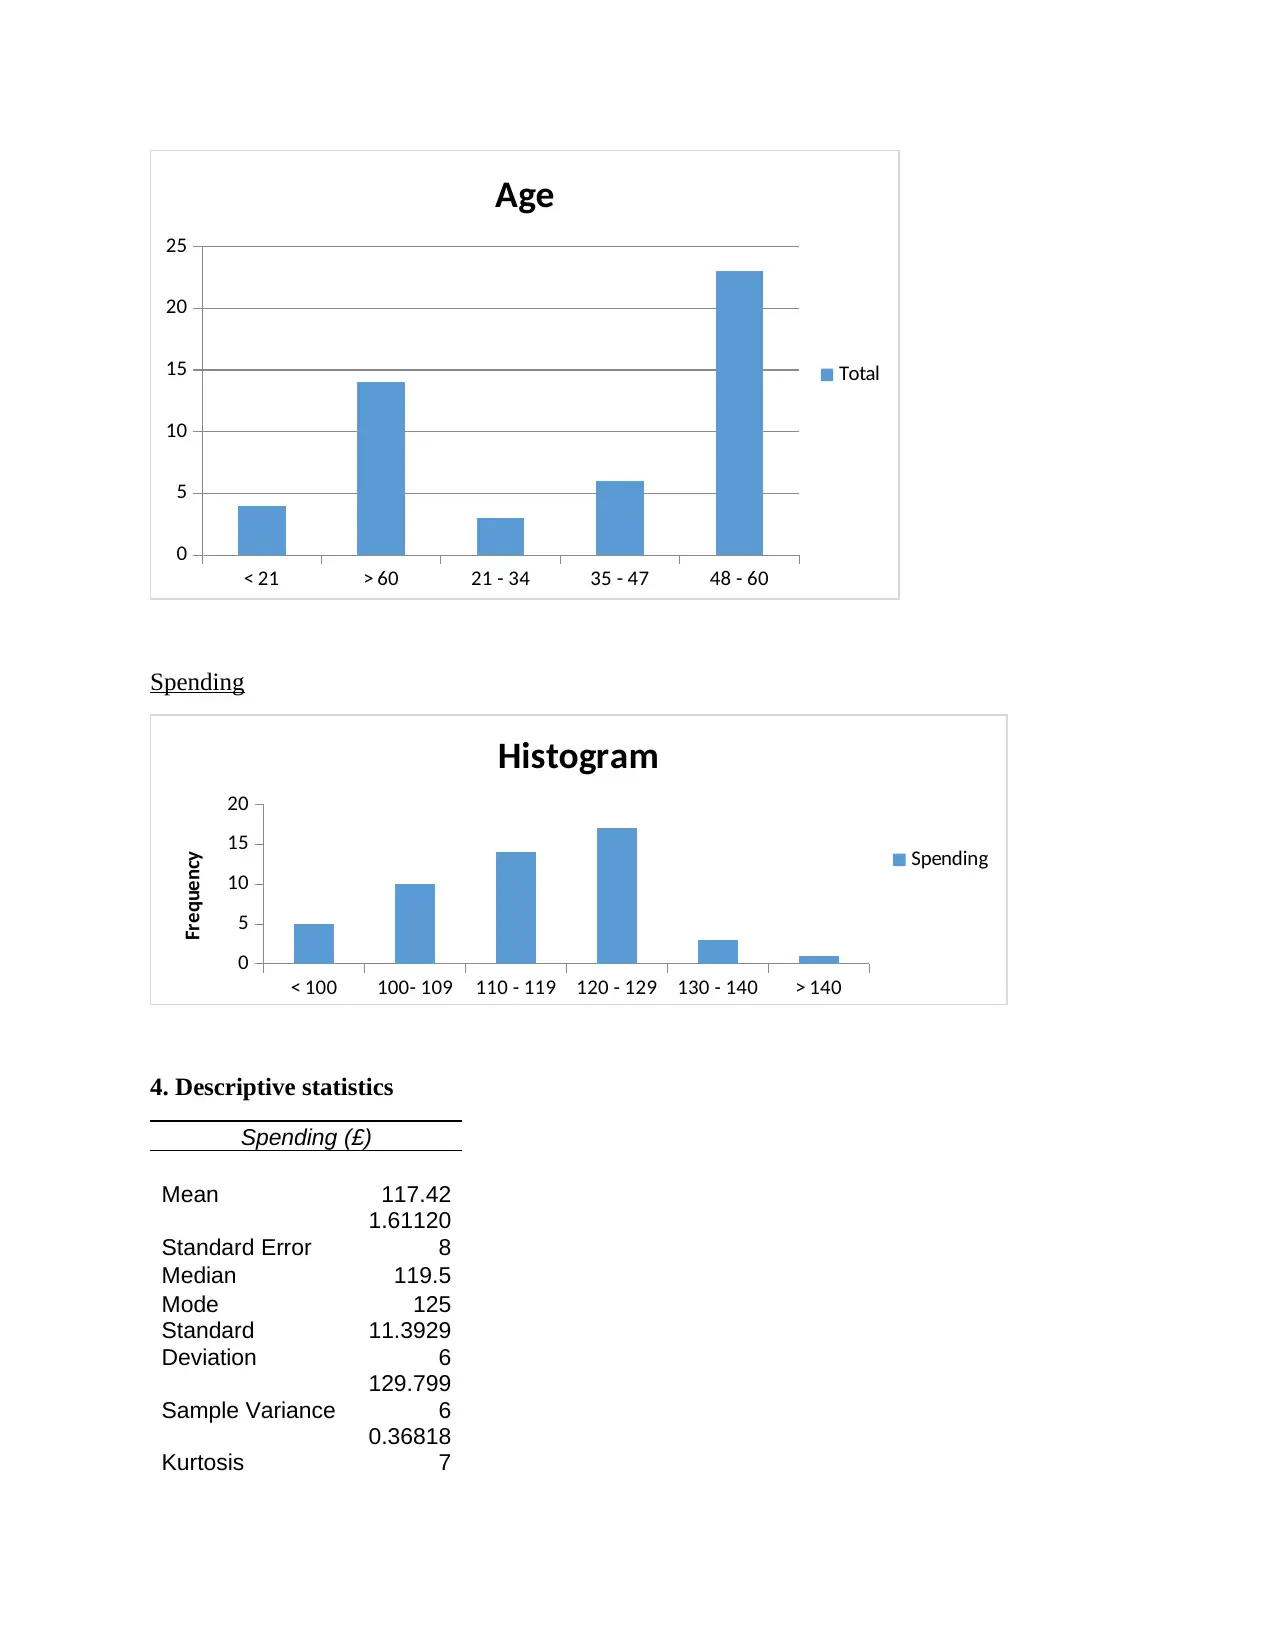
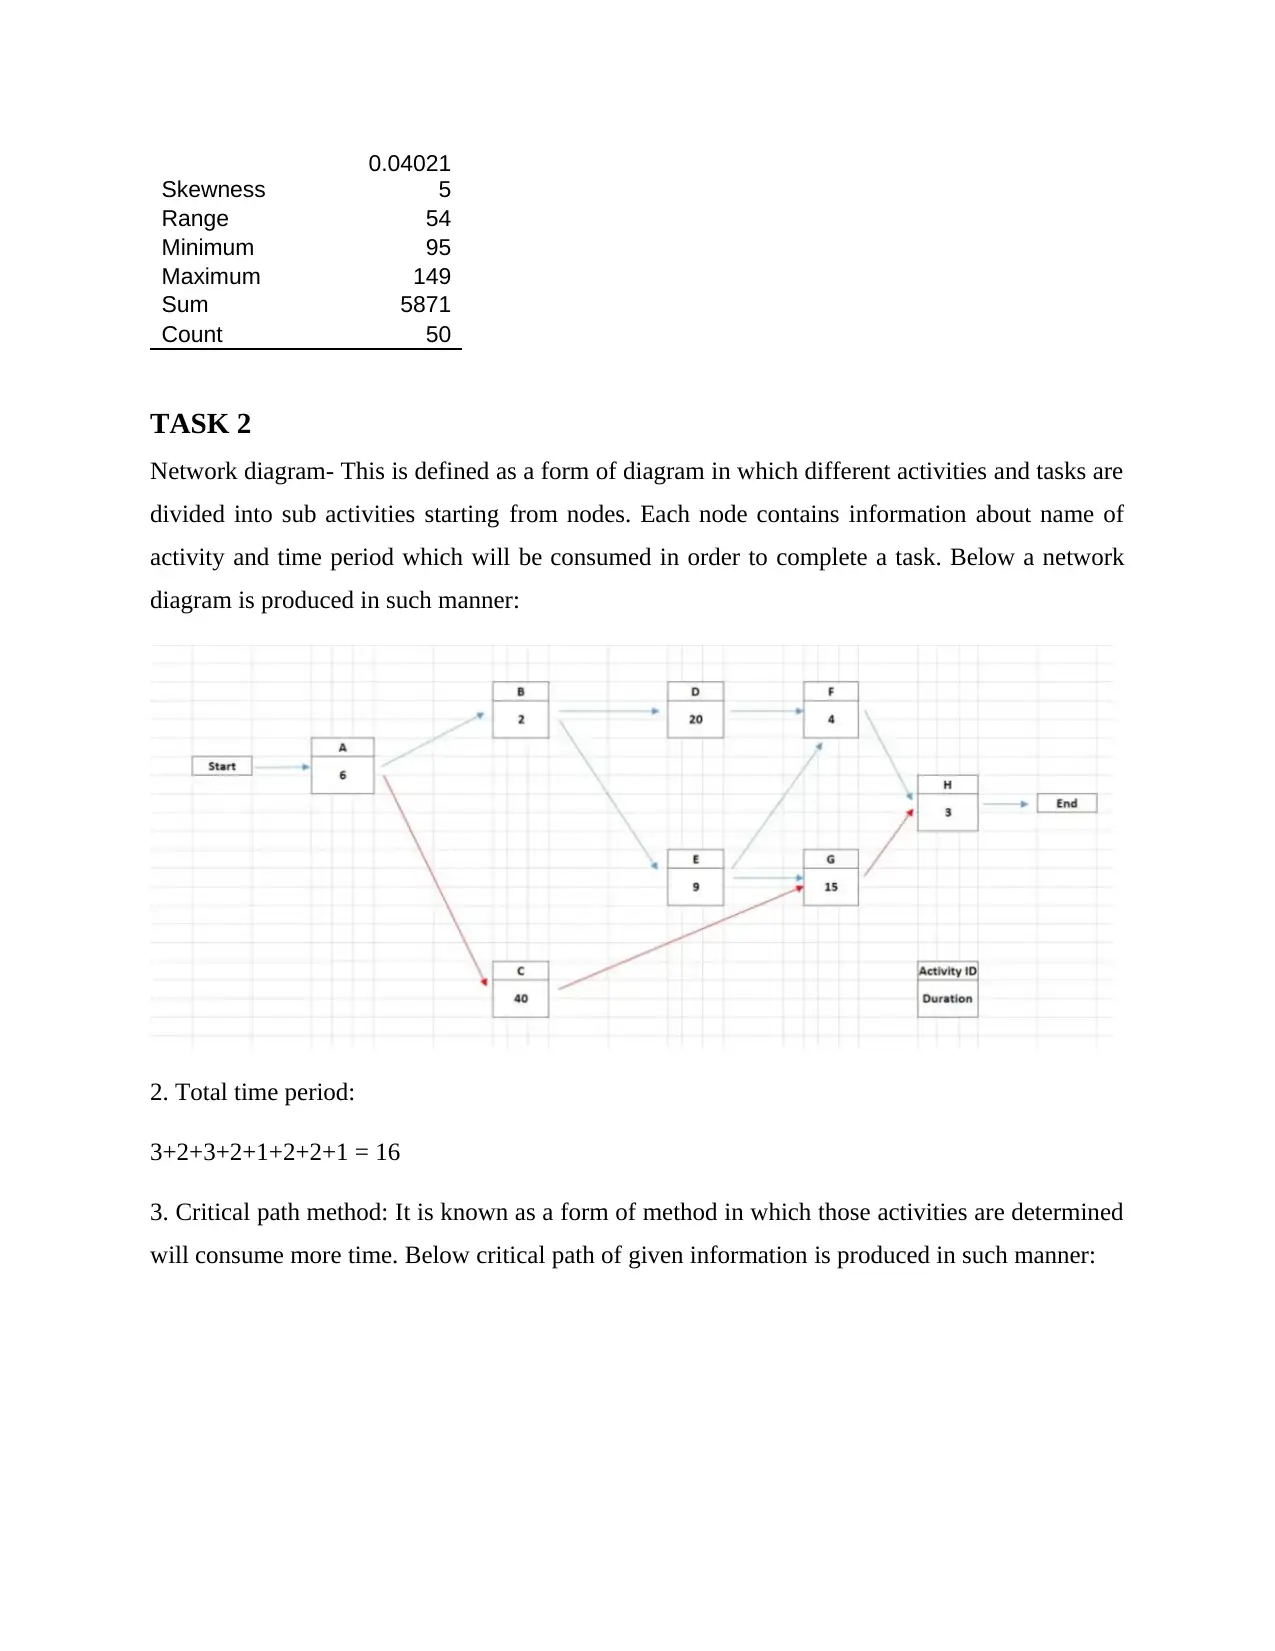
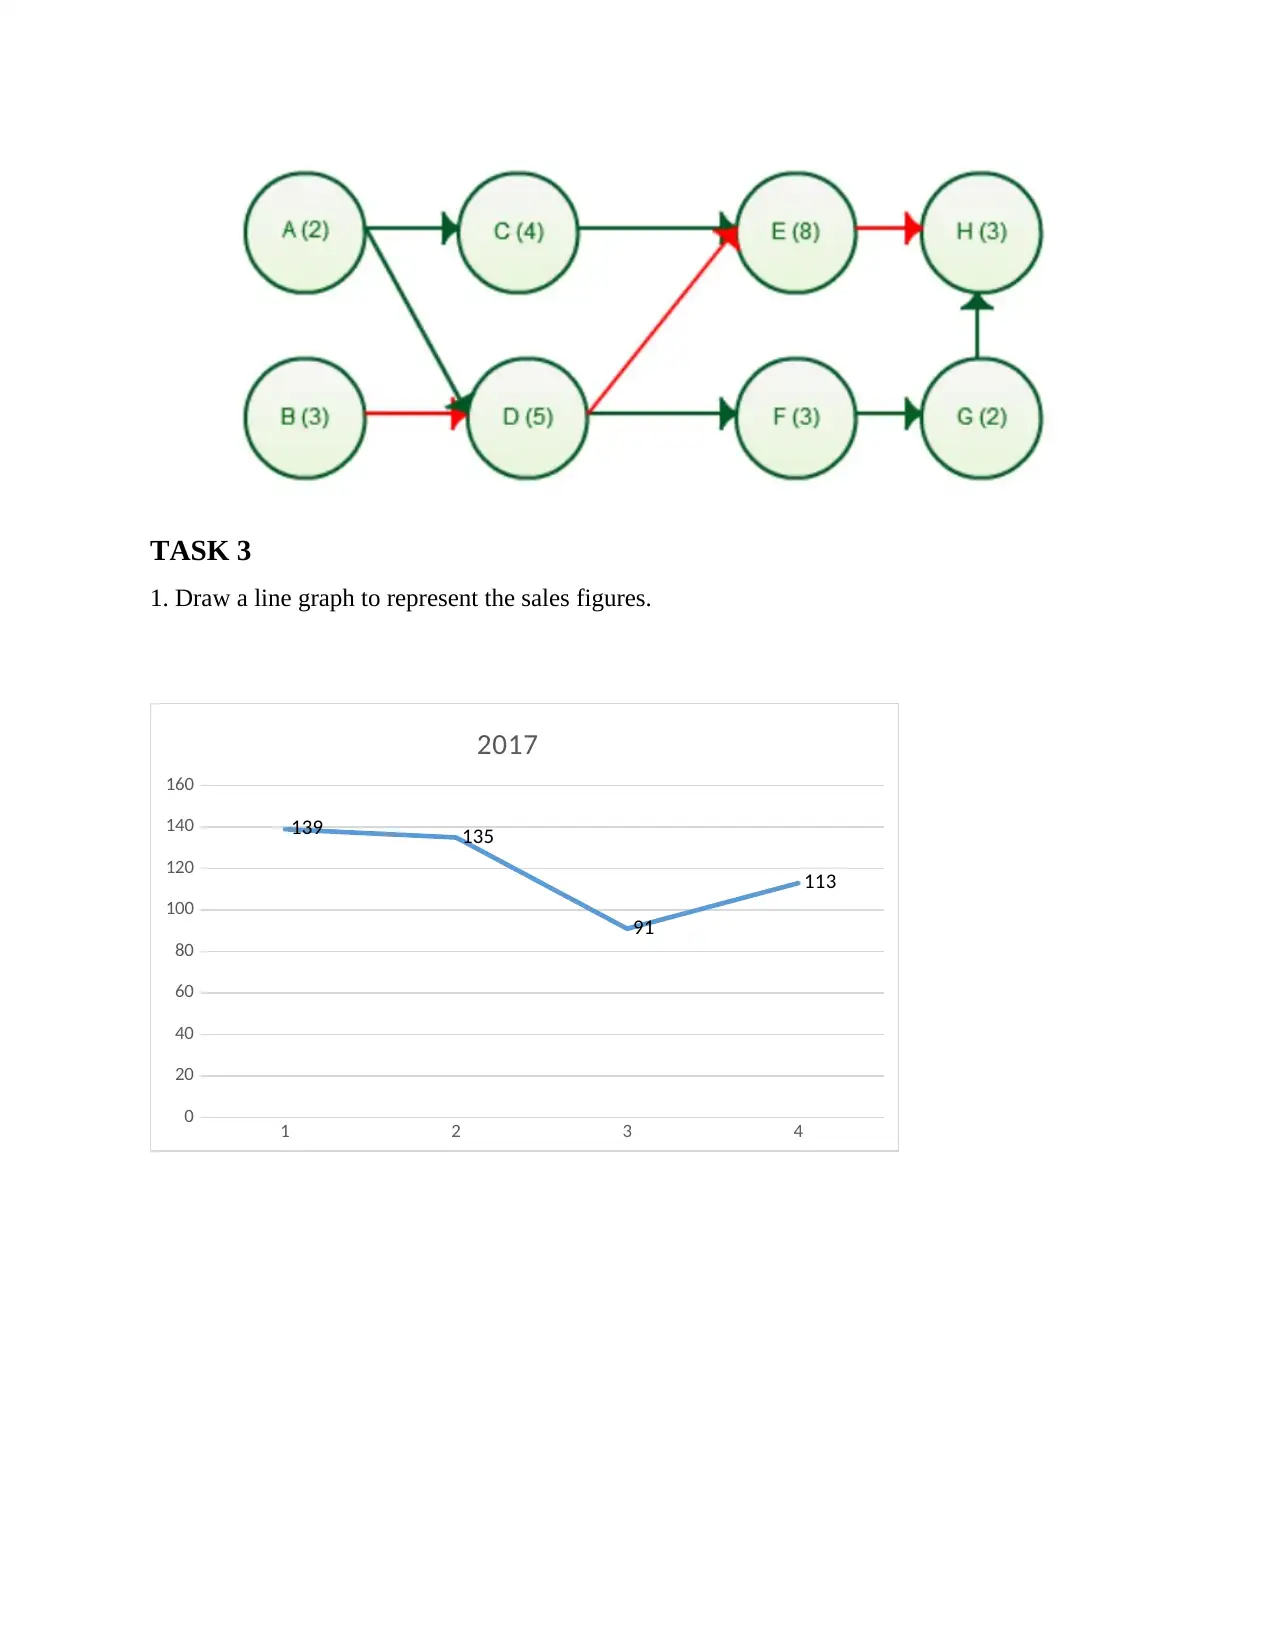
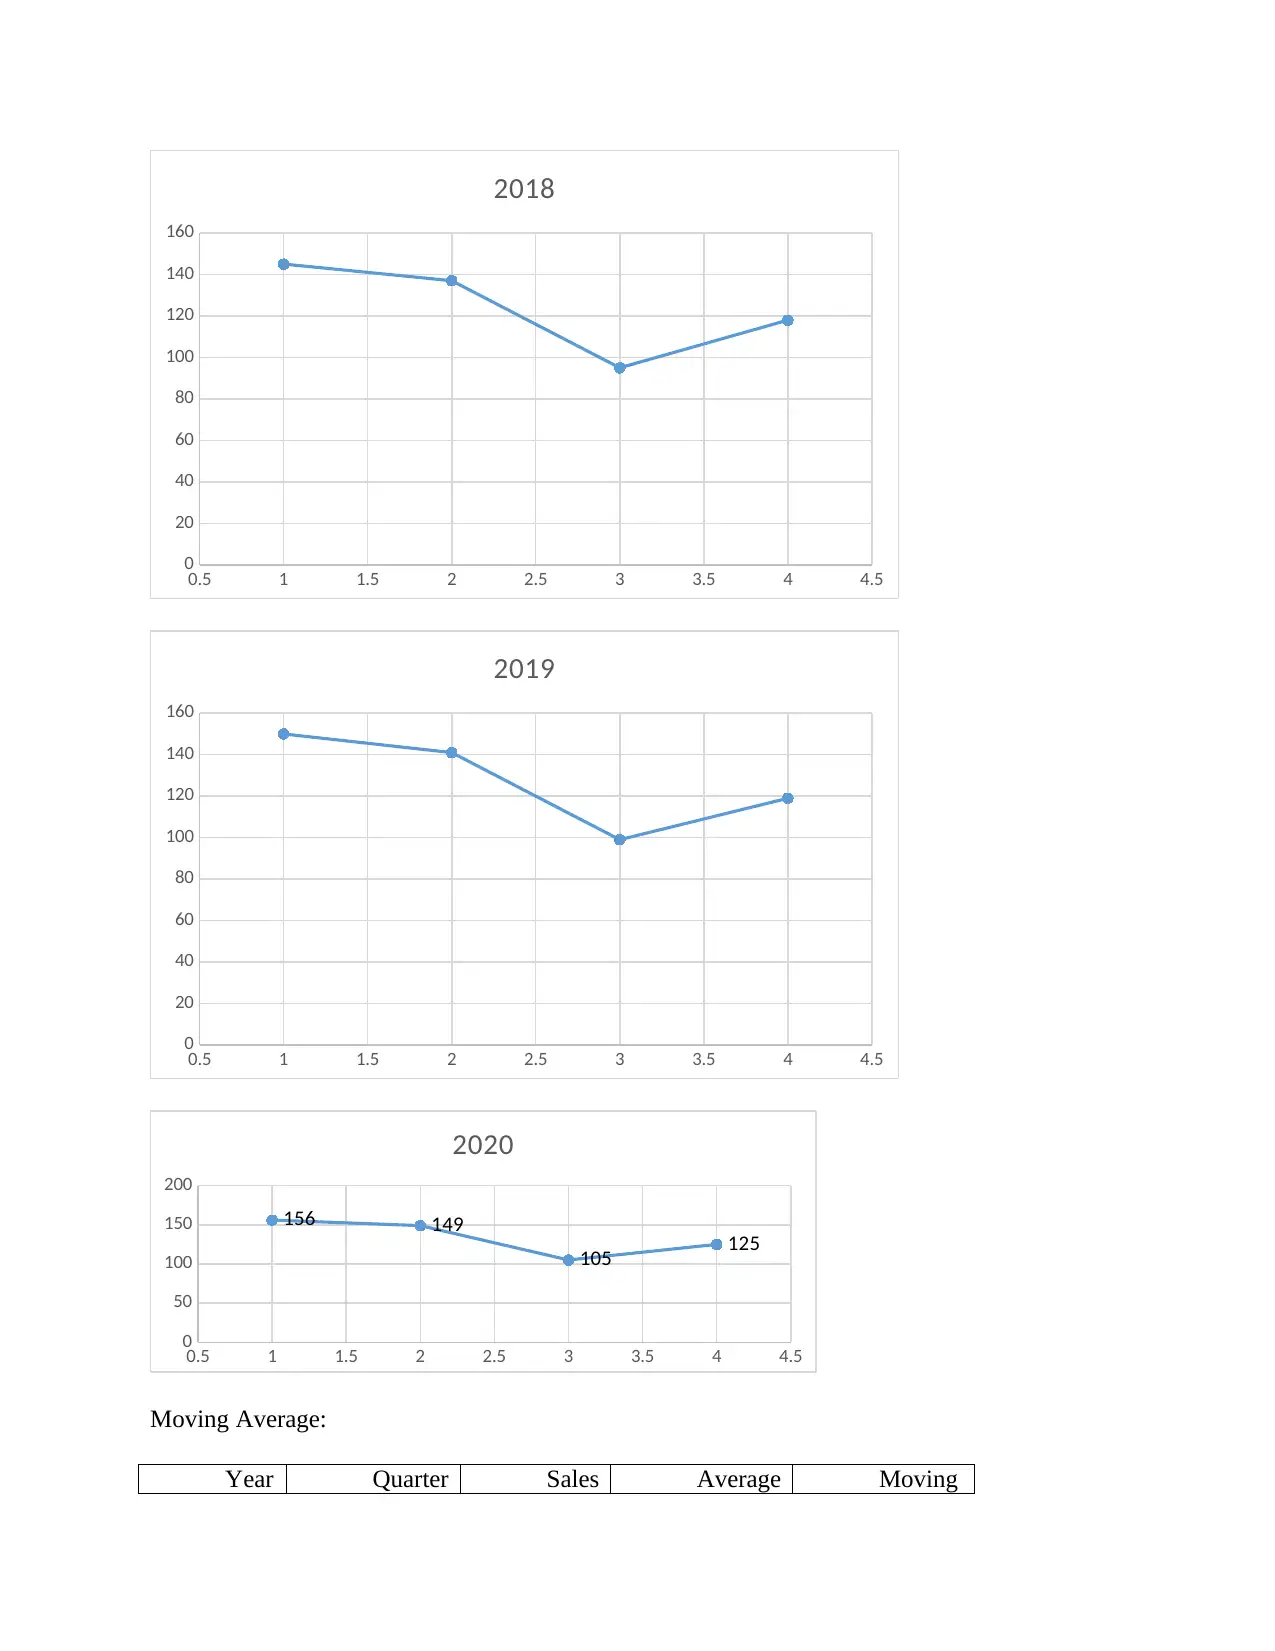
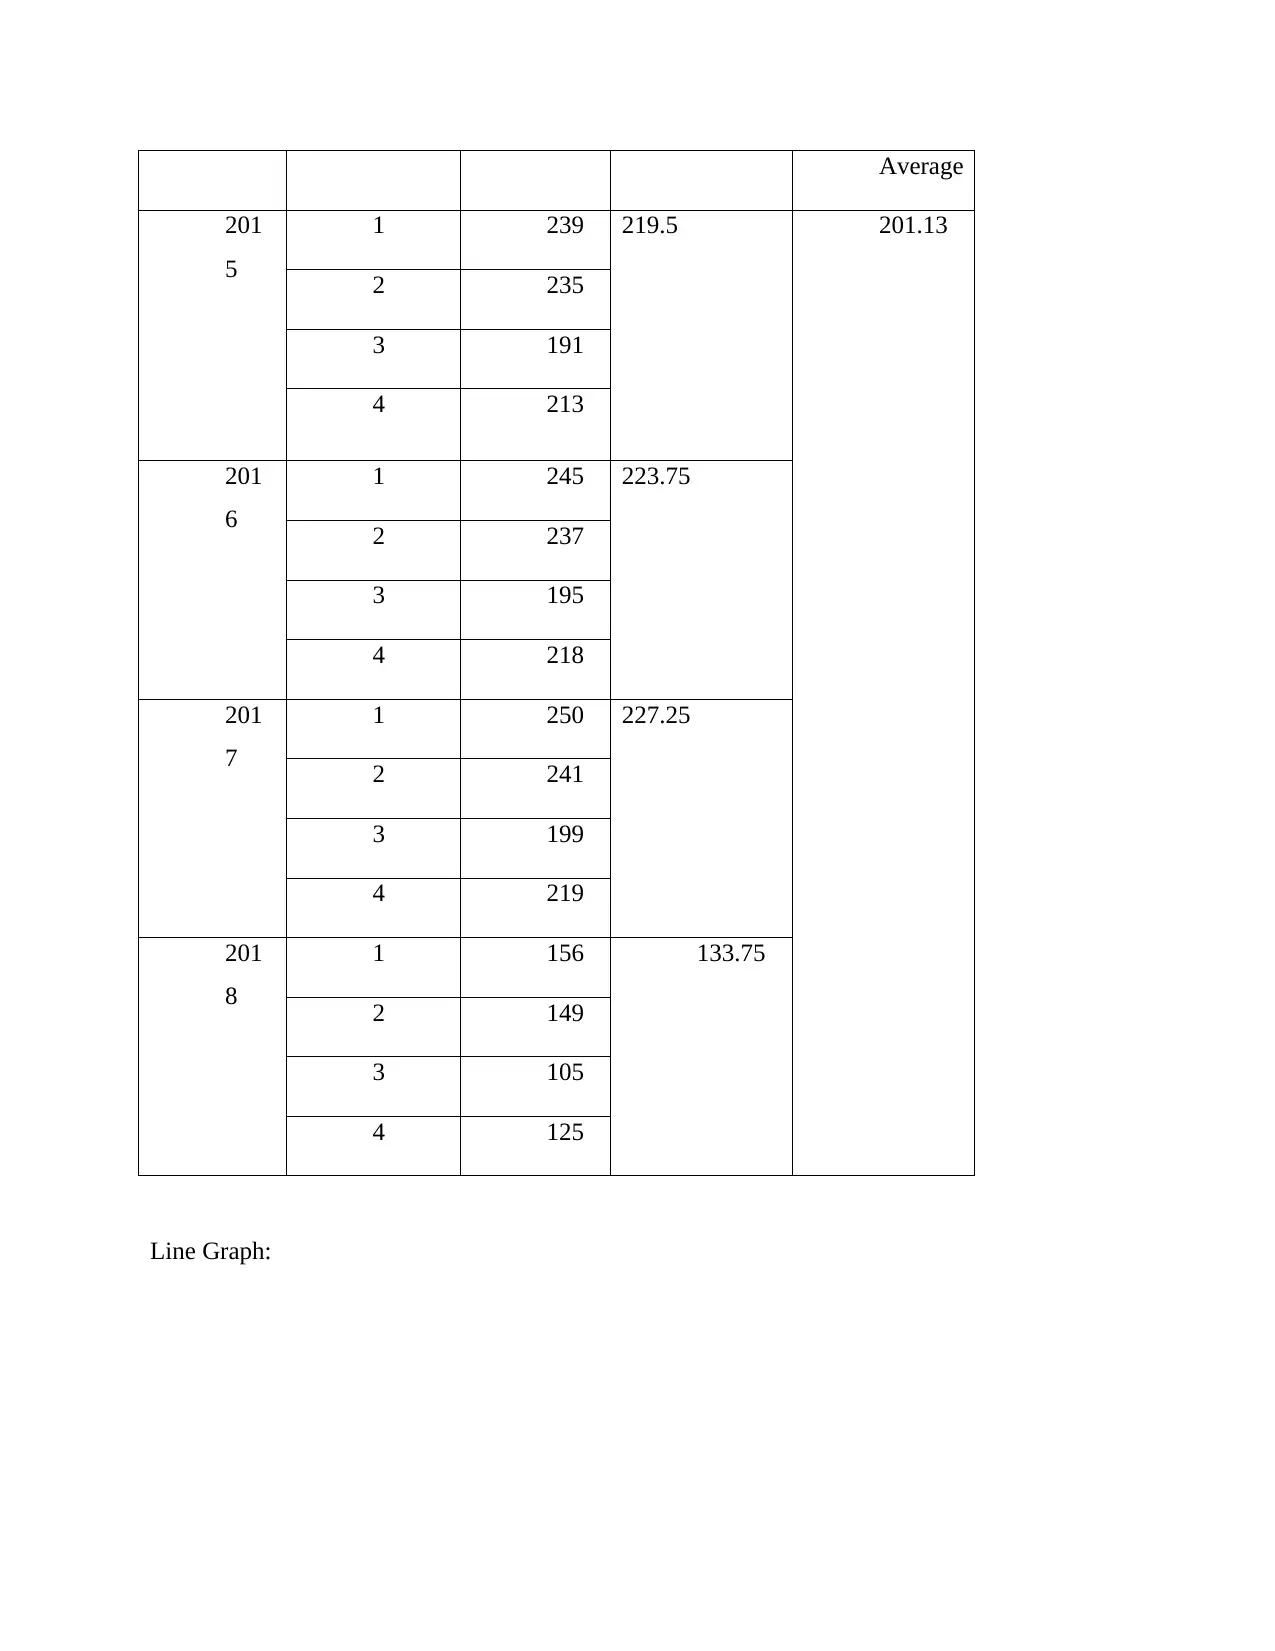
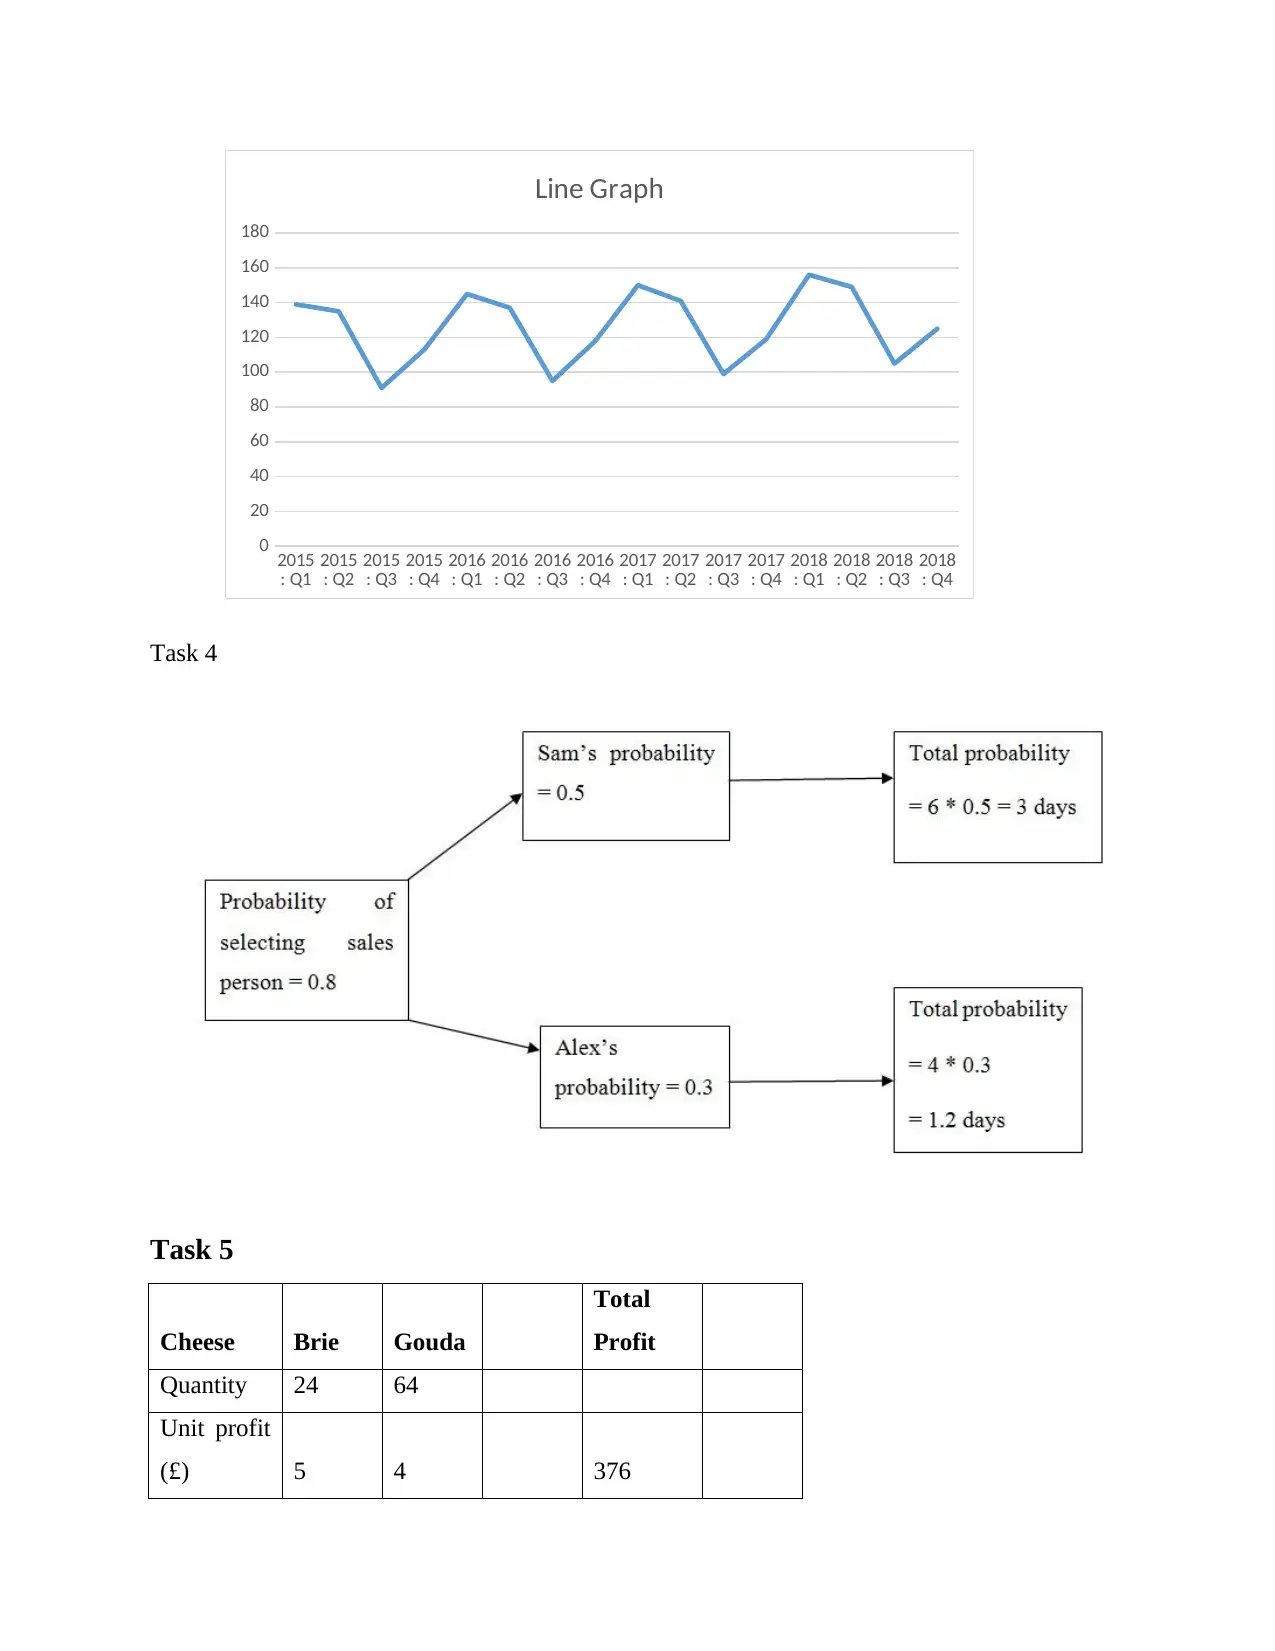
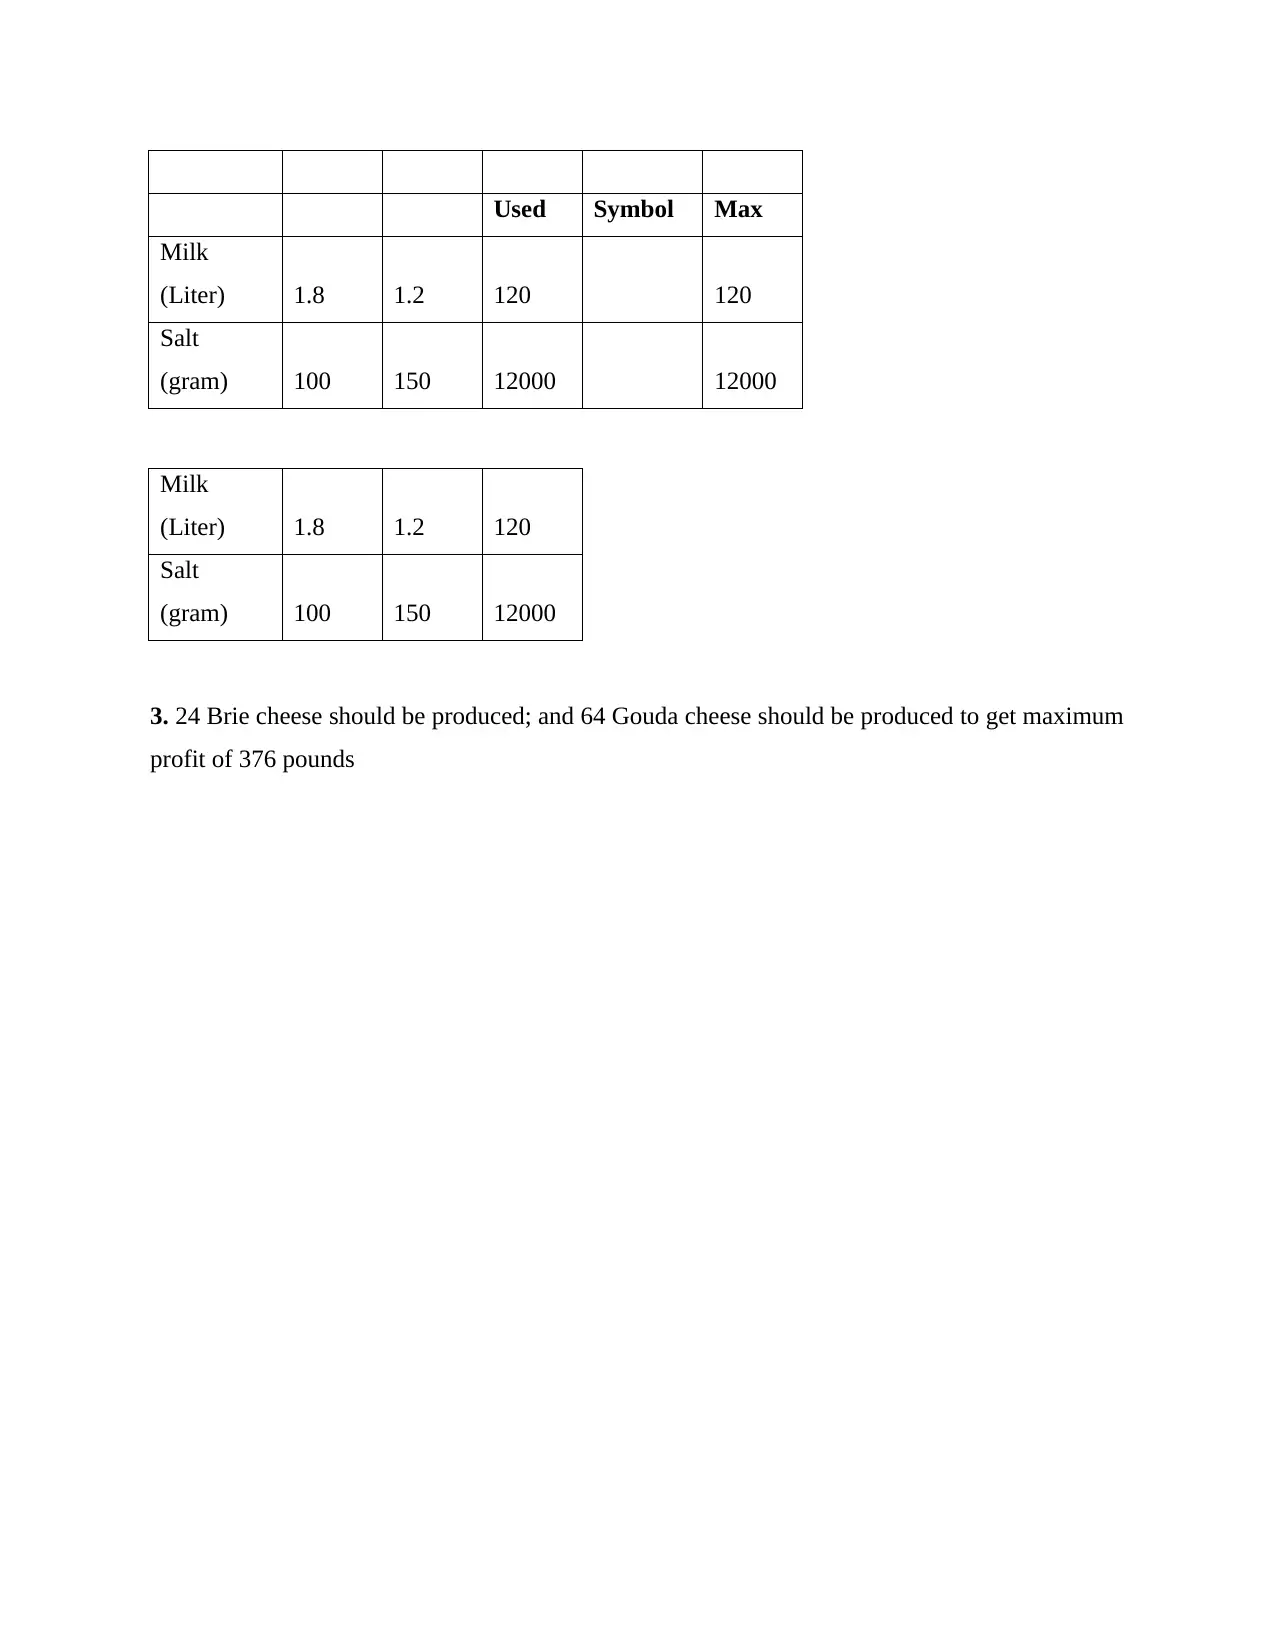
This assignment solution provides a detailed analysis of data and information management, encompassing several tasks. Task 1 focuses on frequency and percentage analysis of categorical variables like gender, education, age, SCC user, and spending, including graphical representations and descriptive statistics. Task 2 presents a network diagram and explores the critical path method. Task 3 involves creating a line graph, calculating a moving average, and interpreting sales data across multiple years. Tasks 4 and 5 delve into linear programming, formulating a problem to maximize profit by producing different types of cheese, considering constraints on resources such as milk and salt. The solution offers a complete guide to understanding and applying data analysis techniques.
Document Page
Using and Managing Data and Information
tabler-icon-diamond-filled.svg

Paraphrase This Document

Need a fresh take? Get an instant paraphrase of this document with our AI Paraphraser
Document Page
Contents
TASK 1.......................................................................................................................................................3
TASK 2.......................................................................................................................................................3
TASK 3.......................................................................................................................................................4
Task 4..........................................................................................................................................................7
Task 5.........................................................................................................................................................7
Document Page
TASK 1
2. Frequency and percentage of frequency
Gender
Gender Frequency % frequency
Female 29 58.00%
Male 20 40.00%
Pfns 1 2.00%
Grand Total 50 100.00%
Education
Education Frequency % Frequency
A’ level or
Diploma 18 36.00%
Degree or further 19 38.00%
GCSE or below 13 26.00%
Grand Total 50 100.00%
Age
Age Frequency % Frequency
< 21 4 8.00%
> 60 14 28.00%
21 - 34 3 6.00%
35 - 47 6 12.00%
48 - 60 23 46.00%
Grand Total 50 100.00%
SCC User
SCC user Frequency % Frequency
No 35 70.00%
Yes 15 30.00%
Grand Total 50 100.00%
Document Page
Spending
Freque
ncy
< 100 5
100- 109 10
110 - 119 14
120 - 129 17
130 - 140 3
> 140 1
Total 50
3. Graphical Representation
Education
A’ level or Diploma
36%
Degree or further
38%
GCSE or below
26%
Education
Age
tabler-icon-diamond-filled.svg

Paraphrase This Document

Need a fresh take? Get an instant paraphrase of this document with our AI Paraphraser
Document Page
< 21 > 60 21 - 34 35 - 47 48 - 60
0
5
10
15
20
25
Age
Total
Spending
< 100 100- 109 110 - 119 120 - 129 130 - 140 > 140
0
5
10
15
20
Histogram
Spending
Frequency
4. Descriptive statistics
Spending (£)
Mean 117.42
Standard Error
1.61120
8
Median 119.5
Mode 125
Standard
Deviation
11.3929
6
Sample Variance
129.799
6
Kurtosis
0.36818
7
Document Page
Skewness
0.04021
5
Range 54
Minimum 95
Maximum 149
Sum 5871
Count 50
TASK 2
Network diagram- This is defined as a form of diagram in which different activities and tasks are
divided into sub activities starting from nodes. Each node contains information about name of
activity and time period which will be consumed in order to complete a task. Below a network
diagram is produced in such manner:
2. Total time period:
3+2+3+2+1+2+2+1 = 16
3. Critical path method: It is known as a form of method in which those activities are determined
will consume more time. Below critical path of given information is produced in such manner:
Document Page
TASK 3
1. Draw a line graph to represent the sales figures.
1 2 3 4
0
20
40
60
80
100
120
140
160
139 135
91
113
2017
tabler-icon-diamond-filled.svg

Paraphrase This Document

Need a fresh take? Get an instant paraphrase of this document with our AI Paraphraser
Document Page
0.5 1 1.5 2 2.5 3 3.5 4 4.5
0
20
40
60
80
100
120
140
160
2018
0.5 1 1.5 2 2.5 3 3.5 4 4.5
0
20
40
60
80
100
120
140
160
2019
0.5 1 1.5 2 2.5 3 3.5 4 4.5
0
50
100
150
200
156 149
105 125
2020
Moving Average:
Year Quarter Sales Average Moving
Document Page
Average
201
5
1 239 219.5 201.13
2 235
3 191
4 213
201
6
1 245 223.75
2 237
3 195
4 218
201
7
1 250 227.25
2 241
3 199
4 219
201
8
1 156 133.75
2 149
3 105
4 125
Line Graph:
Document Page
2015
: Q1
2015
: Q2
2015
: Q3
2015
: Q4
2016
: Q1
2016
: Q2
2016
: Q3
2016
: Q4
2017
: Q1
2017
: Q2
2017
: Q3
2017
: Q4
2018
: Q1
2018
: Q2
2018
: Q3
2018
: Q4
0
20
40
60
80
100
120
140
160
180
Line Graph
Task 4
Task 5
Cheese Brie Gouda
Total
Profit
Quantity 24 64
Unit profit
(£) 5 4 376
tabler-icon-diamond-filled.svg

Paraphrase This Document

Need a fresh take? Get an instant paraphrase of this document with our AI Paraphraser
Document Page
Used Symbol Max
Milk
(Liter) 1.8 1.2 120 120
Salt
(gram) 100 150 12000 12000
Milk
(Liter) 1.8 1.2 120
Salt
(gram) 100 150 12000
3. 24 Brie cheese should be produced; and 64 Gouda cheese should be produced to get maximum
profit of 376 pounds
chevron_up_icon
1 out of 11
circle_padding
hide_on_mobile
zoom_out_icon
[object Object]