Data Analysis and Forecasting Report - London School of Commerce
VerifiedAdded on 2023/01/16
|9
|1423
|50
Report
AI Summary
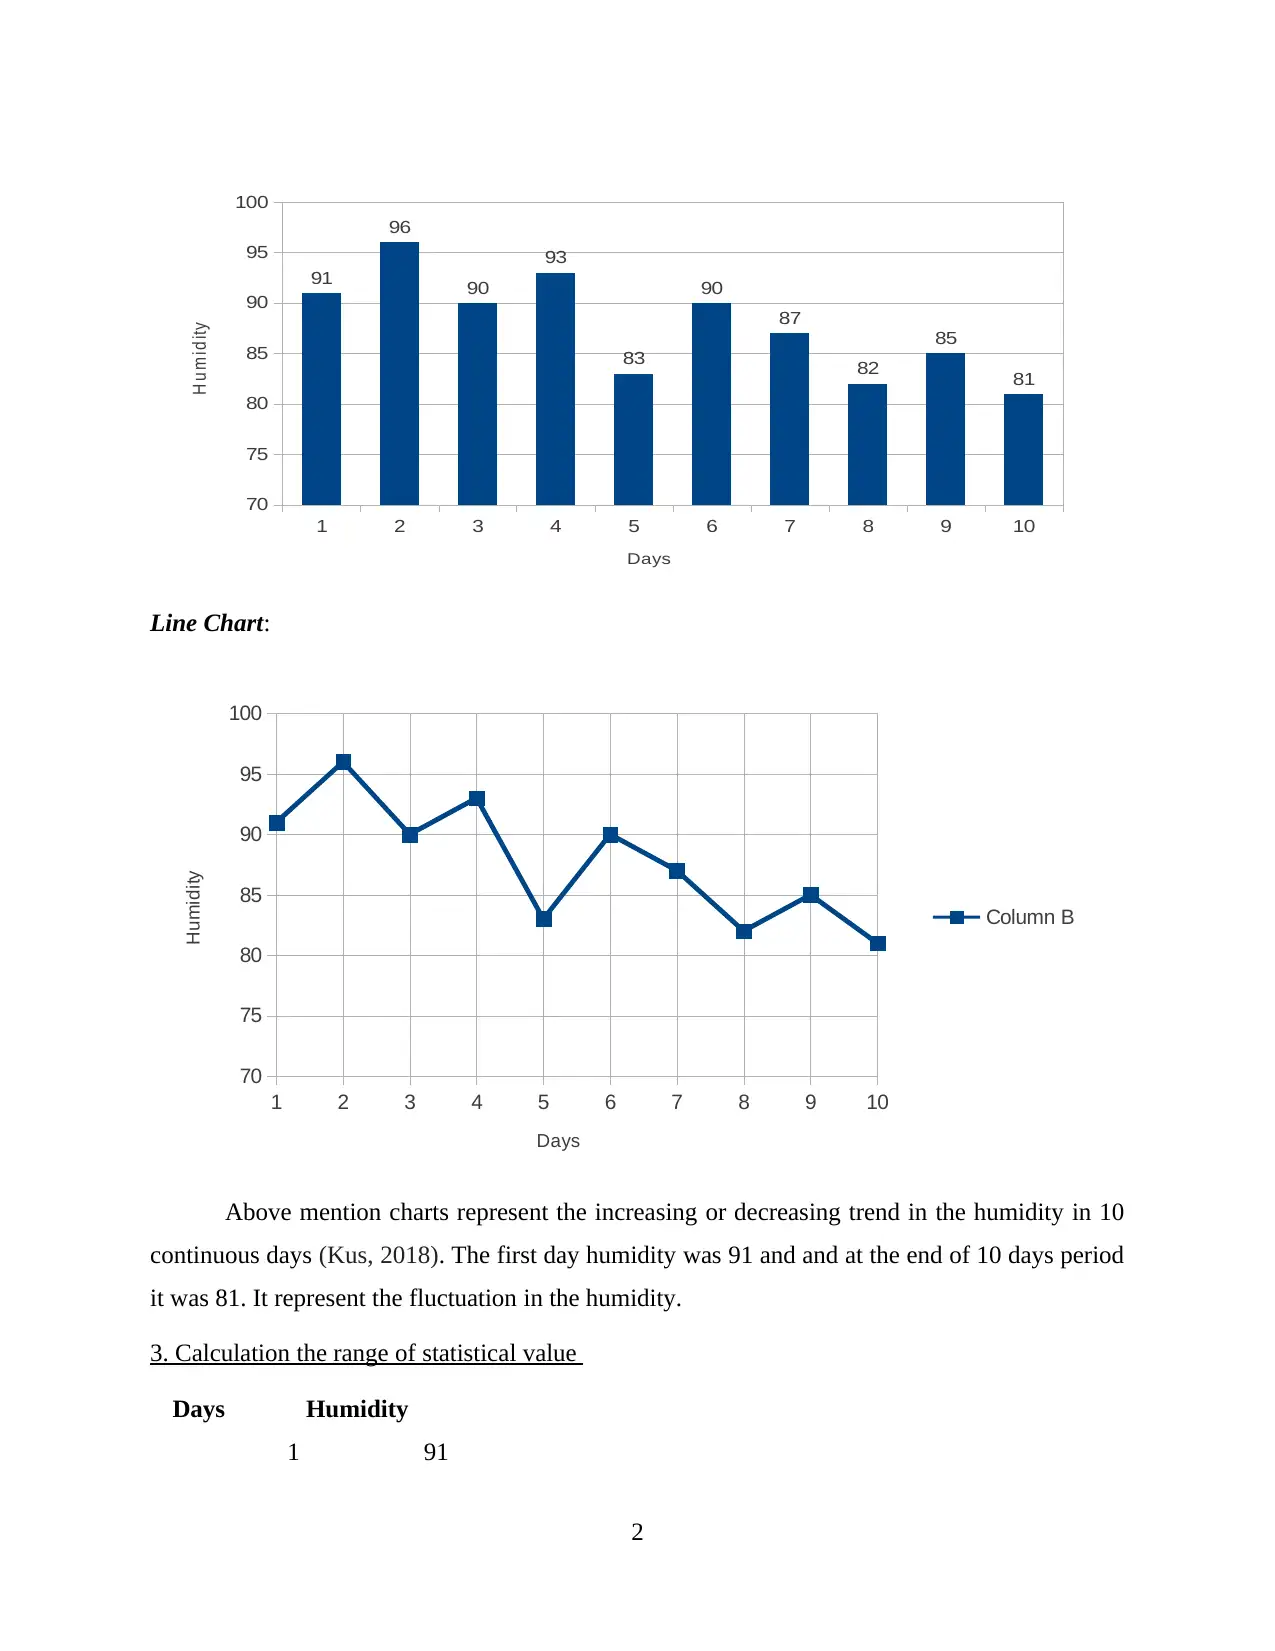
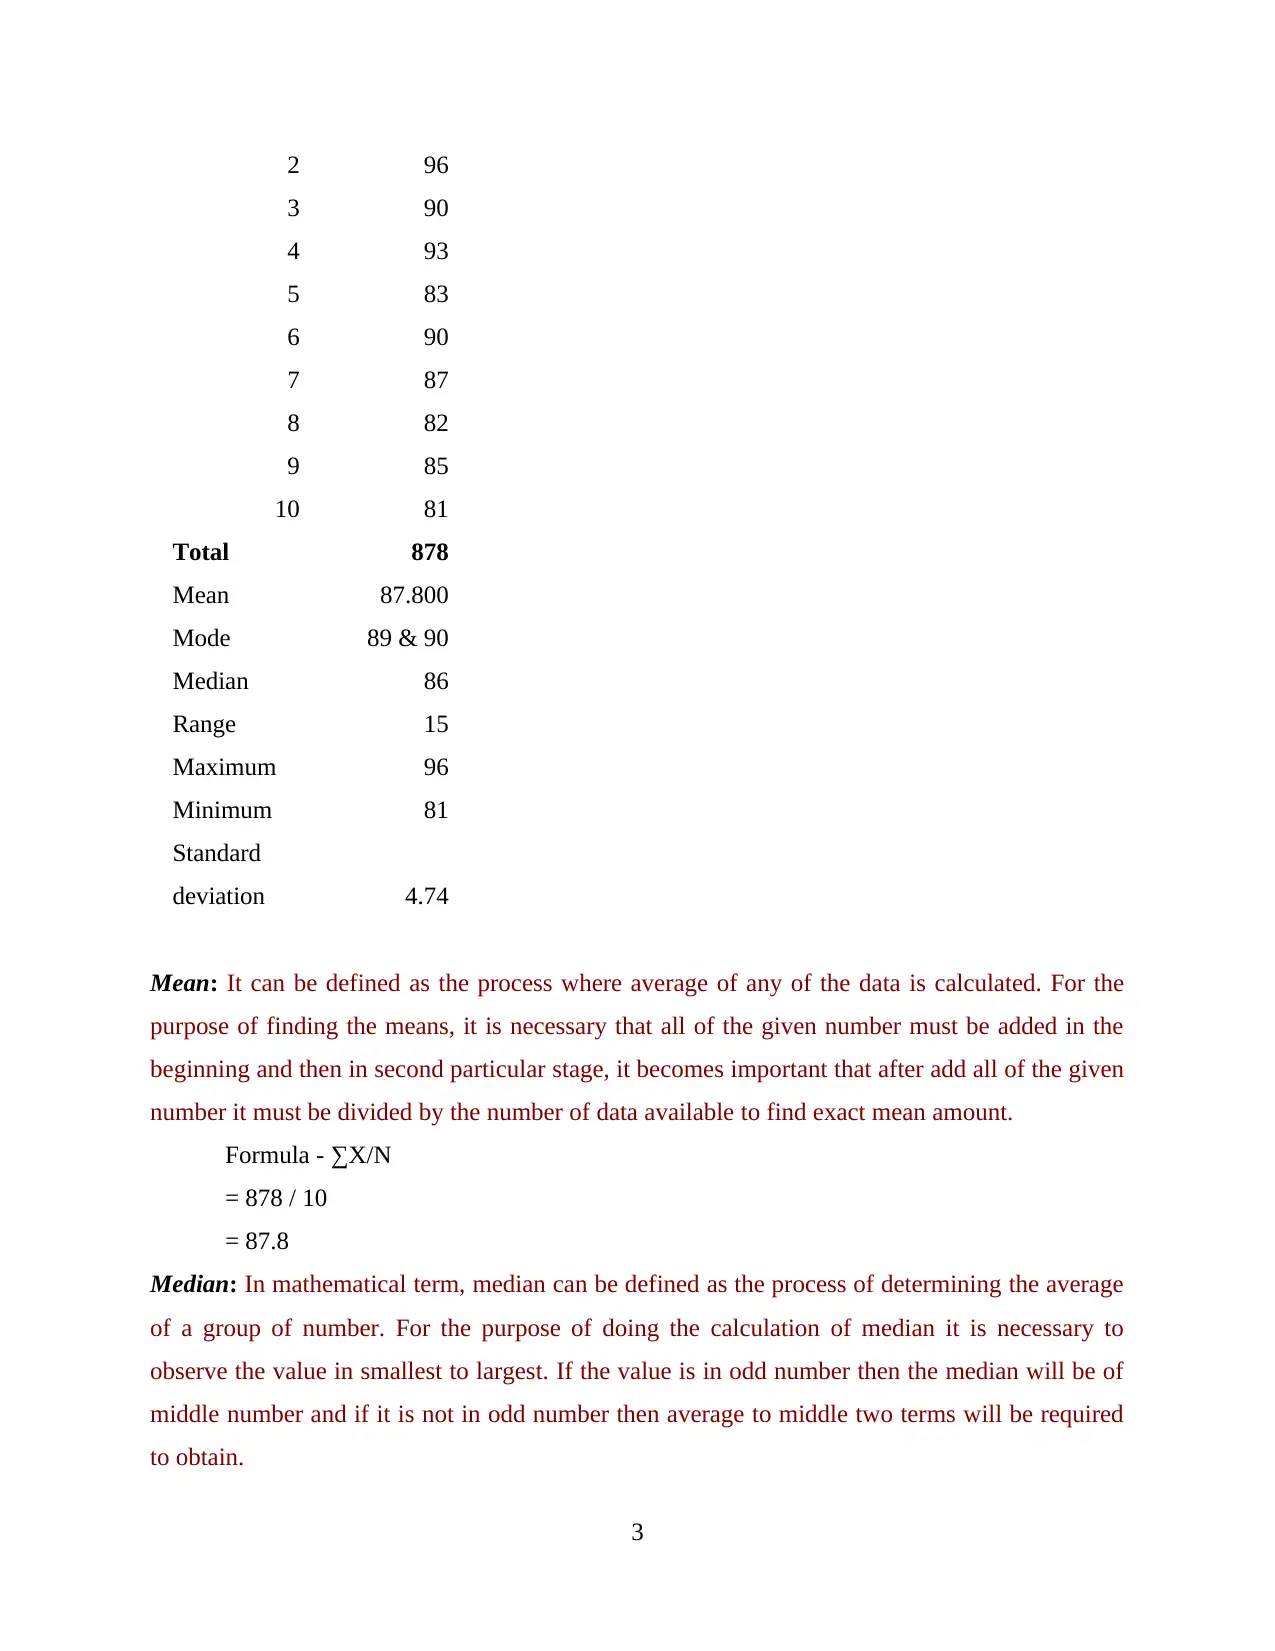
This report analyzes humidity data collected over a ten-day period in London, employing various statistical methods and forecasting techniques. The report begins with a tabular arrangement of the data and its representation in both column and line charts to illustrate trends. Key statistical values, including mean, median, mode, range, and standard deviation, are calculated and explained. Furthermore, the report applies a linear forecasting model to predict future humidity levels, calculating humidity forecasts for the 15th and 20th days. The conclusion summarizes the importance of data analysis for information gathering and future forecasting, with references to relevant sources.

University
Paraphrase This Document
Need a fresh take? Get an instant paraphrase of this document with our AI Paraphraser

Table of Contents
INTRODUCTION...........................................................................................................................1
MAIN BODY...................................................................................................................................1
1. Arrangement of data in tabular format.....................................................................................1
2. Representation of data in the chart format...............................................................................1
3. Calculation the range of statistical value ................................................................................2
4. Apply linear forecasting model and calculate y = mx = c ......................................................4
CONCLUSION................................................................................................................................5
REFERENCES................................................................................................................................6

INTRODUCTION
Data analysis is the process of collecting and analysing data or information that helps in
business operations to improve their performances or make future stargates (Kahan and et.al.,
2017). This assessment based on humidity level of London and in this report required to
represent data in line or column chart formal. In addition it includes the calculation of median,
mode, mean, linear forecasting for future humidity forecasting etc.
MAIN BODY
1. Arrangement of data in tabular format
Days Humidity
1 91
2 96
3 90
4 93
5 83
6 90
7 87
8 82
9 85
10 81
2. Representation of data in the chart format
Column Chart:
1
⊘ This is a preview!⊘
Do you want full access?
Subscribe today to unlock all pages.

Trusted by 1+ million students worldwide

1 2 3 4 5 6 7 8 9 10
70
75
80
85
90
95
100
91
96
90
93
83
90
87
82
85
81
Days
H u m id ity
Line Chart:
1 2 3 4 5 6 7 8 9 10
70
75
80
85
90
95
100
Column B
Days
Humidity
Above mention charts represent the increasing or decreasing trend in the humidity in 10
continuous days (Kus, 2018). The first day humidity was 91 and and at the end of 10 days period
it was 81. It represent the fluctuation in the humidity.
3. Calculation the range of statistical value
Days Humidity
1 91
2
70
75
80
85
90
95
100
91
96
90
93
83
90
87
82
85
81
Days
H u m id ity
Line Chart:
1 2 3 4 5 6 7 8 9 10
70
75
80
85
90
95
100
Column B
Days
Humidity
Above mention charts represent the increasing or decreasing trend in the humidity in 10
continuous days (Kus, 2018). The first day humidity was 91 and and at the end of 10 days period
it was 81. It represent the fluctuation in the humidity.
3. Calculation the range of statistical value
Days Humidity
1 91
2
Paraphrase This Document
Need a fresh take? Get an instant paraphrase of this document with our AI Paraphraser

2 96
3 90
4 93
5 83
6 90
7 87
8 82
9 85
10 81
Total 878
Mean 87.800
Mode 89 & 90
Median 86
Range 15
Maximum 96
Minimum 81
Standard
deviation 4.74
Mean: It can be defined as the process where average of any of the data is calculated. For the
purpose of finding the means, it is necessary that all of the given number must be added in the
beginning and then in second particular stage, it becomes important that after add all of the given
number it must be divided by the number of data available to find exact mean amount.
Formula - ∑X/N
= 878 / 10
= 87.8
Median: In mathematical term, median can be defined as the process of determining the average
of a group of number. For the purpose of doing the calculation of median it is necessary to
observe the value in smallest to largest. If the value is in odd number then the median will be of
middle number and if it is not in odd number then average to middle two terms will be required
to obtain.
3

Formula – [N+1] / 2
= [ 10 + 1 ] / 2
= 5.5th observation that is 87 & 90.
= 88.5
Mode: It is defined as the mathematical calculation where value is decided on the basis of
frequent occurrence or even the value which is used for maximum times. The major advantage of
mode is that it can be used in any type of given data but on the other hand of side, it is never
possible in case of mean and median.
In this case, there is only one mode, which is 90 and it is repeating two times in 10 days
(Malloy‐Weir and Cooper, 2017).
Range: It is explained as the process where difference between the highest and lowest value is
required to be obtained (Range, 2018). The main advantage in range is it is very easy to do
calculation in it and on the other hand the main cons in it is one of the sensitive to outlines where
it doest give focus o n all of the available observations.
Formula = Maximum Value – Minimum Value
= 96 - 81
= 15
Standard deviation: In simple words, it can be defined as the measurement of dispersement in
any of the statical terms. It gives the ideas about the data which has been spread out. It is
calculated as on the basis of square root of variance where it is needed to determine the variation
among each data which is related to mean.
Days
Humidity
(x) x- mean (x-m)2
1 91 3.2 10.24
2 96 8.2 67.24
3 90 2.2 4.84
4 93 5.2 27.04
5 83 -4.8 23.04
6 90 2.2 4.84
7 87 -0.8 0.64
8 82 -5.8 33.64
4
⊘ This is a preview!⊘
Do you want full access?
Subscribe today to unlock all pages.

Trusted by 1+ million students worldwide

9 85 -2.8 7.84
10 81 -6.8 46.24
225.6
Formula = √Variance
Formula of Variance = [ ∑ (x–mean)2/N ]
= 225.6 / 10
= 22.56
Standard deviation = √ 22.56
= 4.74
4. Apply linear forecasting model and calculate y = mx = c
Forecasting can be defined as the process where it is needed to understand that
predicition is required to be done on the basis of past and present data or performance. It is
mainly helpful to find out the result before starting any of the project. Applying liner forecasting
model and X will be consider as days and Y is humidity (Mendez-Carbajo, Jefferson and
Stierholz, 2019). Further calculation mentioned below:
Step 1: Table formulation
Days (X)
Humidity
(Y) X2 XY
1 91 1 91
2 96 4 192
3 90 9 270
4 93 16 372
5 83 25 415
6 90 36 540
7 87 49 609
8 82 64 656
9 85 81 765
10 81 100 810
∑x= 55 ∑y= 878 ∑X2= 385 ∑XY= 4720
5
Paraphrase This Document
Need a fresh take? Get an instant paraphrase of this document with our AI Paraphraser

Step 2: Calculation of the value of M:
Formula: M = [N ∑XY - ∑x ∑y]/ [N ∑X2 - (∑x)2]
= [ 10 * 4720 – (55 * 878) ] / [10*385- (55)2 ]
= [47200 – 48290] / [3850 – 3025]
= -1090 / 825
= -1.32
Step 3: Calculation of value of C:
Formula = { ∑y - m ∑x } / N
= {878 – (-1.32 * 55)} / 10
= 950.6 / 10
= 95.06
Step 4: Humidity on 15th day:
Formula = Y = mx + c
= -1.32 * 15 + 95.06
= -19.8 + 95.06
= 75.26
The level of humidity on 15th day will be 75.26.
Step 5: Humidity on 20th Day:
Formula = Y = mx + c
= -1.32 * 20 + 95.06
= -26.4 + 95.06
= 68.66
The humidity level on 20th day will be 68.66.
CONCLUSION
From the above discussion it has been conclusion that data analysis use to gather
information and use it in appropriate way. These information further beneficial for the future
forecasting. With the help of statistical analysis, individual able to forecast the humidity for the
future.
6

REFERENCES
Books and Journals:
Kahan, D. M. and et.al., 2017. Motivated numeracy and enlightened self-
government. Behavioural Public Policy. 1(1). pp.54-86.
Kus, M., 2018. Numeracy. Brock Education: A Journal of Educational Research and Practice.
27(2).
Malloy‐Weir, L. and Cooper, M., 2017. Health literacy, literacy, numeracy and nutrition label
understanding and use: a scoping review of the literature. Journal of human nutrition
and dietetics. 30(3). pp.309-325.
Mendez-Carbajo, D., Jefferson, C. O. and Stierholz, K. L., 2019. Keeping It Real: Information
Literacy, Numeracy, and Economic Data. Numeracy: Advancing Education in
Quantitative Literacy. 12(2).
Online
Data of Humidity. 2019. [Online]. Available through:
<https://www.bbc.com/weather/2643743>
Range. 2018. [Online]. Available through: <https://www.mathsisfun.com/definitions/range-
statistics-.html>
7
⊘ This is a preview!⊘
Do you want full access?
Subscribe today to unlock all pages.

Trusted by 1+ million students worldwide
1 out of 9
Related Documents

Your All-in-One AI-Powered Toolkit for Academic Success.
+13062052269
info@desklib.com
Available 24*7 on WhatsApp / Email
Unlock your academic potential
Copyright © 2020–2025 A2Z Services. All Rights Reserved. Developed and managed by ZUCOL.