Data Handling Report: Excel, Weka, and Data Mining Methods

Verified

Added on  2023/01/12

|19
|3921
|77
Report
AI Summary
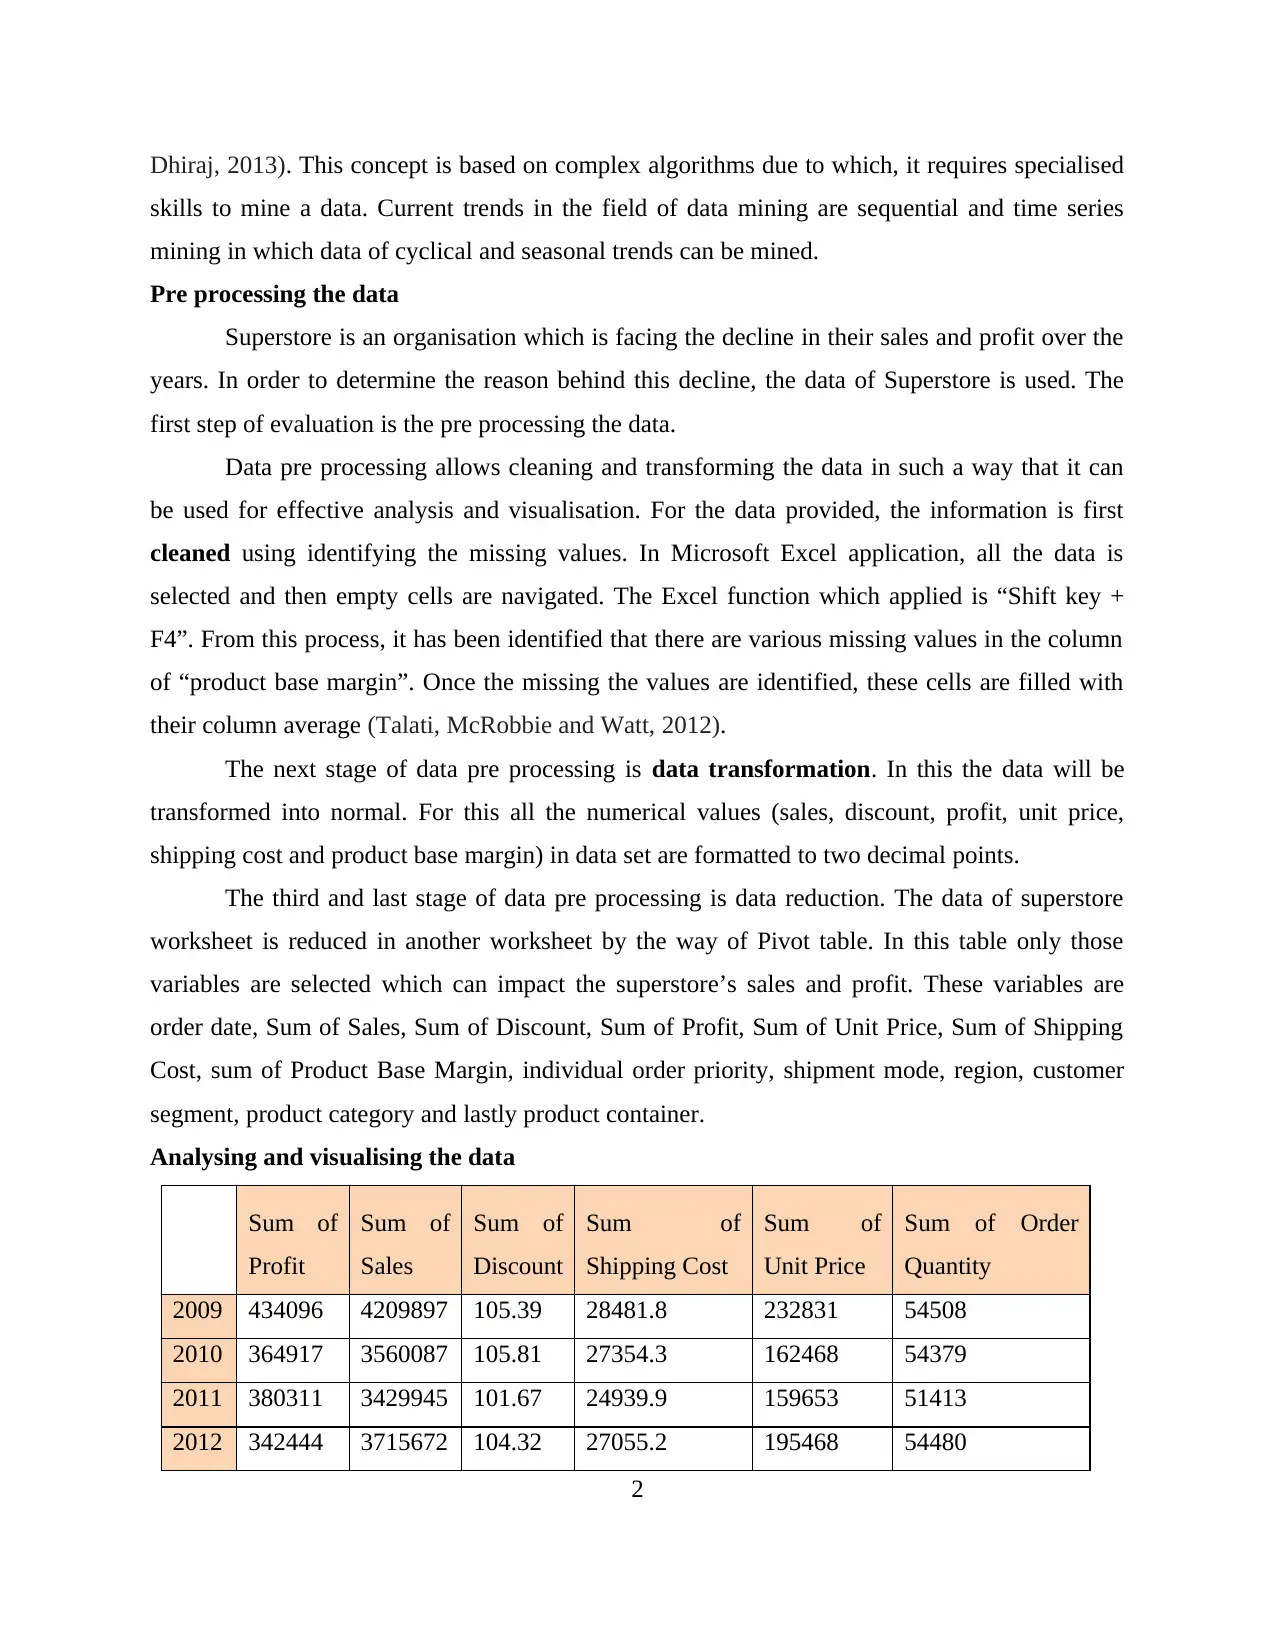
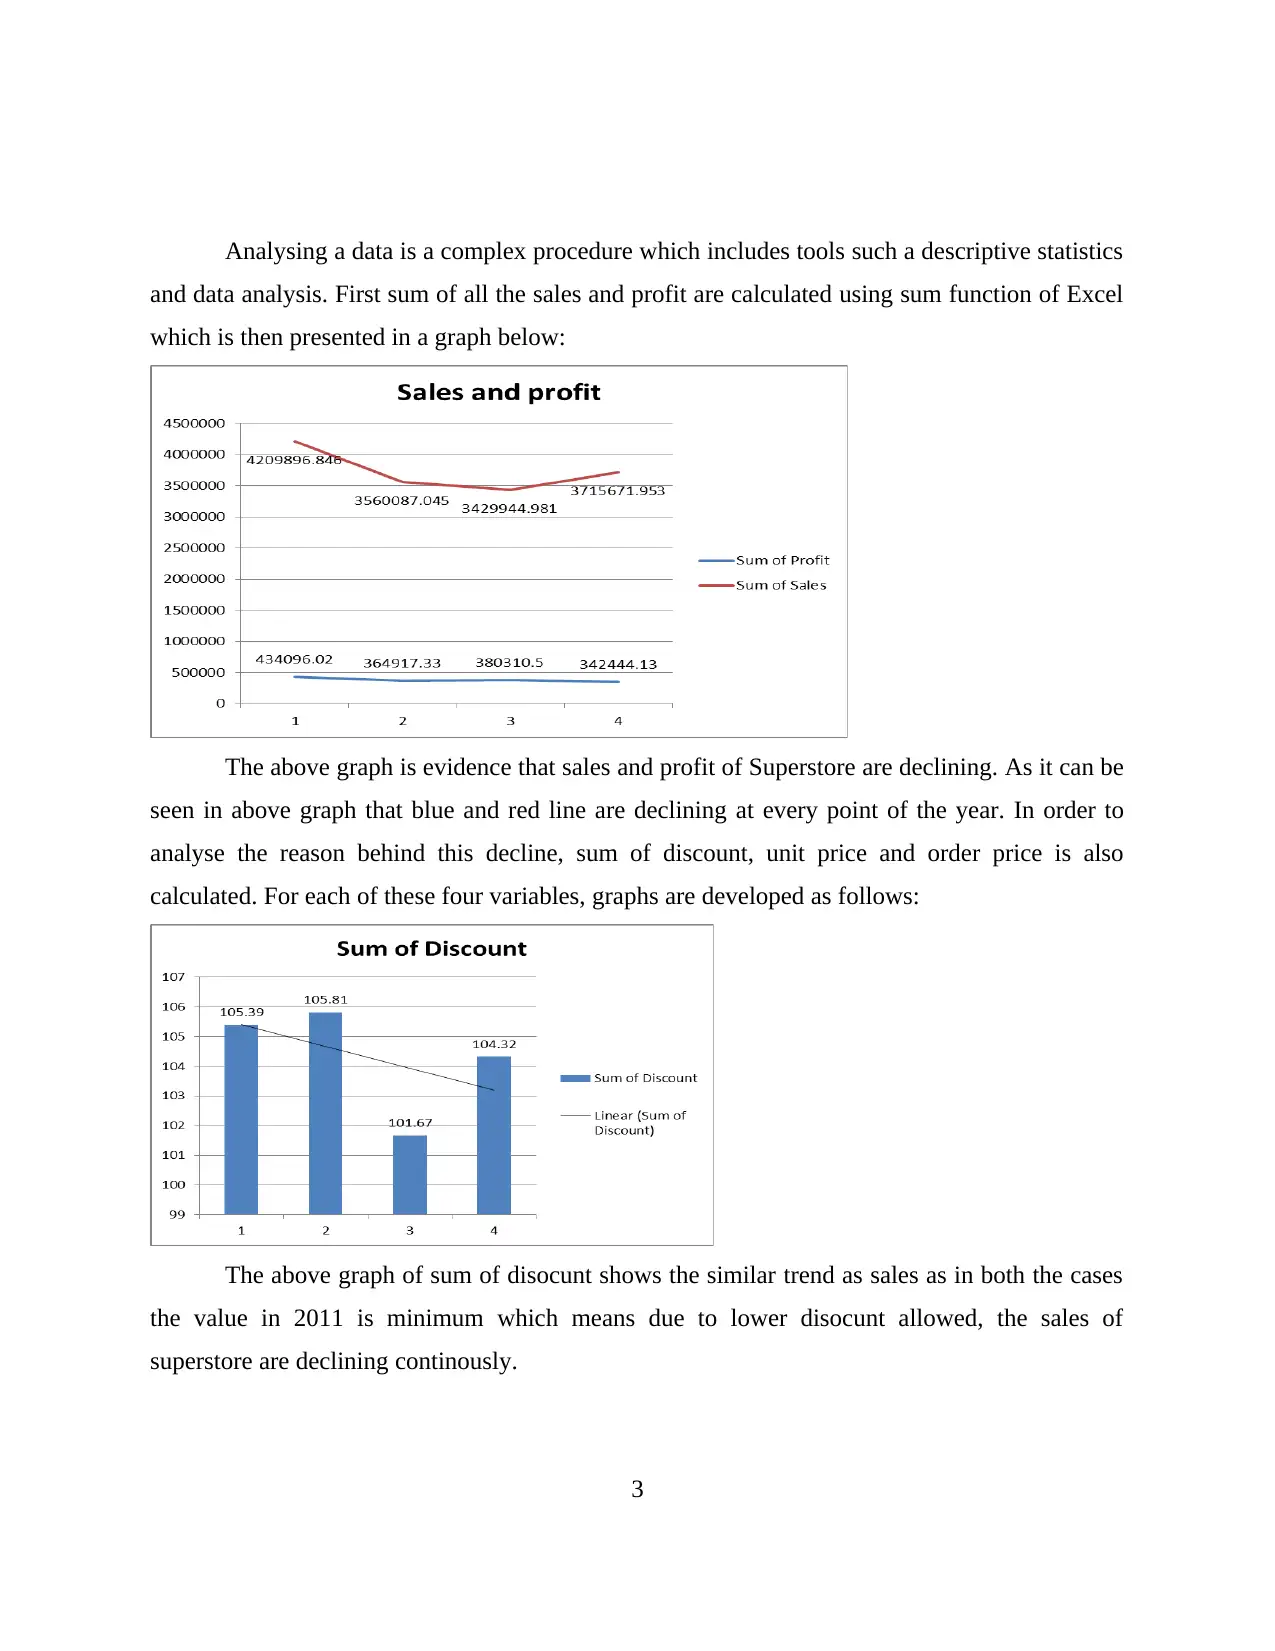
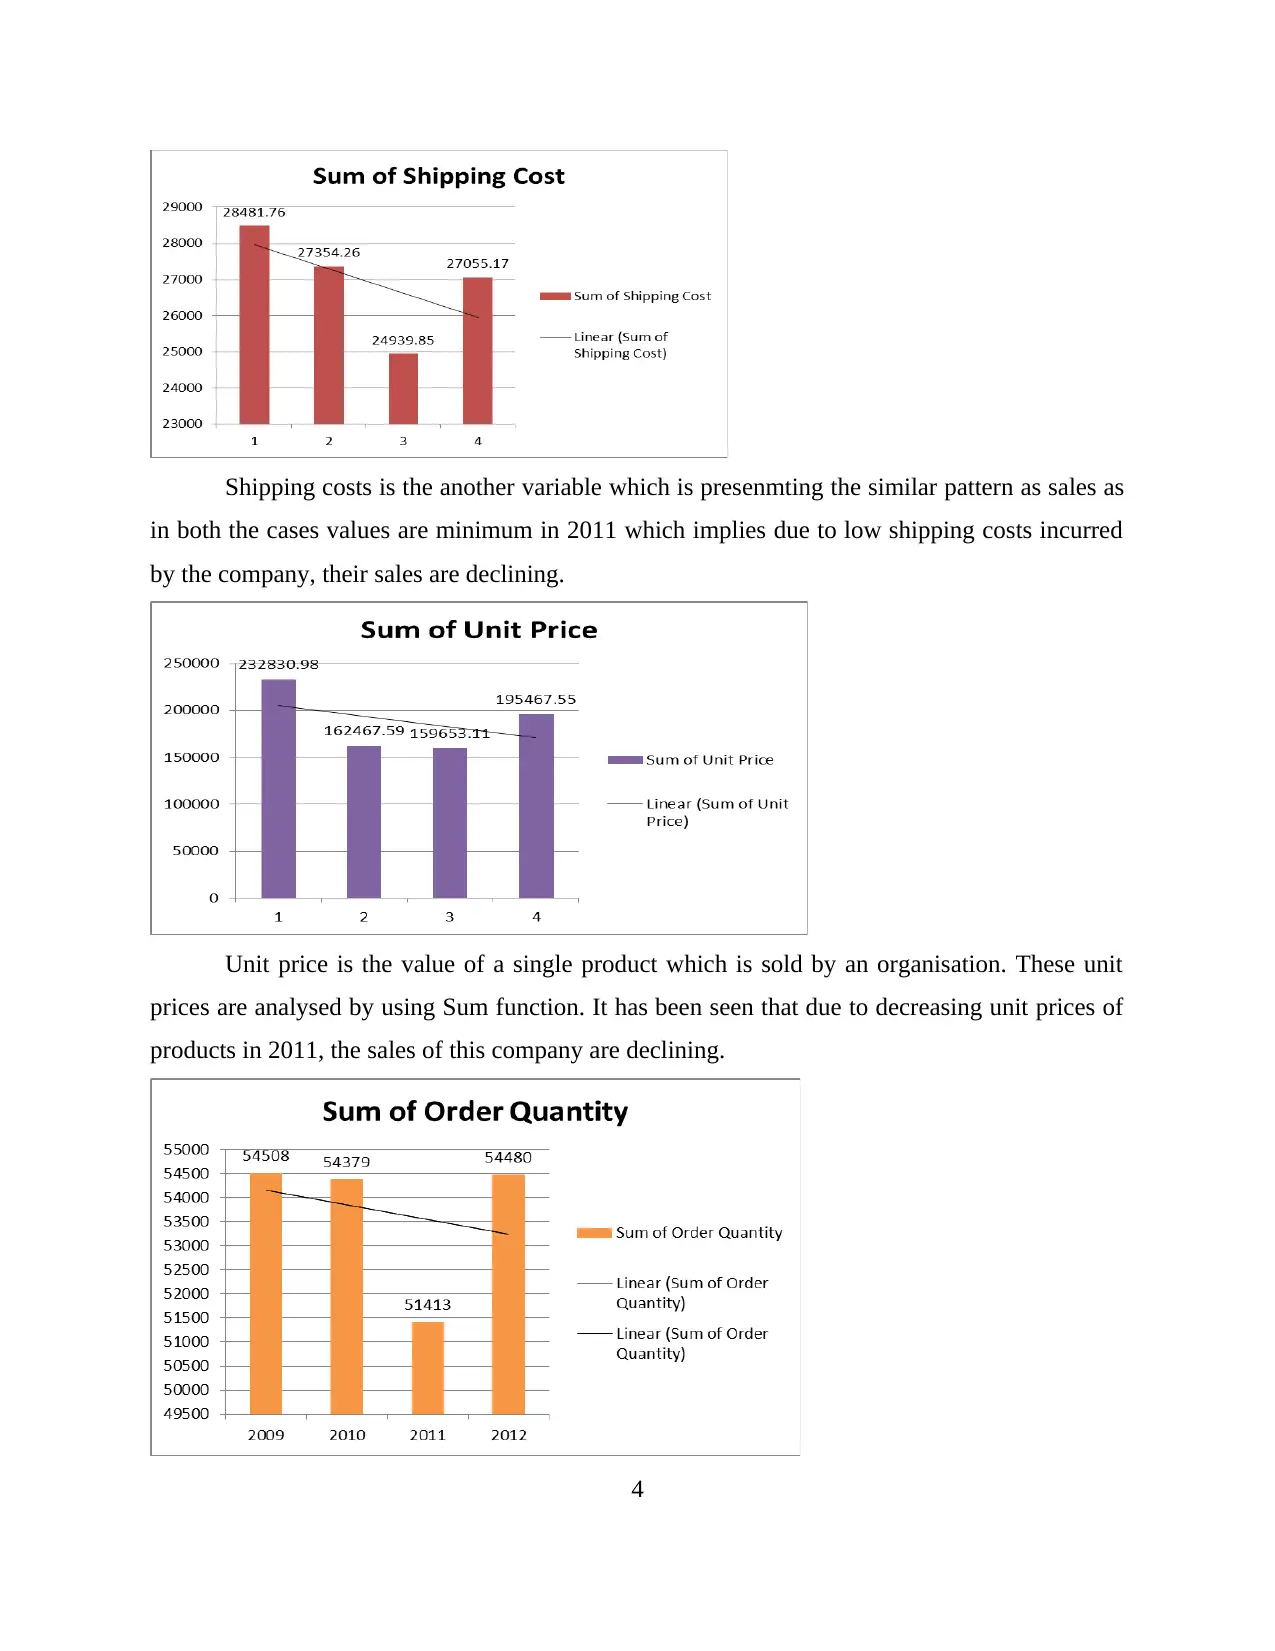
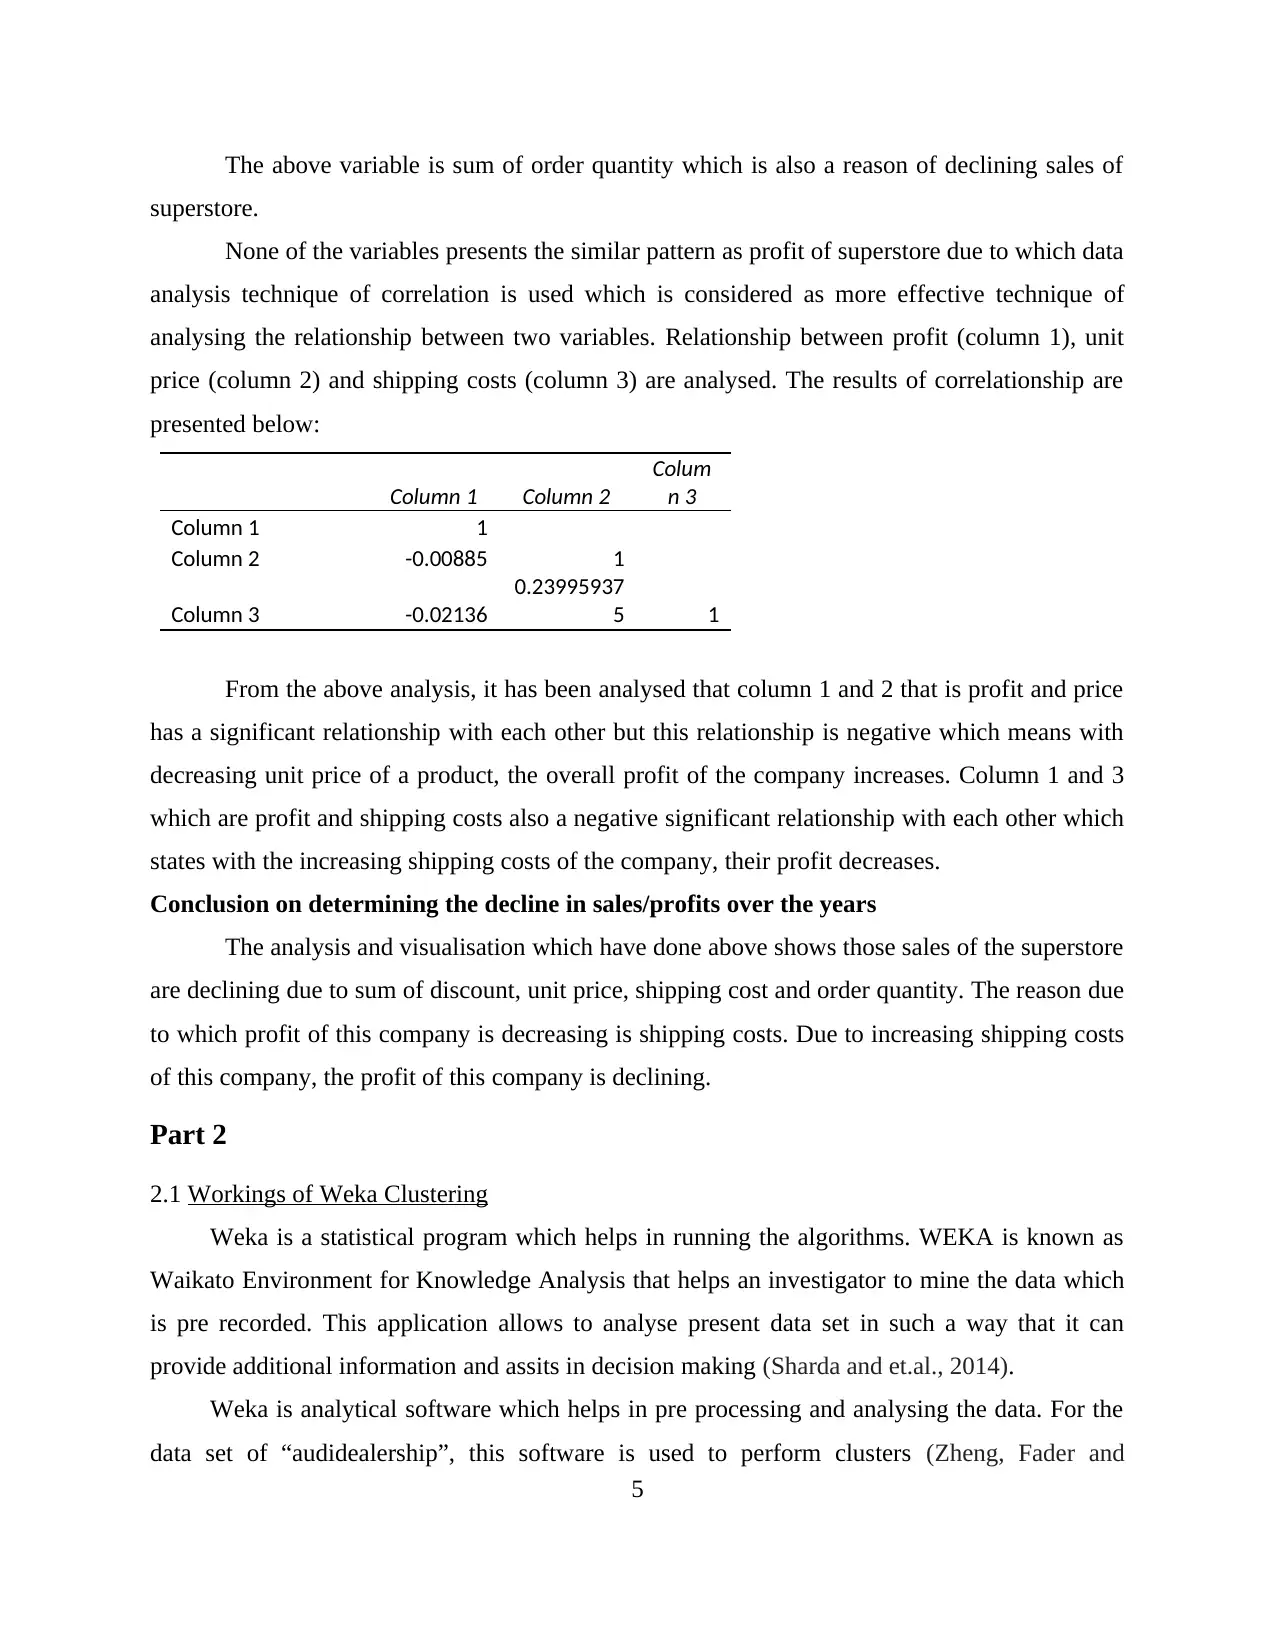
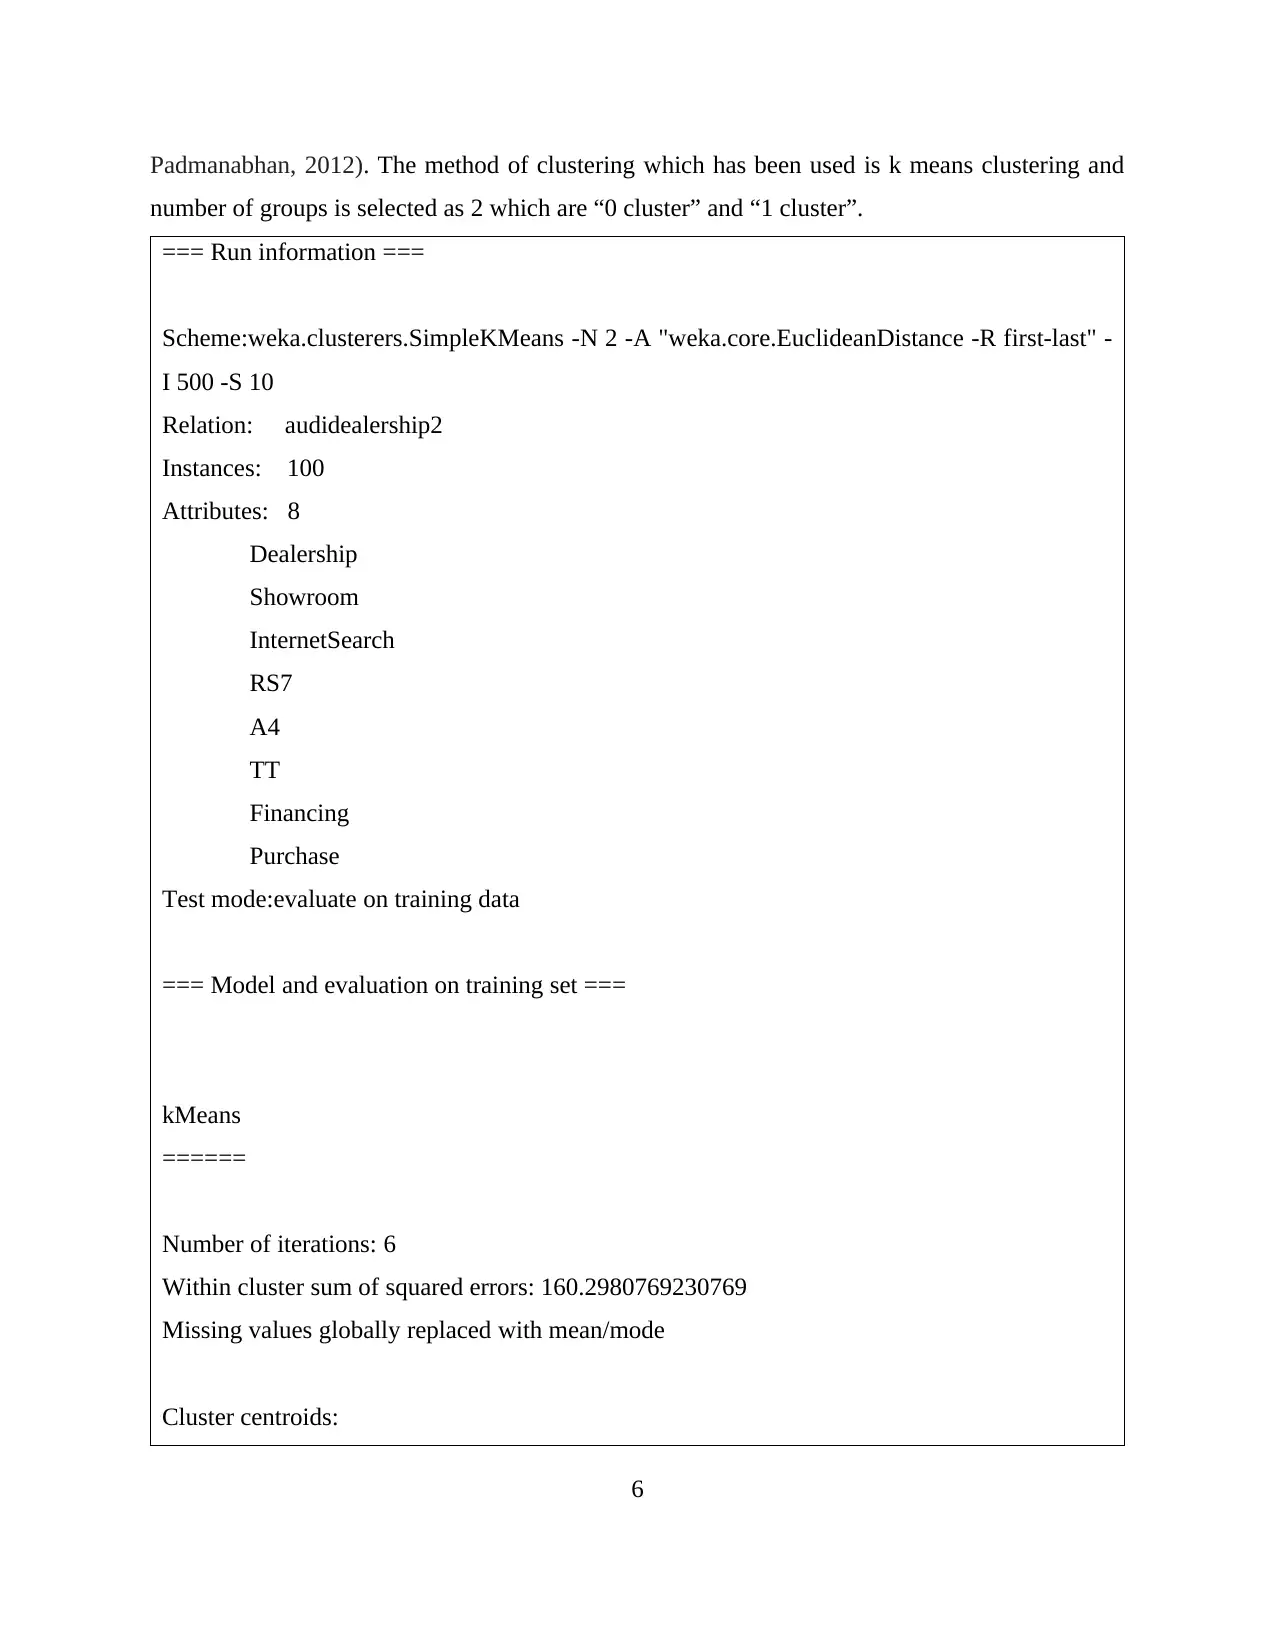
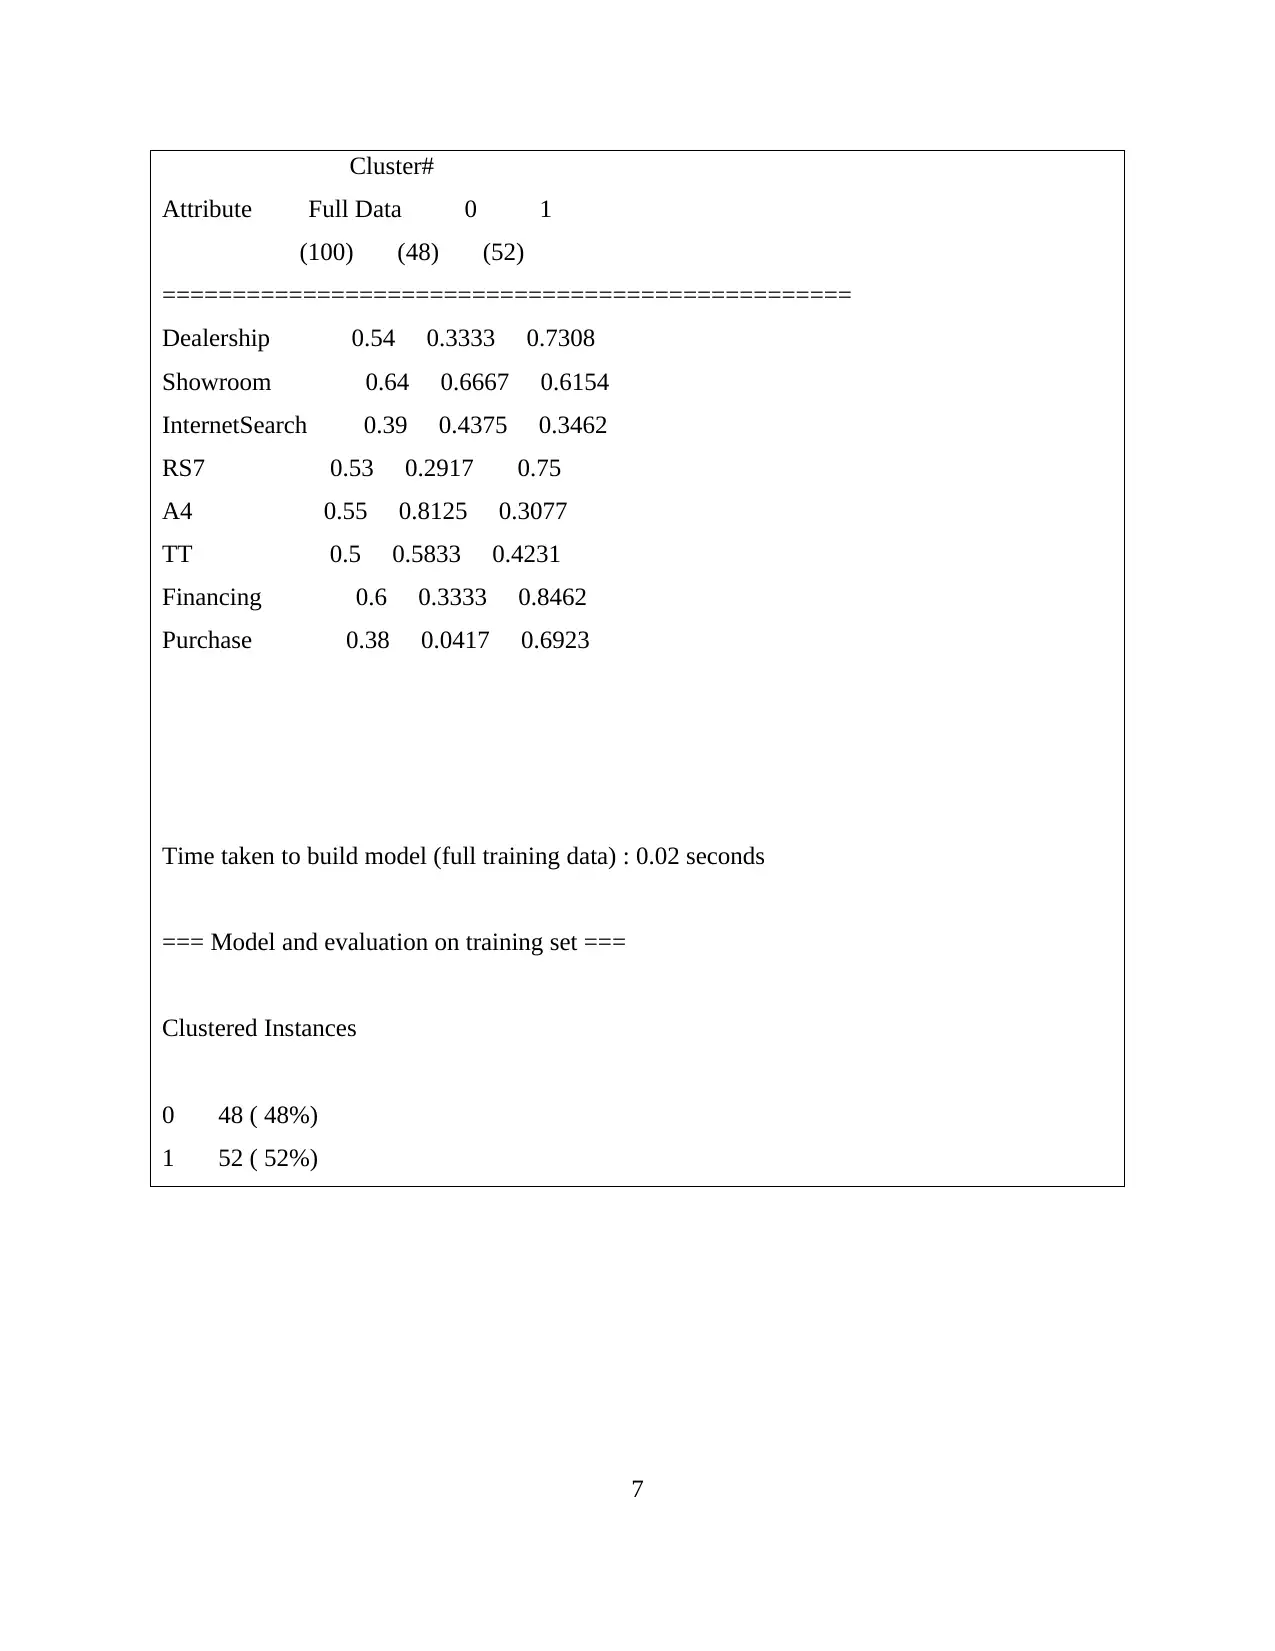
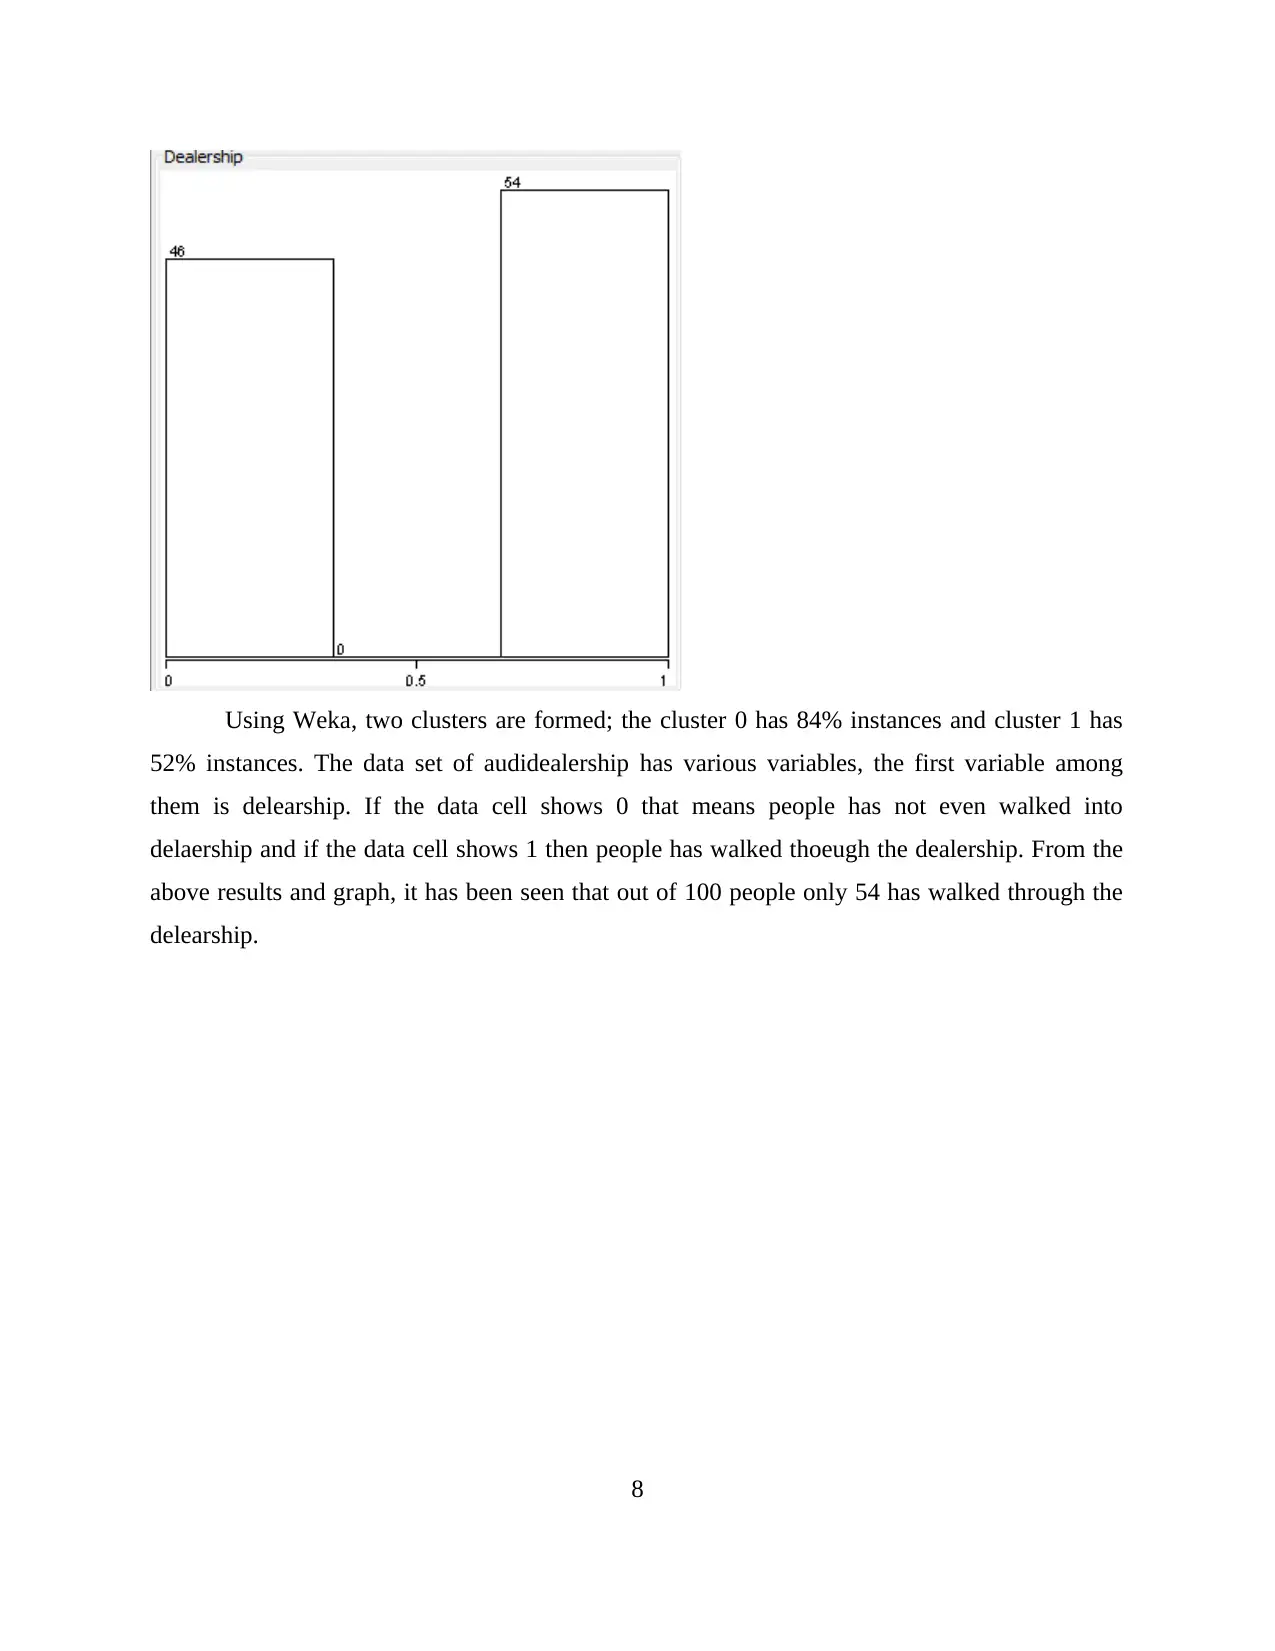
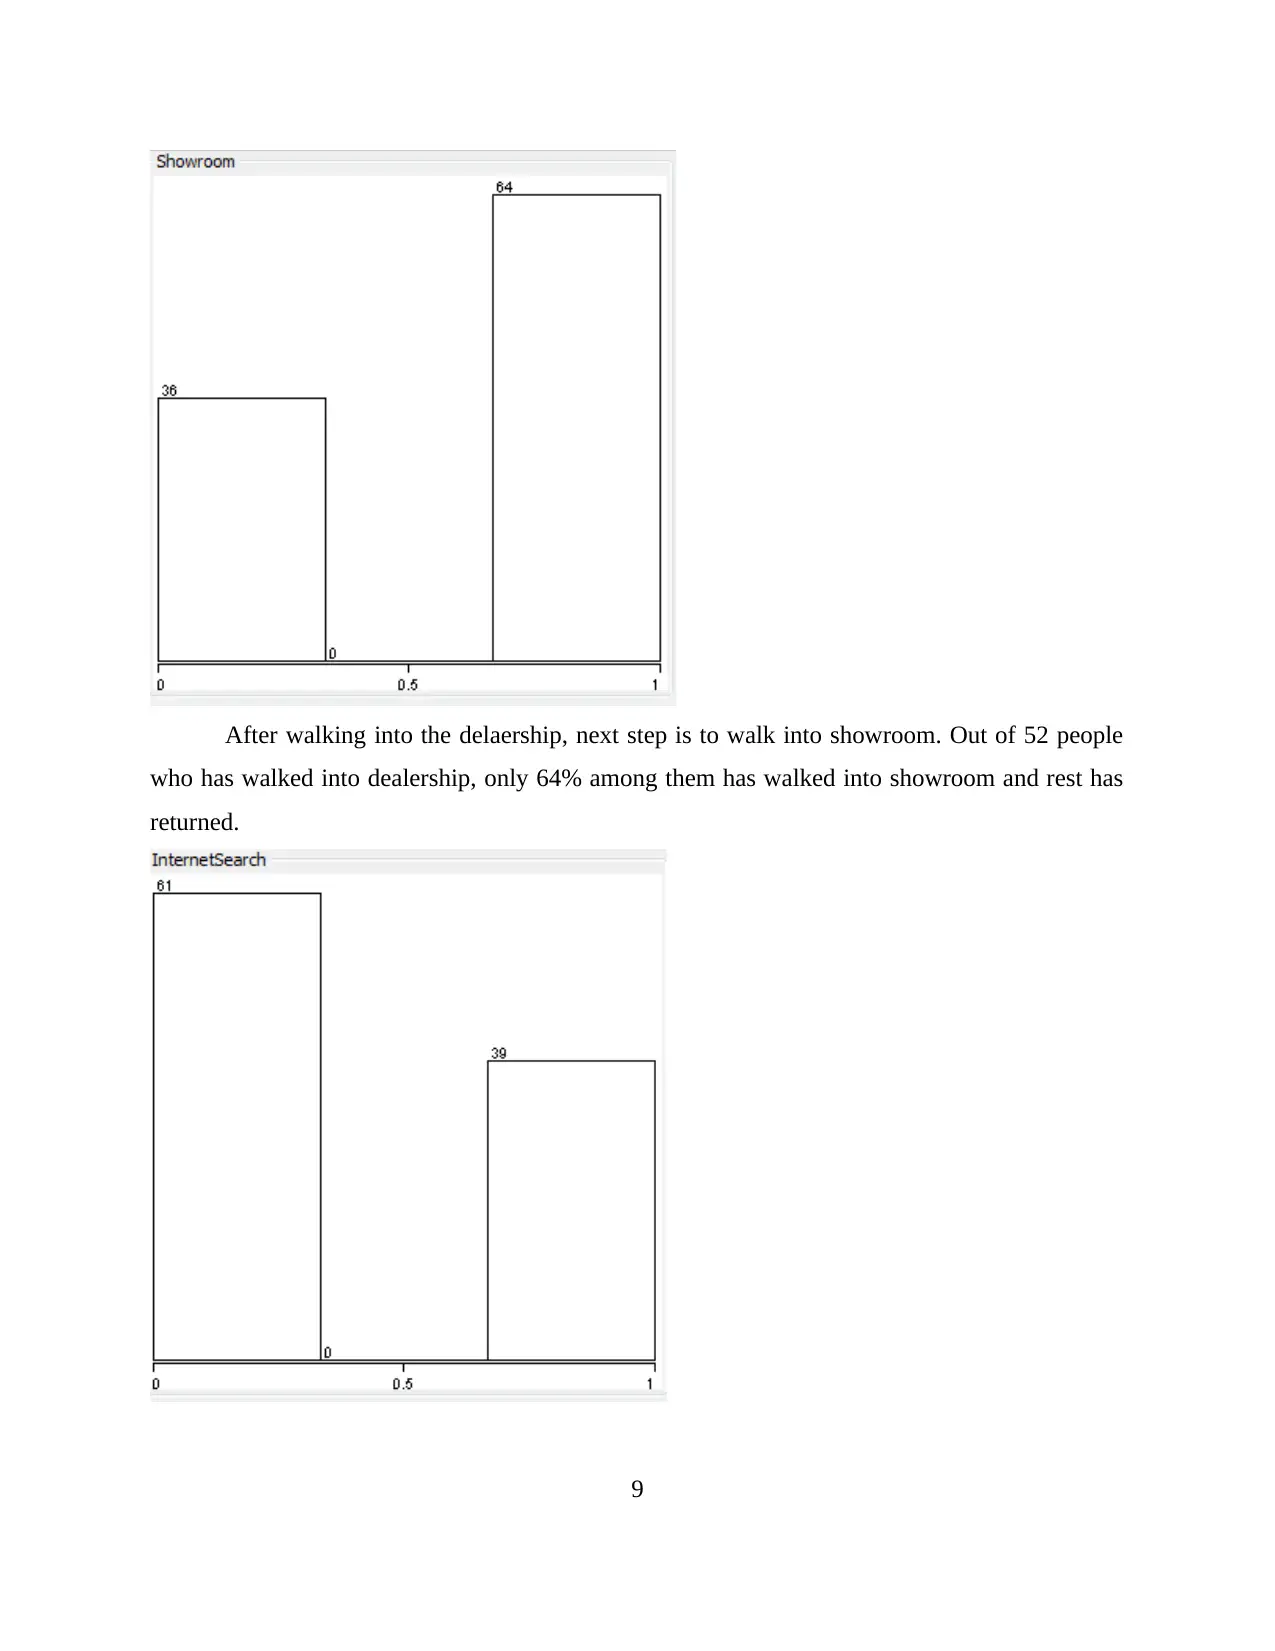
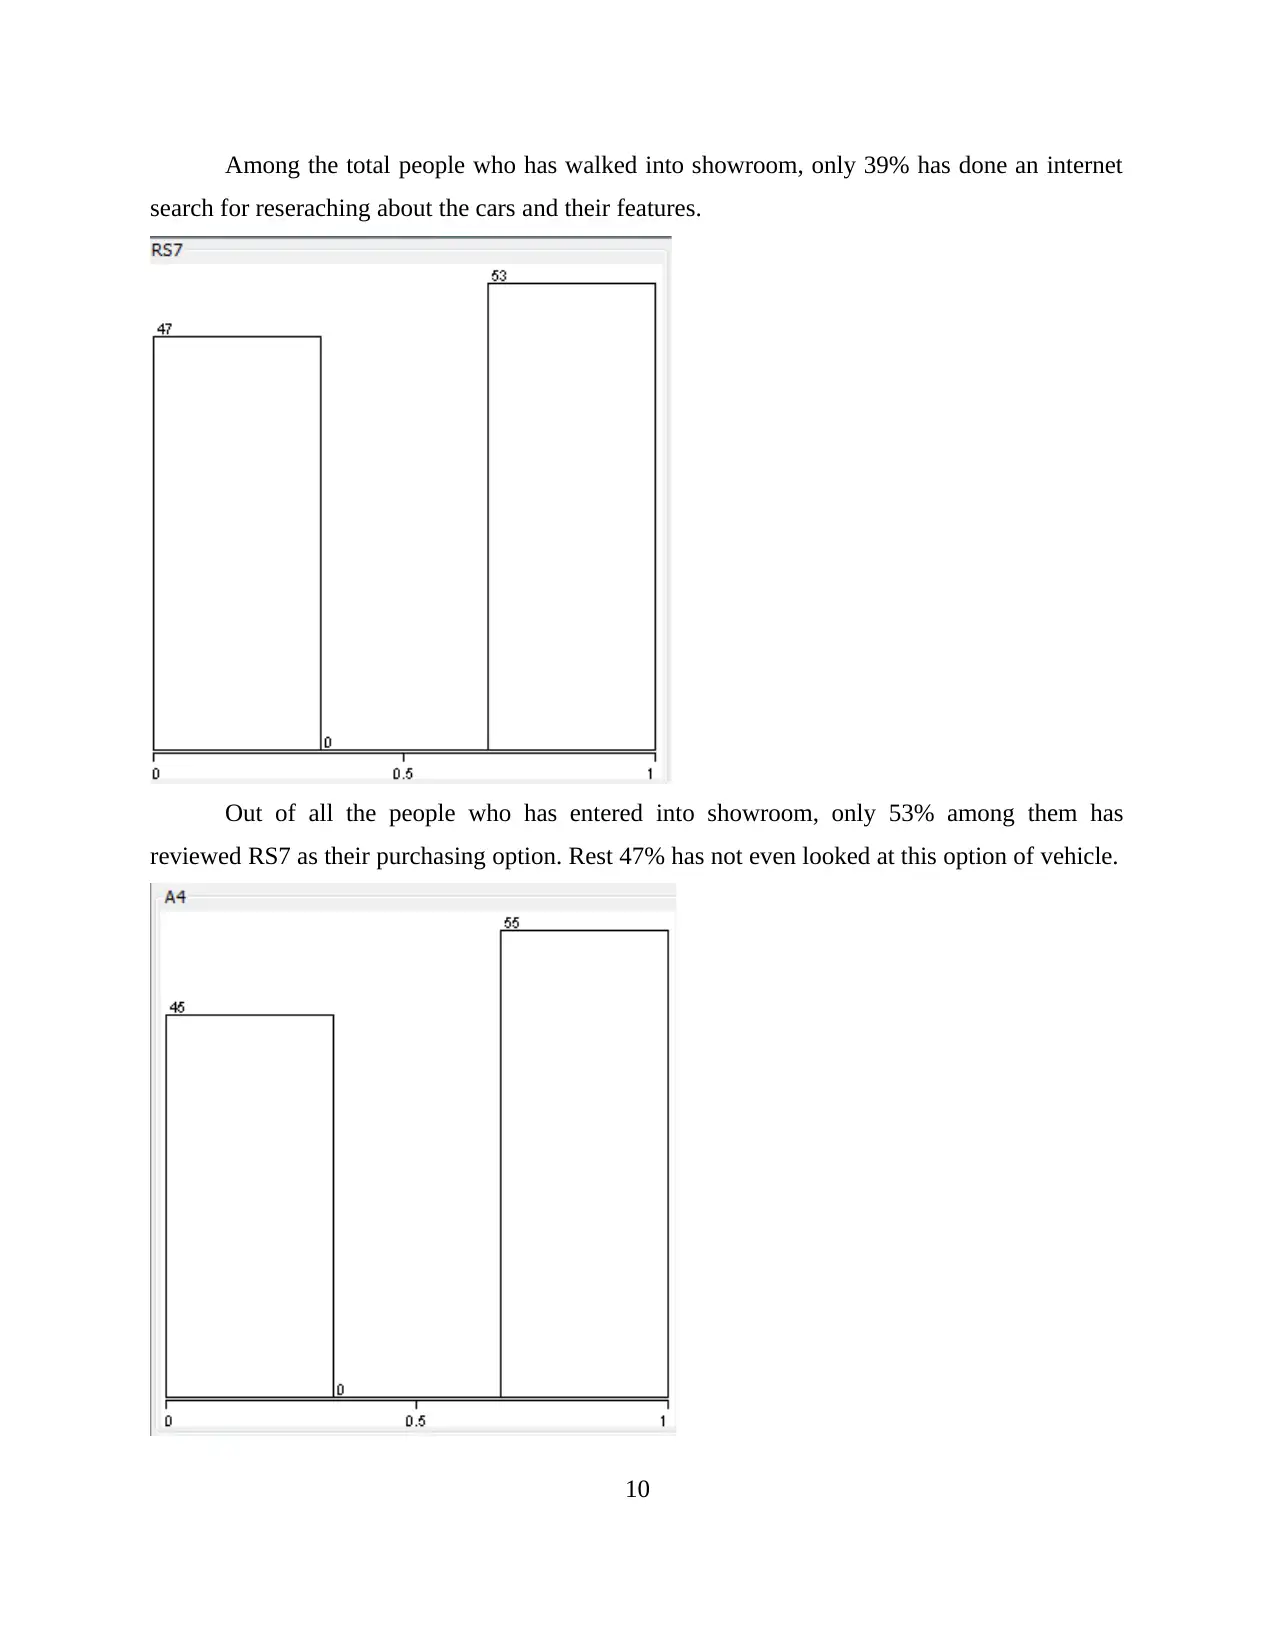
This report delves into data handling, data warehousing, and data mining techniques. It begins by evaluating the use of Microsoft Excel for analyzing the 'Superstore' dataset, covering data preprocessing, analysis, and visualization using pivot tables, charts, and graphs to identify trends in sales and profit. The report then explores the workings of Weka for clustering using the 'audidealership' dataset, specifically employing k-means clustering to understand customer behavior. Common data mining methods are explained, and a comparison of the advantages and disadvantages of Weka over Excel is provided. The analysis reveals insights into the decline in sales and profits of Superstore, highlighting the impact of discounts, unit prices, shipping costs, and order quantity. The Weka analysis of the audidealership data provides insights into customer interactions, from dealership visits to final purchases, helping to identify areas for improvement in customer engagement and sales strategies.
tabler-icon-diamond-filled.svg

Contribute Materials

Your contribution can guide someone’s learning journey. Share your documents today.
Document Page
Data handling
tabler-icon-diamond-filled.svg

Secure Best Marks with AI Grader

Need help grading? Try our AI Grader for instant feedback on your assignments.
Document Page
Contents
INTRODUCTION...........................................................................................................................1
Part 1................................................................................................................................................1
Evaluating the use of Excel by using the Superstore data...........................................................1
Part 2................................................................................................................................................5
Workings of Weka Clustering.....................................................................................................5
Explaining the most common data mining methods..................................................................13
Discussing the advantages/disadvantages of Weka over Excel.................................................13
CONCLUSION..............................................................................................................................13
REFERENCES..............................................................................................................................14
Document Page
INTRODUCTION
The concept of data handling is related with processing, analysing and then presenting the
data so that numerical information can be understood by everyone. This concept is more like a
process in which the pre recorded data is analysed using certain tools and techniques so that
meaningful insights can be gained from that data(Shmueli, Patel and Bruce, 2011). The main aim
of this report is to evaluate the current trends in data warehousing along with building an
understanding regarding principles of predictive analytic software. For this purpose, two data
sets are used in this report which is “Superstore’ and “audidealership”.
In this report, the first data set is used to pre process, analyse and then visualise the data
using analytical software of Microsoft Excel. This process is done by using Excel functions of
Pivot tables, charts and graphs. Using the second dataset of “audidealership”, clustering is done
using analytic software of Weka. Various data mining methods are also analysed along with
evaluation of merits and demerits of Weka over Excel.
Part 1
Evaluating the use of Excel by using the Superstore data
Current trends in data warehousing, business intelligence and data mining
Data warehousing the process of storing the data into warehouses where the security of
the data can be ensured. The aim behind this concept is to combine all the data collected from
different sources in one place so that it can easily be analysed for the purpose of gaining data
insights and decision making (IşıK, Jones and Sidorova, 2013). There are various current trends
in the field of data warehousing which are database management system, agile development
methodologies, data streaming and consolidation with business intelligence organisations. It is
difficult for organisations to manage and store their data due to which they hire firms which are
specialised in BI.
In the field of business intelligence, current trends which are shaping the future are usage
of models such as SaaS and SOA. Also the software of Web 2.0 based visualisation is a current
trend in BI.
Data mining is different from the concept of data warehousing. In this concept, data is
extracted from different sources and then organised for better usage (Minelli, Chambers and
1
Document Page
Dhiraj, 2013). This concept is based on complex algorithms due to which, it requires specialised
skills to mine a data. Current trends in the field of data mining are sequential and time series
mining in which data of cyclical and seasonal trends can be mined.
Pre processing the data
Superstore is an organisation which is facing the decline in their sales and profit over the
years. In order to determine the reason behind this decline, the data of Superstore is used. The
first step of evaluation is the pre processing the data.
Data pre processing allows cleaning and transforming the data in such a way that it can
be used for effective analysis and visualisation. For the data provided, the information is first
cleaned using identifying the missing values. In Microsoft Excel application, all the data is
selected and then empty cells are navigated. The Excel function which applied is “Shift key +
F4”. From this process, it has been identified that there are various missing values in the column
of “product base margin”. Once the missing the values are identified, these cells are filled with
their column average (Talati, McRobbie and Watt, 2012).
The next stage of data pre processing is data transformation. In this the data will be
transformed into normal. For this all the numerical values (sales, discount, profit, unit price,
shipping cost and product base margin) in data set are formatted to two decimal points.
The third and last stage of data pre processing is data reduction. The data of superstore
worksheet is reduced in another worksheet by the way of Pivot table. In this table only those
variables are selected which can impact the superstore’s sales and profit. These variables are
order date, Sum of Sales, Sum of Discount, Sum of Profit, Sum of Unit Price, Sum of Shipping
Cost, sum of Product Base Margin, individual order priority, shipment mode, region, customer
segment, product category and lastly product container.
Analysing and visualising the data
Sum of
Profit
Sum of
Sales
Sum of
Discount
Sum of
Shipping Cost
Sum of
Unit Price
Sum of Order
Quantity
2009 434096 4209897 105.39 28481.8 232831 54508
2010 364917 3560087 105.81 27354.3 162468 54379
2011 380311 3429945 101.67 24939.9 159653 51413
2012 342444 3715672 104.32 27055.2 195468 54480
2
tabler-icon-diamond-filled.svg

Secure Best Marks with AI Grader

Need help grading? Try our AI Grader for instant feedback on your assignments.
Document Page
Analysing a data is a complex procedure which includes tools such a descriptive statistics
and data analysis. First sum of all the sales and profit are calculated using sum function of Excel
which is then presented in a graph below:
The above graph is evidence that sales and profit of Superstore are declining. As it can be
seen in above graph that blue and red line are declining at every point of the year. In order to
analyse the reason behind this decline, sum of discount, unit price and order price is also
calculated. For each of these four variables, graphs are developed as follows:
The above graph of sum of disocunt shows the similar trend as sales as in both the cases
the value in 2011 is minimum which means due to lower disocunt allowed, the sales of
superstore are declining continously.
3
Document Page
Shipping costs is the another variable which is presenmting the similar pattern as sales as
in both the cases values are minimum in 2011 which implies due to low shipping costs incurred
by the company, their sales are declining.
Unit price is the value of a single product which is sold by an organisation. These unit
prices are analysed by using Sum function. It has been seen that due to decreasing unit prices of
products in 2011, the sales of this company are declining.
4
Document Page
The above variable is sum of order quantity which is also a reason of declining sales of
superstore.
None of the variables presents the similar pattern as profit of superstore due to which data
analysis technique of correlation is used which is considered as more effective technique of
analysing the relationship between two variables. Relationship between profit (column 1), unit
price (column 2) and shipping costs (column 3) are analysed. The results of correlationship are
presented below:
Column 1 Column 2
Colum
n 3
Column 1 1
Column 2 -0.00885 1
Column 3 -0.02136
0.23995937
5 1
From the above analysis, it has been analysed that column 1 and 2 that is profit and price
has a significant relationship with each other but this relationship is negative which means with
decreasing unit price of a product, the overall profit of the company increases. Column 1 and 3
which are profit and shipping costs also a negative significant relationship with each other which
states with the increasing shipping costs of the company, their profit decreases.
Conclusion on determining the decline in sales/profits over the years
The analysis and visualisation which have done above shows those sales of the superstore
are declining due to sum of discount, unit price, shipping cost and order quantity. The reason due
to which profit of this company is decreasing is shipping costs. Due to increasing shipping costs
of this company, the profit of this company is declining.
Part 2
2.1 Workings of Weka Clustering
Weka is a statistical program which helps in running the algorithms. WEKA is known as
Waikato Environment for Knowledge Analysis that helps an investigator to mine the data which
is pre recorded. This application allows to analyse present data set in such a way that it can
provide additional information and assits in decision making (Sharda and et.al., 2014).
Weka is analytical software which helps in pre processing and analysing the data. For the
data set of “audidealership”, this software is used to perform clusters (Zheng, Fader and
5
tabler-icon-diamond-filled.svg

Paraphrase This Document

Need a fresh take? Get an instant paraphrase of this document with our AI Paraphraser
Document Page
Padmanabhan, 2012). The method of clustering which has been used is k means clustering and
number of groups is selected as 2 which are “0 cluster” and “1 cluster”.
=== Run information ===
Scheme:weka.clusterers.SimpleKMeans -N 2 -A "weka.core.EuclideanDistance -R first-last" -
I 500 -S 10
Relation: audidealership2
Instances: 100
Attributes: 8
Dealership
Showroom
InternetSearch
RS7
A4
TT
Financing
Purchase
Test mode:evaluate on training data
=== Model and evaluation on training set ===
kMeans
======
Number of iterations: 6
Within cluster sum of squared errors: 160.2980769230769
Missing values globally replaced with mean/mode
Cluster centroids:
6
Document Page
Cluster#
Attribute Full Data 0 1
(100) (48) (52)
=================================================
Dealership 0.54 0.3333 0.7308
Showroom 0.64 0.6667 0.6154
InternetSearch 0.39 0.4375 0.3462
RS7 0.53 0.2917 0.75
A4 0.55 0.8125 0.3077
TT 0.5 0.5833 0.4231
Financing 0.6 0.3333 0.8462
Purchase 0.38 0.0417 0.6923
Time taken to build model (full training data) : 0.02 seconds
=== Model and evaluation on training set ===
Clustered Instances
0 48 ( 48%)
1 52 ( 52%)
7
Document Page
Using Weka, two clusters are formed; the cluster 0 has 84% instances and cluster 1 has
52% instances. The data set of audidealership has various variables, the first variable among
them is delearship. If the data cell shows 0 that means people has not even walked into
delaership and if the data cell shows 1 then people has walked thoeugh the dealership. From the
above results and graph, it has been seen that out of 100 people only 54 has walked through the
delearship.
8
tabler-icon-diamond-filled.svg

Secure Best Marks with AI Grader

Need help grading? Try our AI Grader for instant feedback on your assignments.
Document Page
After walking into the delaership, next step is to walk into showroom. Out of 52 people
who has walked into dealership, only 64% among them has walked into showroom and rest has
returned.
9
Document Page
Among the total people who has walked into showroom, only 39% has done an internet
search for reseraching about the cars and their features.
Out of all the people who has entered into showroom, only 53% among them has
reviewed RS7 as their purchasing option. Rest 47% has not even looked at this option of vehicle.
10
Document Page
Among the people in the showroom, 55% has looked at A4 car option which means
people are seen to be more intersted nin A4 option then RS7 option. This insight provides a
opportunity to atract people towrads A4 even more so that their sales can be hiked.
When it comes to TT option, half of the viistors of showroom has looked over TT and
half of viistors has not even bothered to look over TT option. This provides an insight that people
are more attracted towards A4 and RS7 option which provides opportunity to highlight TT car in
the showroom so that people can take interest in this option as well.
11
tabler-icon-diamond-filled.svg

Paraphrase This Document

Need a fresh take? Get an instant paraphrase of this document with our AI Paraphraser
Document Page
Out of all the people in showroom, only 60% has walked towards the finnacing counter
and inquired about the financing options. From the total of 100 people only 35 managed to
walked into showroom and 60% of 35 is 21 which means only 21 people has enquired about the
financing option.
12
Document Page
Out of 35 people who were in showroom, only 38% finally purchased the car. 38% of 35 is 13
people.
To summarise the results, it can be said that from the above Weka results are graphs, it
has been analysed that 54 among 100 people walked through the dealership. At the next stage
64% of the people walked through the entire showroom to explore their options. Only 39%
people who have walked into showroom search in internet and lastly only 38% of people finally
buy the product.
2.2 Explaining the most common data mining methods that can be used in businesses.
Data mining is a process of looking over a pool of information and a large banks of data
to generate a new information from it. In other words data mining is basically searching for a
new information and knowledge form the existing data available with the organisation. Data
mining is a practice of examining large School of pre determine and pre existing database for
generating and collecting new information (Wani and Jabin, 2018).
Data mining is one of the most effective method and there are several methods of it,
therefore here are some of the most common forms of data mining are determined and explained
underneath:
Anomaly Detection- This is a data mining method which can be used for identifying and
mining when something and some information is noticeably different from other regular
patterns. That means anomaly detection is a type of data mining process which allows the
individuals to determine those patterns and information which are very different from the
existing database or other regular patterns. For example anomaly detection is very useful
for monitoring gas turbines and it is used for looking over that the turbines are
functioning properly or not. Censored monitoring of the temperature and pressure of
turbines are set up to see if any anomalous activity is observed overtime or not
(Bordeleau, Mosconi and Santa-Eulalia, 2018).
Association learning- This learning is associated with market based analysis which is
used for analyzing which things and to occur together either in pair or large groups. Other
words association learning enable organizations to analyze the market trends which helps
them to identify that which goods are of complementary nature and who are of substitute
nature. for instance Walmart will review purchase people make at the cashier and see the
13
Document Page
people who are purchasing milk are also purchasing bread and eggs or not. Association
learning goes beyond simple correlation as it is very helpful and extends beyond pairs
helping the organisation for larger grouping of the data and developing larger accounts of
items.
Cluster detection- The identifying and recognizing the distinct group or sub-groups
within a database and information is known as cluster detection. Mechanical learning
algorithms enables the organisation to detect significantly different subgroups within a
particular database. In other words cluster detection uses data and large pool of database
to divide them into smaller clusters according to their characteristics and based on the
similarities. For instance cluster detection wood be very beneficial and effective in
analyzing the buying behaviour of hobbyists. That is according to their hobbies there
references their professions and more importantly based on their needs. Therefore it is
said that in cluster detection all the data is being sorted out and divided into smaller
groups and clusters according to the similarities and nature.
Classification- This data mining process is different from cluster detection as in
classification the data is already being divided into subheads and they already have
particular labels (Ogudo and Nestor, 2018). As it is known that data mining can involve
algorithms to detect systematic differences between items in pre-determined categories
and moving forward the addition of new cases within the similar categories can be
created in an existing structure. Classification method of data mining is also known for
training data as this information which is already existing can help in training and
providing examples to people as there properly classified within an algorithm.
Regression- This is the last most commonly used data mining method which’s more
prominent and used by individuals and organizations for making predictions which are
entirely based on the relationships within the data. In simple words regression method of
data mining is beneficial in in making predictions by looking over the relationship and
interlinking of the data from the different data sets. For example Facebook uses this data
mining process in predicting the future engagement of the individual or the user
according to the users history where they get the information about all the likes tags and
comments of the users with other users friend request and all the other activity in which
the user is being involved on the site.
14
tabler-icon-diamond-filled.svg

Secure Best Marks with AI Grader

Need help grading? Try our AI Grader for instant feedback on your assignments.
Document Page
2.3 Discussing the advantages and disadvantages of Weka over Excel.
Weka is basically a connection and integration of machine learning origin for data mining
activities and tasks (Szárnyas and et. al., 2018). Weka includes machine learning, data mining,
preprocessing, classification, regression, clustering, association rules, attribute selection,
experiments, workflow and visualization. It is written in Java and developed at the University of
Waikato in New Zealand. Weka techniques are predicted on the assumptions that data which is
present is in a single flat file or relation. Weka provide access to SQL database using Java
database connectivity and can process the results return by database but it is not capable of multi
relation data mining.
Advantages of Weka over Excel:
The first and foremost to advantage of Weka over Excel is it is a software of data mining
that is it allows the individuals and organizations in sorting and understanding the
existing data base so that new information and knowledge can be extracted out of it. On
the other hand Excel is a software which is developed by Microsoft that uses red cheats to
organize the numbers and data with formulas and functions. That means Excel helps in
organizing the existing data in a correct format is managed by using tables and formulas
but Weka allows the company to explore all different types of data and provide them new
information. Actually Excel deals in numbers and only useful when the data is available
in number form (Schuster and et. al., 2018).
Another very beneficial advantage of Weka is it is available free of cost under GNDU
that is General Public License and it is very easily understandable by all individuals
because of its superior graphical user interfaces. On the other hand Excel is very
complicated and needs experts advice for learning it and all the different functions which
it renders.
Disadvantages of Weka over Excel:
The only disadvantage which is associated with Weka over Excel is it is inefficient or
incapable of handling large data bases and only effective and work potentially on small
data sets. Whenever a set of information is bigger than a few megabytes it shows errors
such as out of memory error. Excel is very progressive and provides individuals the
ability to handle all large data bases without any difficulties and problems.
15
Document Page
CONCLUSION
From the above report, it has been analysed that for every business, mining and warehousing
the data is important for which analytical software can be used. By using two software
applications, it has been concluded that Weka software is better for quick analysis but Microsoft
Excel is better for multiple functions. The above report summarises the whole business
intelligence and data handling procedure into 3 steps which pre processing the data, analyse the
data and visualise the data.
16
Document Page
REFERENCES
Books and Journals
Shmueli, G., Patel, N.R. and Bruce, P.C., 2011. Data mining for business intelligence: Concepts,
techniques, and applications in Microsoft Office Excel with XLMiner. John Wiley and
Sons.
IşıK, Ö., Jones, M.C. and Sidorova, A., 2013. Business intelligence success: The roles of BI
capabilities and decision environments. Information & management. 50(1). pp.13-23.
Minelli, M., Chambers, M. and Dhiraj, A., 2013. Big data, big analytics: emerging business
intelligence and analytic trends for today's businesses (Vol. 578). John Wiley & Sons.
Talati, S., McRobbie, G. and Watt, K., 2012, June. Developing business intelligence for Small
and Medium Sized Enterprises using mobile technology. In International Conference on
Information Society (i-Society 2012) (pp. 164-167). IEEE.
Sharda, R., and et.al., 2014. Business intelligence and analytics. System for Decesion Support.
Zheng, Z., Fader, P. and Padmanabhan, B., 2012. From business intelligence to competitive
intelligence: Inferring competitive measures using augmented site-centric
data. Information Systems Research. 23(3-part-1), pp.698-720.
Bordeleau, F. E., Mosconi, E. and Santa-Eulalia, L. A., 2018, January. Business Intelligence in
Industry 4.0: State of the art and research opportunities. In Proceedings of the 51st
Hawaii International Conference on System Sciences.
Ogudo, K. A. and Nestor, D. M. J., 2018, August. Modeling of an efficient low cost, tree based
data service quality management for mobile operators using in-memory big data
processing and business intelligence use cases. In 2018 International Conference on
Advances in Big Data, Computing and Data Communication Systems (icABCD) (pp. 1-
8). IEEE.
Schuster, J. and et. al., Workday Inc, 2018. Systems and methods for interest-driven business
intelligence systems including event-oriented data. U.S. Patent 9,892,178.
Szárnyas, G. and et. al., 2018, June. An early look at the LDBC Social Network Benchmark's
Business Intelligence workload. In Proceedings of the 1st ACM SIGMOD Joint
International Workshop on Graph Data Management Experiences & Systems
(GRADES) and Network Data Analytics (NDA) (pp. 1-11).
Wani, M. A. and Jabin, S., 2018. Big data: issues, challenges, and techniques in business
intelligence. In Big data analytics (pp. 613-628). Springer, Singapore.
Online:
5 data mining methods. 2018. Available Through: < https://universe.byu.edu/2018/03/27/data-
mining-sidebar/>
17
chevron_up_icon
1 out of 19
circle_padding
hide_on_mobile
zoom_out_icon
logo.png

Your All-in-One AI-Powered Toolkit for Academic Success.

Available 24*7 on WhatsApp / Email

[object Object]