Data Analysis Report: RapidMiner Data Exploration and Model Building

Verified

Added on  2022/10/09

|8
|888
|14
Report
AI Summary
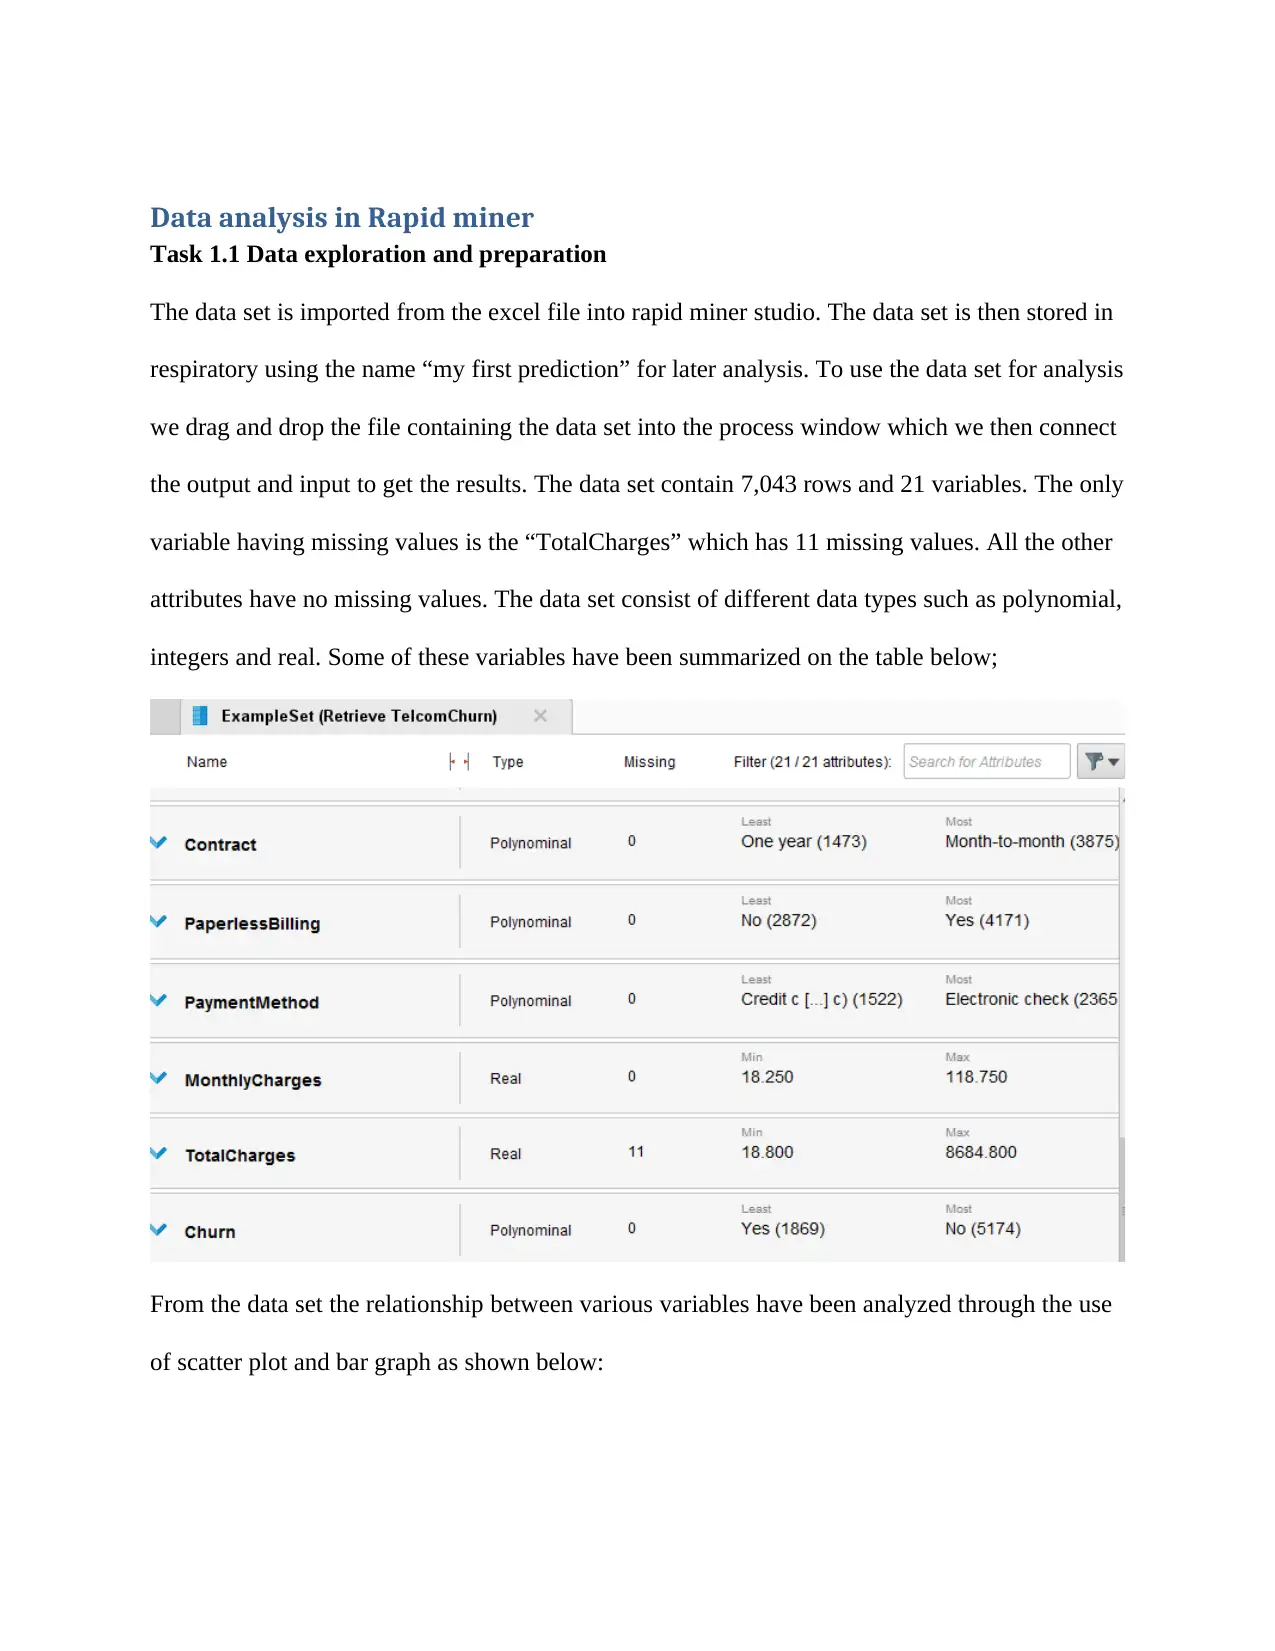
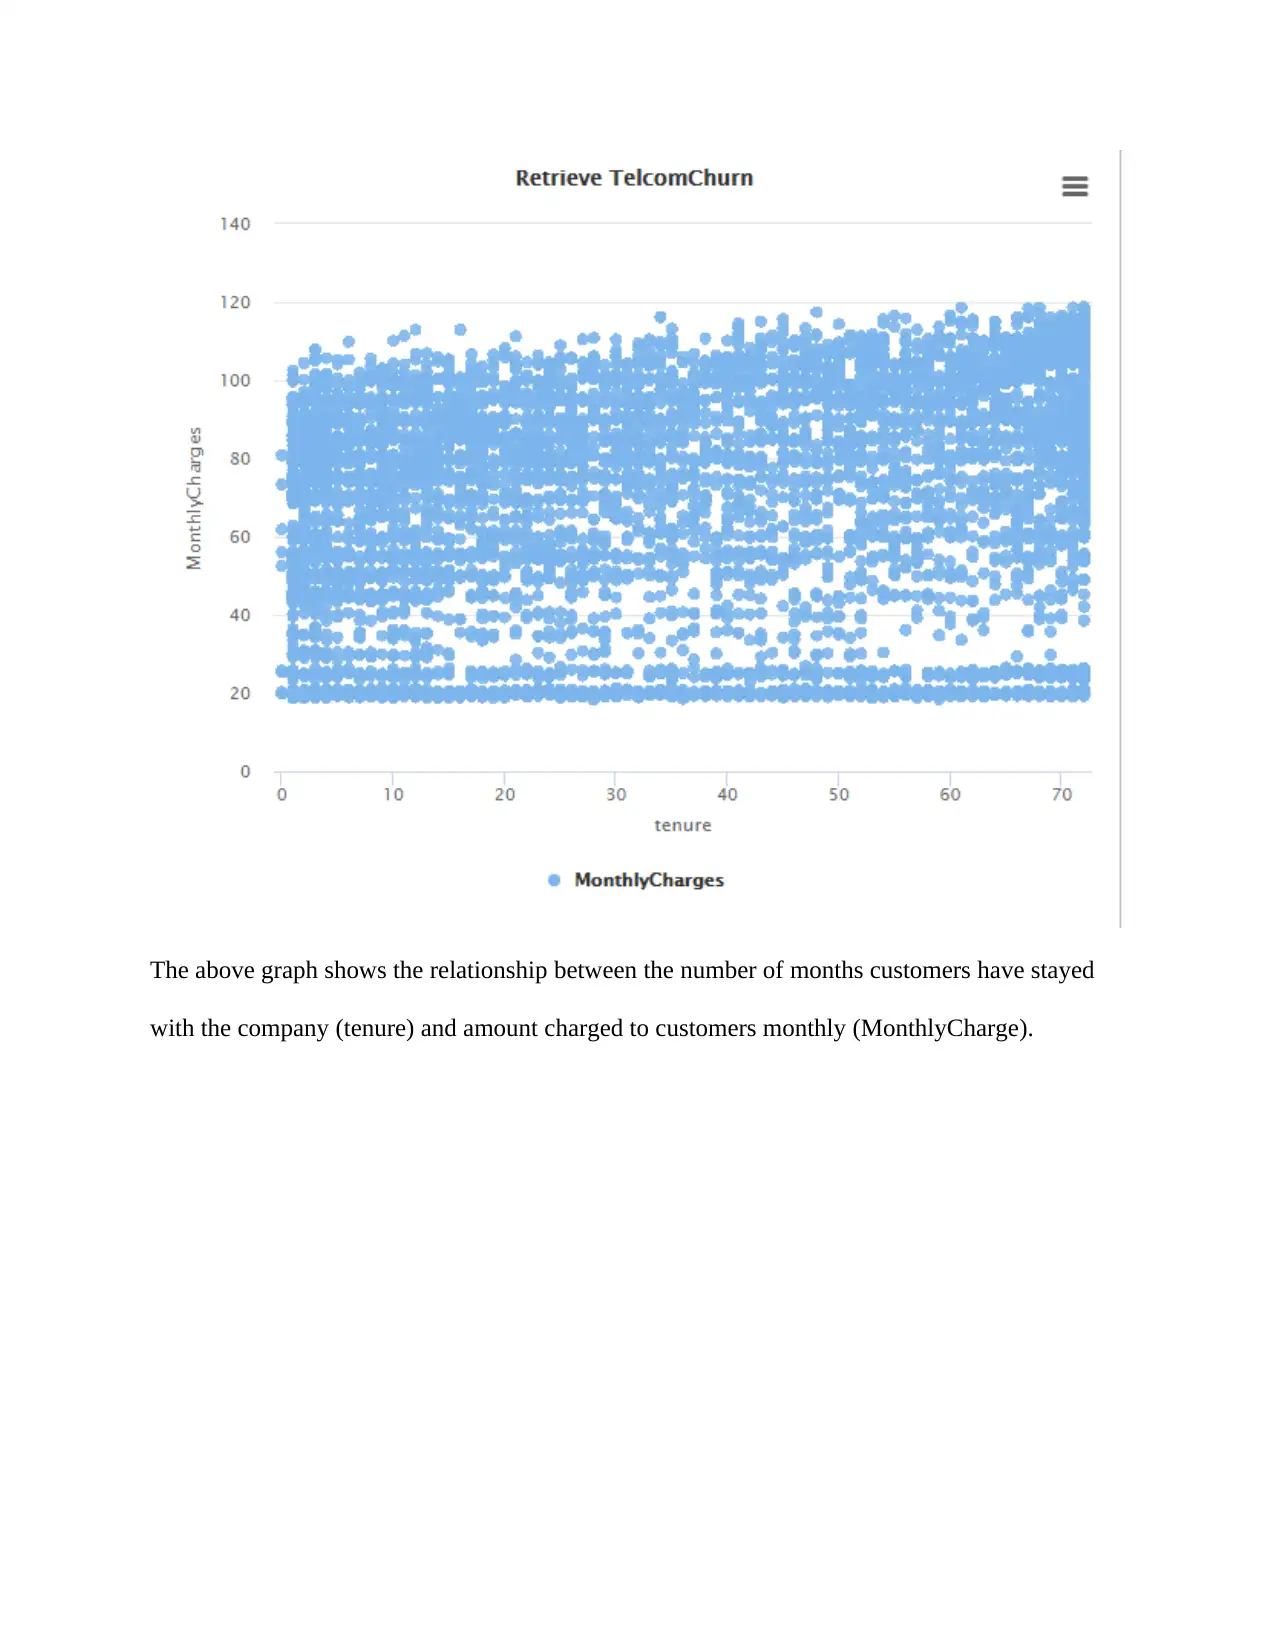
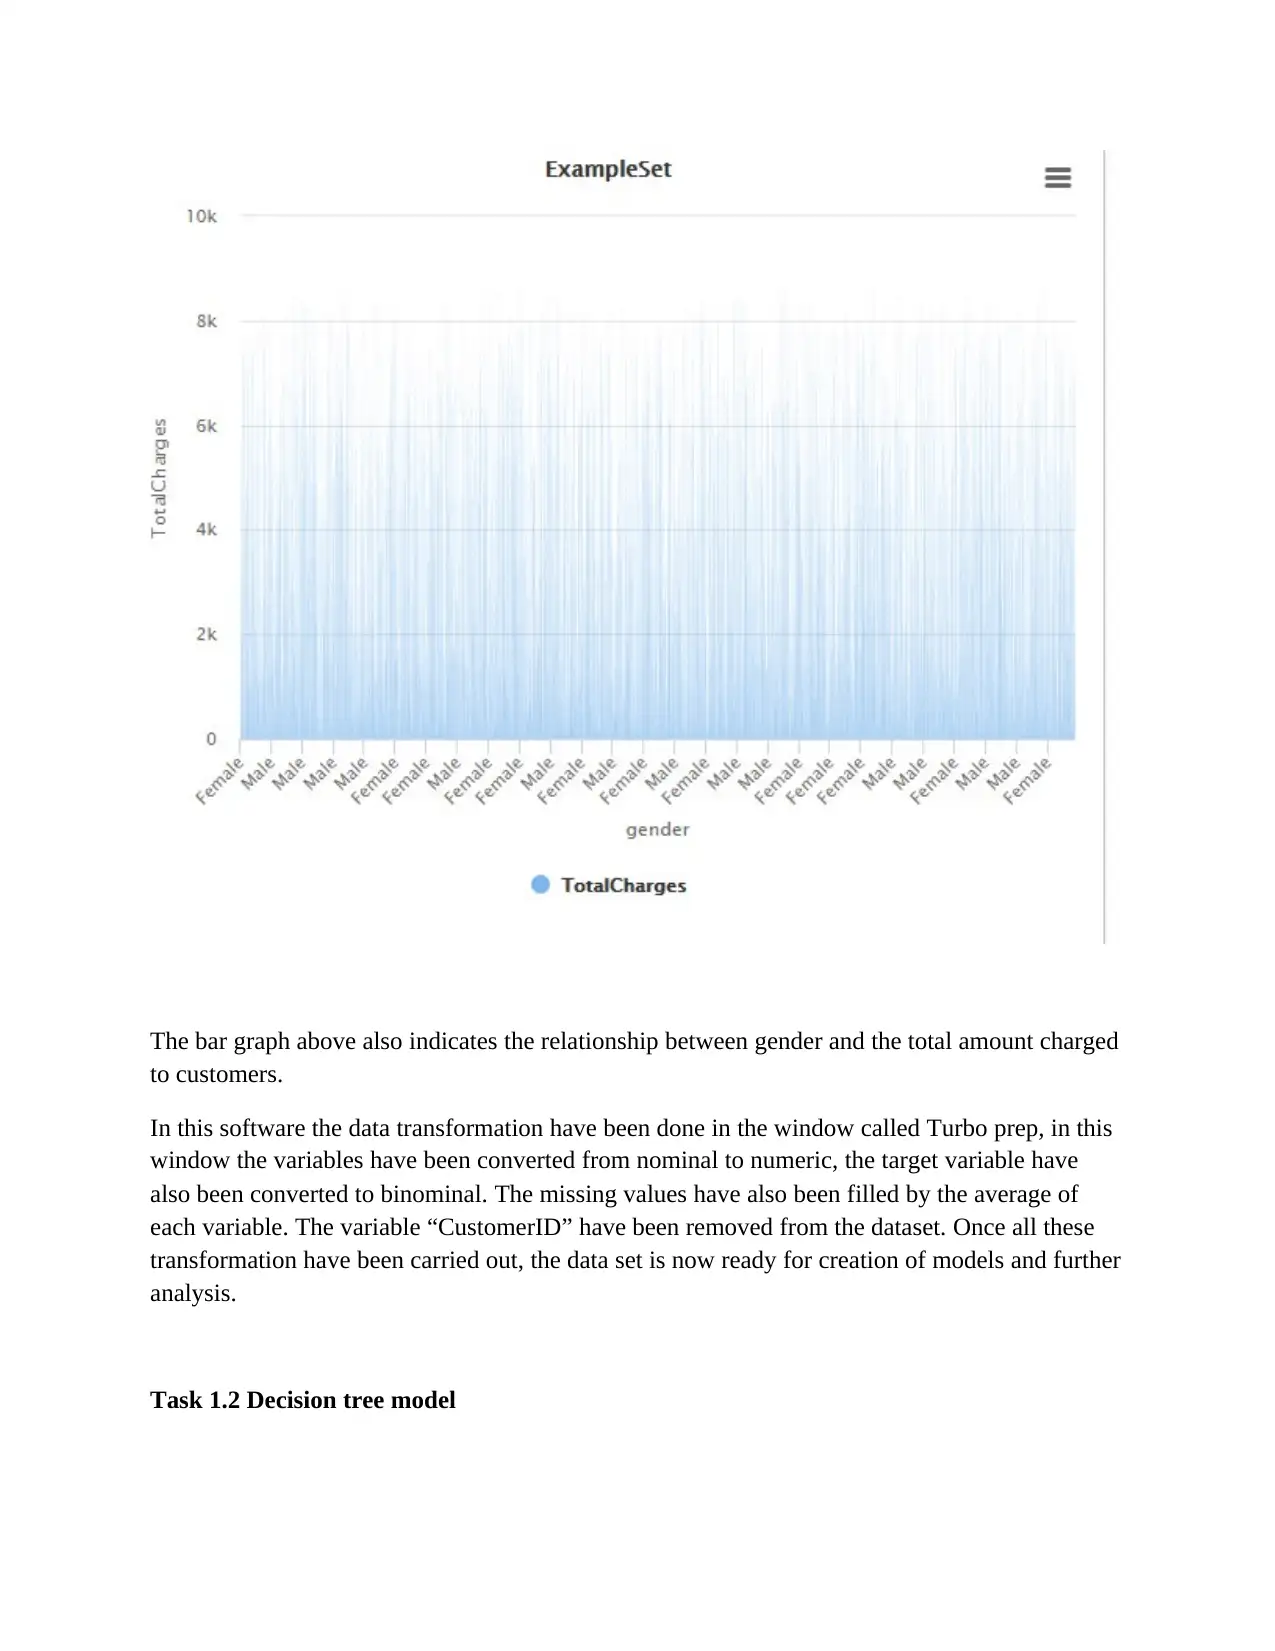
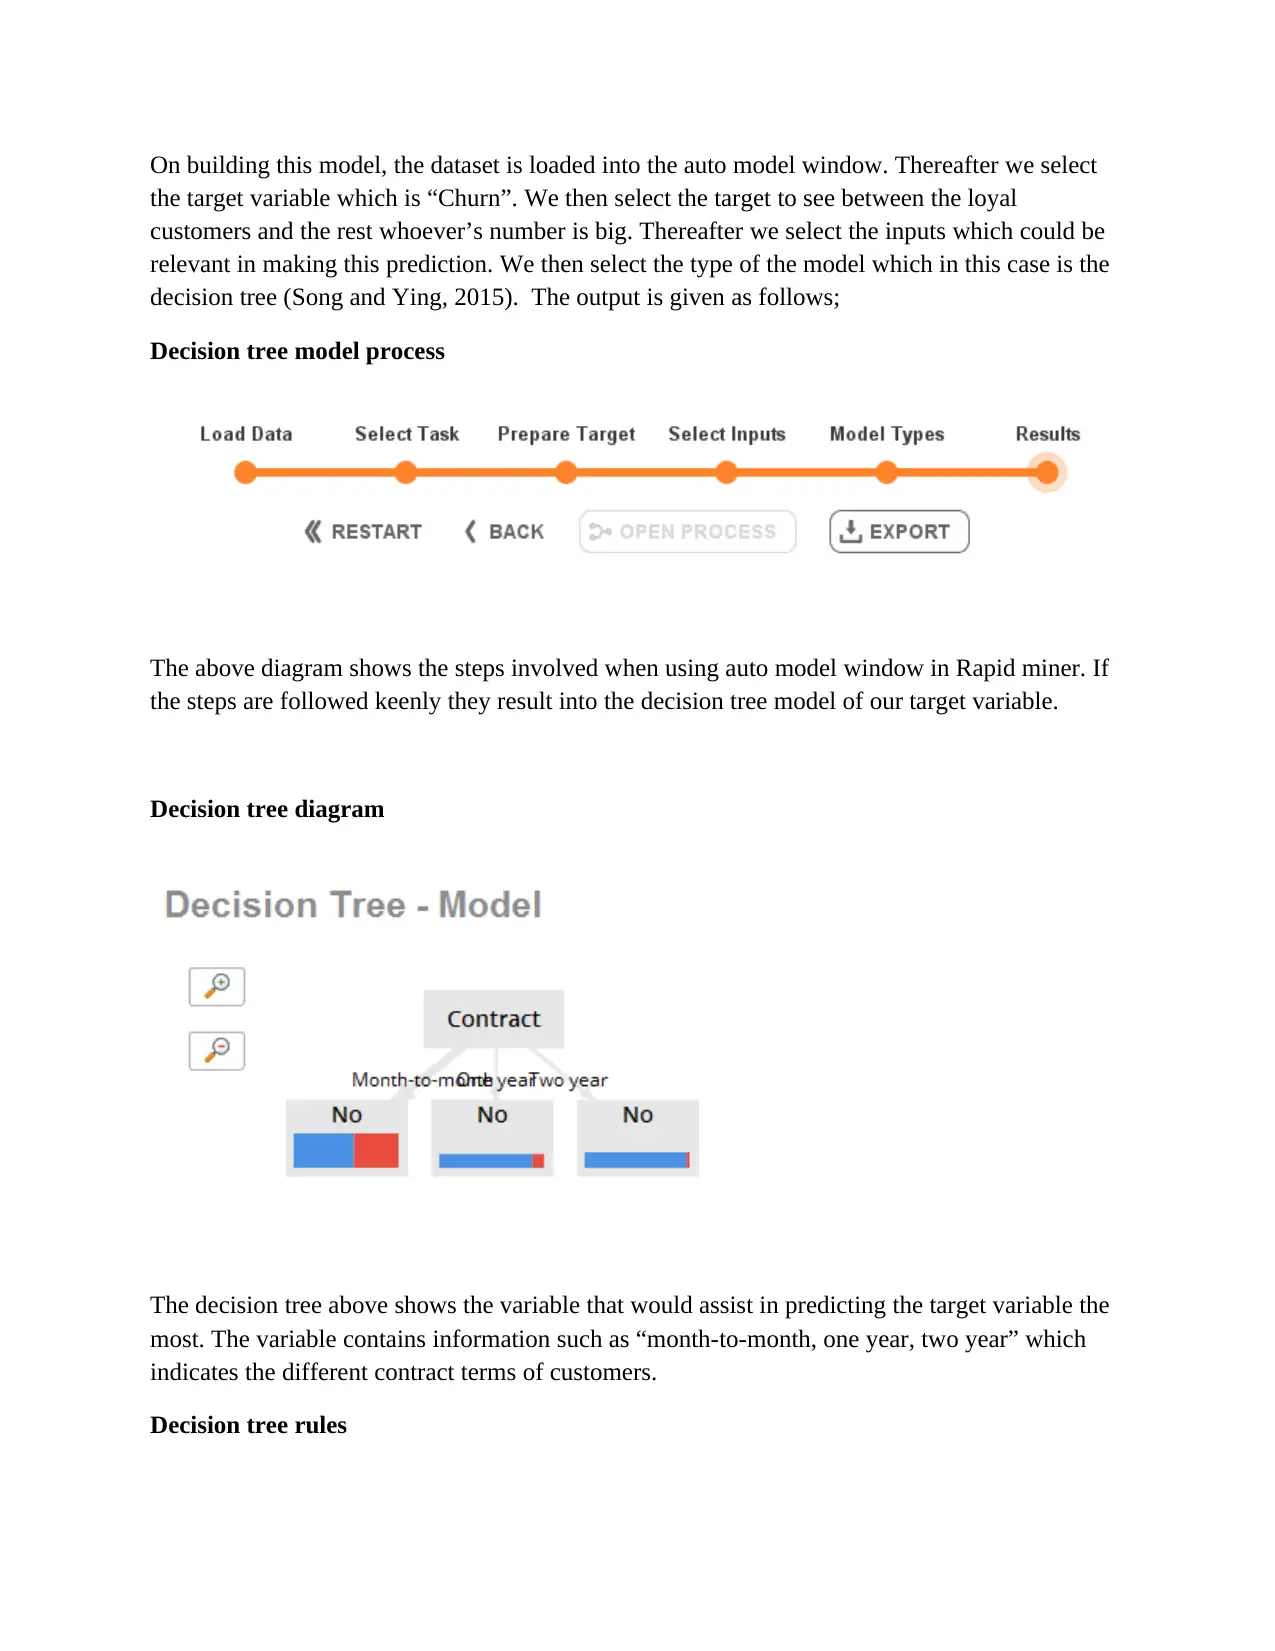
This report presents a comprehensive data analysis project using RapidMiner, focusing on data exploration, preparation, and predictive modeling. The analysis begins with importing and exploring a dataset containing 7,043 rows and 21 variables, identifying and addressing missing values in the 'TotalCharges' variable. Data transformation techniques, including converting variables to numeric types and filling missing values, are applied to prepare the data for model building. The project then constructs and evaluates two predictive models: a decision tree model and a logistic regression model, using the 'Churn' variable as the target. The report details the steps involved in building each model, including variable selection and model output. The results of both models are compared, with the logistic regression model demonstrating higher accuracy. The report also includes references to relevant academic sources.
Document Page
Data analysis in Rapid miner
Task 1.1 Data exploration and preparation
The data set is imported from the excel file into rapid miner studio. The data set is then stored in
respiratory using the name “my first prediction” for later analysis. To use the data set for analysis
we drag and drop the file containing the data set into the process window which we then connect
the output and input to get the results. The data set contain 7,043 rows and 21 variables. The only
variable having missing values is the “TotalCharges” which has 11 missing values. All the other
attributes have no missing values. The data set consist of different data types such as polynomial,
integers and real. Some of these variables have been summarized on the table below;
From the data set the relationship between various variables have been analyzed through the use
of scatter plot and bar graph as shown below:
tabler-icon-diamond-filled.svg

Secure Best Marks with AI Grader

Need help grading? Try our AI Grader for instant feedback on your assignments.
Document Page
The above graph shows the relationship between the number of months customers have stayed
with the company (tenure) and amount charged to customers monthly (MonthlyCharge).
Document Page
The bar graph above also indicates the relationship between gender and the total amount charged
to customers.
In this software the data transformation have been done in the window called Turbo prep, in this
window the variables have been converted from nominal to numeric, the target variable have
also been converted to binominal. The missing values have also been filled by the average of
each variable. The variable “CustomerID” have been removed from the dataset. Once all these
transformation have been carried out, the data set is now ready for creation of models and further
analysis.
Task 1.2 Decision tree model
Document Page
On building this model, the dataset is loaded into the auto model window. Thereafter we select
the target variable which is “Churn”. We then select the target to see between the loyal
customers and the rest whoever’s number is big. Thereafter we select the inputs which could be
relevant in making this prediction. We then select the type of the model which in this case is the
decision tree (Song and Ying, 2015). The output is given as follows;
Decision tree model process
The above diagram shows the steps involved when using auto model window in Rapid miner. If
the steps are followed keenly they result into the decision tree model of our target variable.
Decision tree diagram
The decision tree above shows the variable that would assist in predicting the target variable the
most. The variable contains information such as “month-to-month, one year, two year” which
indicates the different contract terms of customers.
Decision tree rules
tabler-icon-diamond-filled.svg

Secure Best Marks with AI Grader

Need help grading? Try our AI Grader for instant feedback on your assignments.
Document Page
Under this the decision tree is converted into rules using the tree to rule operator. This operator is
nested meaning that the decision tree can be placed inside it hence easy understanding.
Task 1.3 Logistic regression model
On building this model, the dataset is loaded into the auto model window. Thereafter we select
the target variable which is “Churn”. We then select the target to see between the loyal
customers and the rest whoever’s number is big. Thereafter we select the inputs which could be
relevant in making this prediction. We then select the type of the model which in this case is the
logistic regression (Rainey, 2016). The output is given as follows;
Logistic regression model process
The above diagram shows the steps involved when using auto model window in Rapid miner. If
the steps are followed keenly they result into the logistic regression model of our target variable.
Coefficients and odd ratios
The table above shows different attributes coefficient’s and odd’s ratios of the logistic regression
model. The variable with the highest coefficient is the “customer’s internet service provider
Document Page
using fiber optic. This variable further has a greater p-value than the statistical significance level
of 5%, hence not good for prediction of the target variable. Therefore any variable having a p-
value less than significance level of 5% can be used in predicting the target variable.
Task 1.4 Validations and performance
Document Page
The logistic regression is more accurate than decision tree this because of high accuaracy as
indicated on table above. Moreover the tables above for accuracy, sensitivity, specificity and f
measure of logistic regression is high showing that logistic regression is a better model for
prediction than decision tree. However when comparing the time taken to run them, we notice
that in decision tree it takes less time as compared to logistic regression.
tabler-icon-diamond-filled.svg

Paraphrase This Document

Need a fresh take? Get an instant paraphrase of this document with our AI Paraphraser
Document Page
References
Song, Y.Y. and Ying, L.U., 2015. Decision tree methods: applications for classification and
prediction. Shanghai archives of psychiatry, 27(2), p.130.
Rainey, C., 2016. Dealing with separation in logistic regression models. Political Analysis,
24(3), pp.339-355.
chevron_up_icon
1 out of 8
circle_padding
hide_on_mobile
zoom_out_icon
[object Object]