ICT110 Data Analysis Report: Road Fatalities in Australia (2010-2018)
VerifiedAdded on 2023/03/17
|12
|2212
|59
Report
AI Summary
This data analysis report examines road accident fatalities in Australian states and territories from 2010 to 2018. The report begins with an introduction outlining the purpose, limitations, scope, and methodology, which includes exploratory data analysis, clustering, and linear regression. The data setup involved cleaning and preparing the dataset from the Australian Road Death database. Exploratory analysis includes one-variable and two-variable analysis with visual representations such as boxplots and trend lines. Advanced analysis techniques like k-means clustering are used to group states based on fatalities and speed limits, and linear regression is employed to explore relationships between variables, such as posted speed limits and fatalities, and the impact of government interventions over time. The report concludes with key findings, such as the high incidence of accidents on weekends and in specific states, and the linear relationship between speed and fatalities. The report also reflects on the data sources and challenges encountered during the analysis.
Data analysis report of the Number of Fatalities in Road accidents occurring in Australian
States/Territory between 2010 and 2018
Data analysis report of the Number of Fatalities in Road accidents
occurring in Australian States/Territory between 2010 and 2018
Prepared by
Firstname Lastname
University
Date
Word count: 1434
Referencing style: Harvard
Table of Contents
pg. 0
States/Territory between 2010 and 2018
Data analysis report of the Number of Fatalities in Road accidents
occurring in Australian States/Territory between 2010 and 2018
Prepared by
Firstname Lastname
University
Date
Word count: 1434
Referencing style: Harvard
Table of Contents
pg. 0
Paraphrase This Document
Need a fresh take? Get an instant paraphrase of this document with our AI Paraphraser
Data analysis report of the Number of Fatalities in Road accidents occurring in Australian
States/Territory between 2010 and 2018
Table of Contents..................................................................................................................................2
1. Introduction...............................................................................................................................3
1.1. Authorisation and Purpose...........................................................................................3
1.2. Limitations.........................................................................................................................3
1.3. Scope...................................................................................................................................3
1.4. Methodology.....................................................................................................................3
2. Data Setup.................................................................................................................................3
3. Exploratory Data analysis....................................................................................................4
3.1. One variable analysis.....................................................................................................4
3.1.1. One variable analysis 1.........................................................................................4
3.1.2. One variable analysis 2.........................................................................................4
3.1.3. One variable analysis 3.........................................................................................5
3.2. Two-variable analysis....................................................................................................5
3.2.1. Two-variable analysis 1.........................................................................................5
3.2.2. Two variable analysis 2.........................................................................................6
4. Advanced analysis..................................................................................................................7
4.1. Clustering...........................................................................................................................7
4.1.1. Brief explanation of k-means and clustering.................................................7
4.1.2. Clustering Analysis.................................................................................................7
4.2. Linear regression.............................................................................................................9
4.2.1. Brief definition of linear regression...................................................................9
4.2.2. Linear Regression 1................................................................................................9
4.2.3. Linear Regression 2..............................................................................................10
5. Conclusion...............................................................................................................................11
6. Reflection.................................................................................................................................11
References...........................................................................................................................................11
1. Introduction
pg. 1
Data analysis report of the Number of Fatalities in Road accidents occurring in Australian
States/Territory between 2010 and 2018
1.1. Authorisation and Purpose
The data analysis report has been performed for the number of road
accident fatalities in Australia states and territories for the period 2010 to
2018. The main objective of this analysis was to obtain relevant
information on the dataset. The variables selected are number of
fatalities, year, designated speed limit at the location of accident, and day
and month of the year in which the accident occurred. The results of the
analysis can be used by other researcher to formulate research problems,
government agencies and the general public.
1.2. Limitations
Majority of the variables in the dataset are categorical thus difficult to
come up with distinctive relationships. Further, advanced inferential
analysis would not be possible since the variables are categorical. Also,
the data used only cover accidents reported by the police department in
Australian states and territories. The data does not contain causes of the
accidents which is a limitation in making conclusion or recommendations.
1.3. Scope
Data from ‘Australian Road Death database’ was pre-processed and
loaded into R software for further analysis. The analysis includes one
variable analysis with accompanying graphs, next k-means clustering and
simple linear regression.
1.4. Methodology
The methods used are exploratory which include plotting variables and
advanced analysis such as K-means clustering, regression plots. All
references have been gathered from journal articles from the USC library
database.
2. Data Setup
The original dataset contained 50066 observations ranging from the year
1989 to 2019 with 21 variables. The first step in data cleaning was to form
a sample of data from 2010 to 2018 resulting in 11133 observations with
21 variables. The data was then copied and saved in csv format in the
working directory used in R. The data was saved as Fatalities.csv. The
code below was used to confirm the working directory.
The next step involved loading the data in R using the code below:
In addition, the package cluster was loaded to assist in visualisation of
clusters. However, the warnings and messages from the package were
suppressed (they make the code looks crowded).
3. Exploratory Data analysis
3.1. One variable analysis
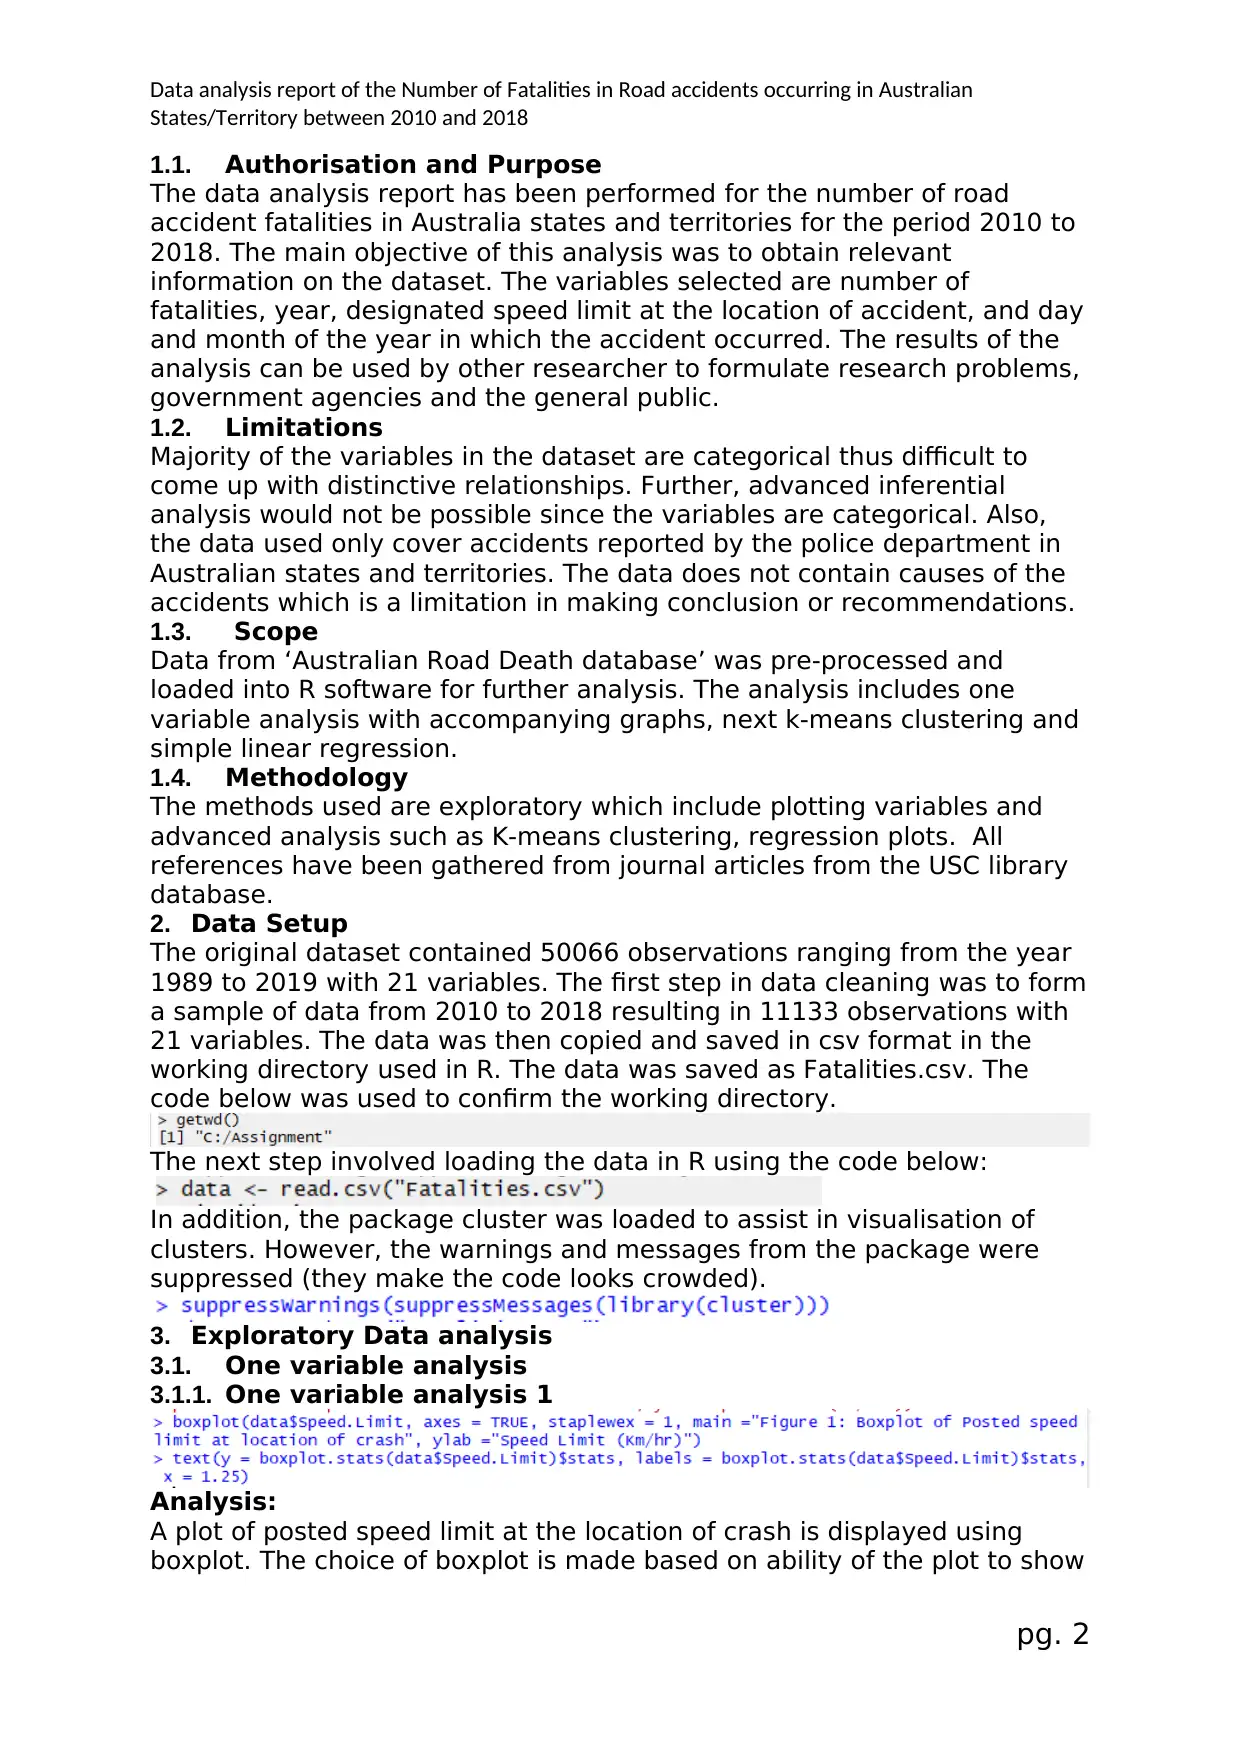
3.1.1. One variable analysis 1
Analysis:
A plot of posted speed limit at the location of crash is displayed using
boxplot. The choice of boxplot is made based on ability of the plot to show
pg. 2
States/Territory between 2010 and 2018
1.1. Authorisation and Purpose
The data analysis report has been performed for the number of road
accident fatalities in Australia states and territories for the period 2010 to
2018. The main objective of this analysis was to obtain relevant
information on the dataset. The variables selected are number of
fatalities, year, designated speed limit at the location of accident, and day
and month of the year in which the accident occurred. The results of the
analysis can be used by other researcher to formulate research problems,
government agencies and the general public.
1.2. Limitations
Majority of the variables in the dataset are categorical thus difficult to
come up with distinctive relationships. Further, advanced inferential
analysis would not be possible since the variables are categorical. Also,
the data used only cover accidents reported by the police department in
Australian states and territories. The data does not contain causes of the
accidents which is a limitation in making conclusion or recommendations.
1.3. Scope
Data from ‘Australian Road Death database’ was pre-processed and
loaded into R software for further analysis. The analysis includes one
variable analysis with accompanying graphs, next k-means clustering and
simple linear regression.
1.4. Methodology
The methods used are exploratory which include plotting variables and
advanced analysis such as K-means clustering, regression plots. All
references have been gathered from journal articles from the USC library
database.
2. Data Setup
The original dataset contained 50066 observations ranging from the year
1989 to 2019 with 21 variables. The first step in data cleaning was to form
a sample of data from 2010 to 2018 resulting in 11133 observations with
21 variables. The data was then copied and saved in csv format in the
working directory used in R. The data was saved as Fatalities.csv. The
code below was used to confirm the working directory.
The next step involved loading the data in R using the code below:
In addition, the package cluster was loaded to assist in visualisation of
clusters. However, the warnings and messages from the package were
suppressed (they make the code looks crowded).
3. Exploratory Data analysis
3.1. One variable analysis
3.1.1. One variable analysis 1
Analysis:
A plot of posted speed limit at the location of crash is displayed using
boxplot. The choice of boxplot is made based on ability of the plot to show
pg. 2
⊘ This is a preview!⊘
Do you want full access?
Subscribe today to unlock all pages.
Trusted by 1+ million students worldwide
Data analysis report of the Number of Fatalities in Road accidents occurring in Australian
States/Territory between 2010 and 2018
average, outlier, lower and upper quartile, minimum and maximum value
of the set speed limits. The average posted speed limit with registering
majority of fatal accidents in Australia is 80 Km/hr. A large portion of the
accidents occur in areas with speed limits above 80 Km/hr since the upper
quartile is much compact than the lower quartile. The maximum speed
allowed in Australia is 130 Km/hr while the lowest is 15 Km/hr. Also, some
fatal accidents occur at speeds lower than 15 Km/hr thus forming part of
outlier.
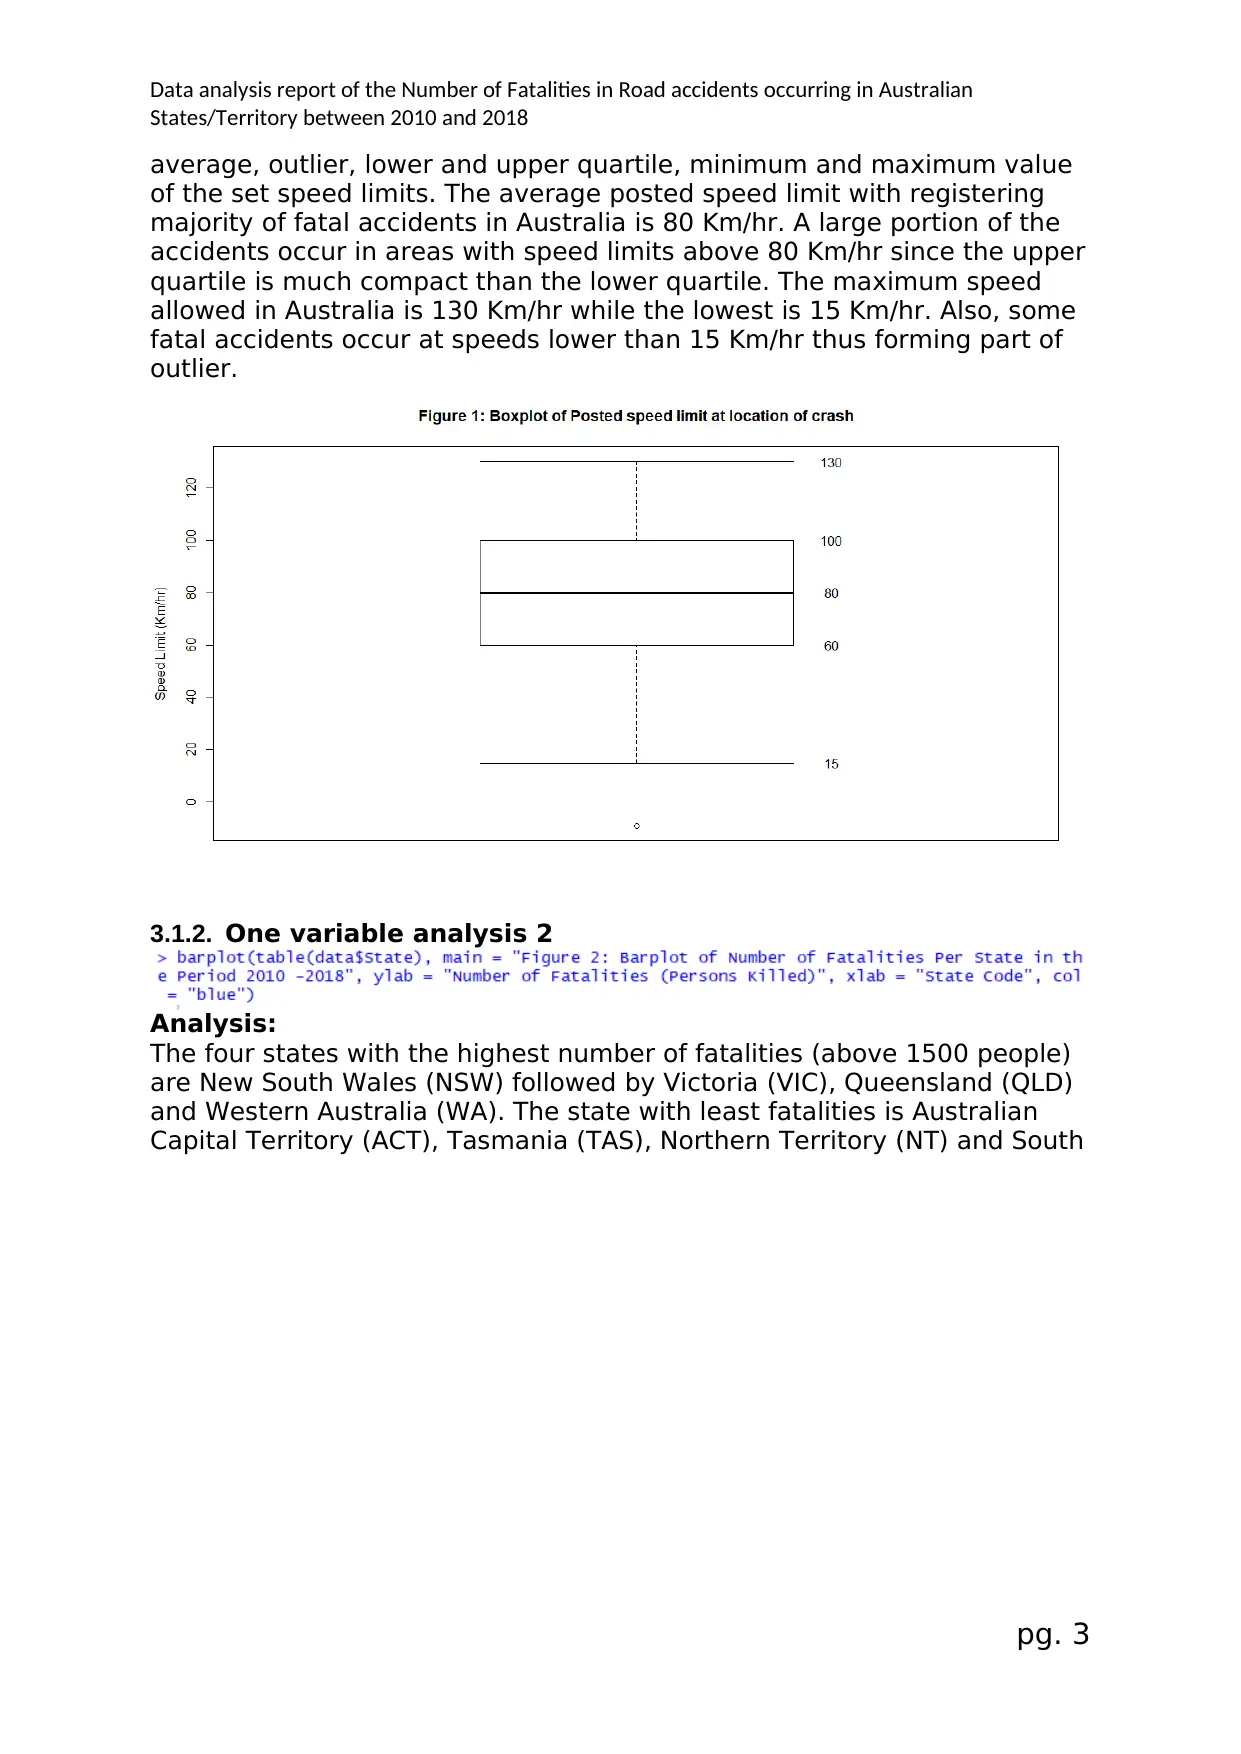
3.1.2. One variable analysis 2
Analysis:
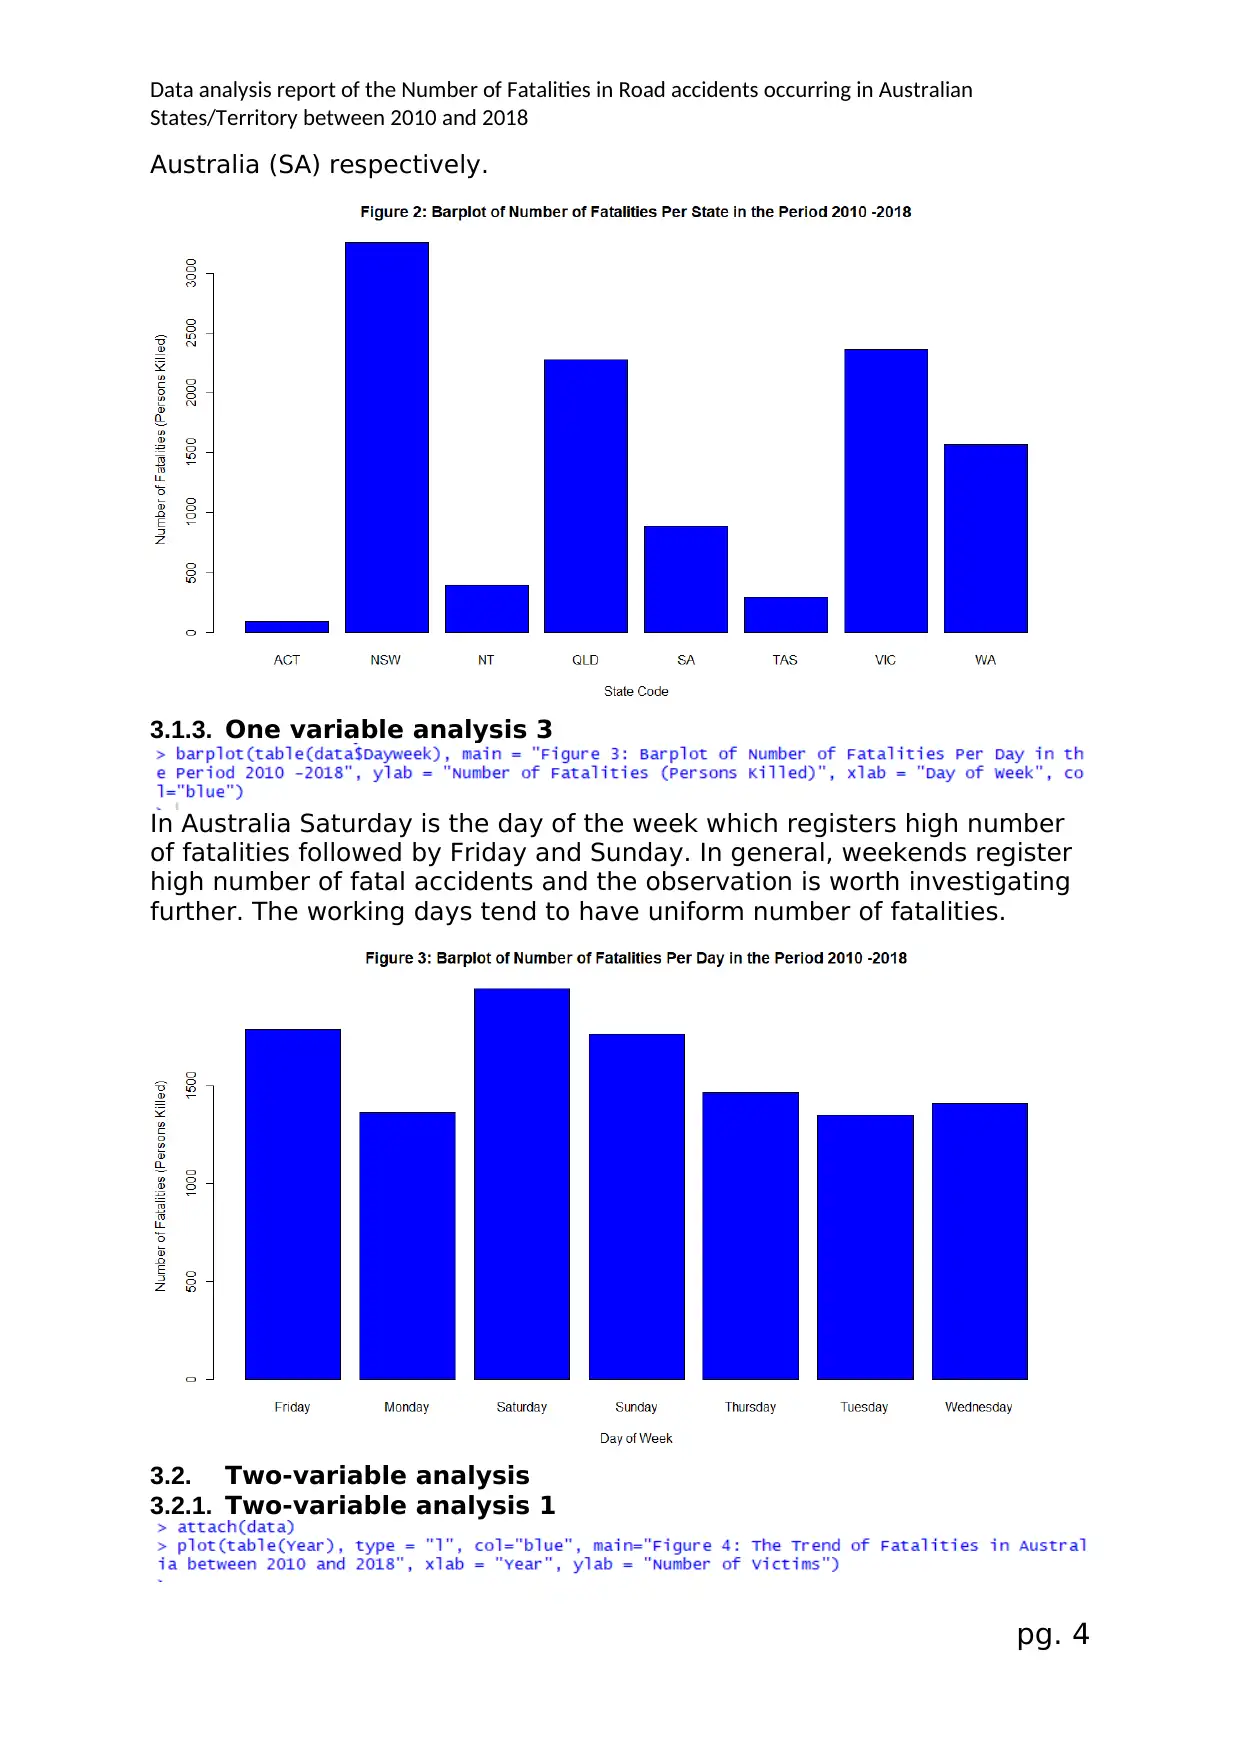
The four states with the highest number of fatalities (above 1500 people)
are New South Wales (NSW) followed by Victoria (VIC), Queensland (QLD)
and Western Australia (WA). The state with least fatalities is Australian
Capital Territory (ACT), Tasmania (TAS), Northern Territory (NT) and South
pg. 3
States/Territory between 2010 and 2018
average, outlier, lower and upper quartile, minimum and maximum value
of the set speed limits. The average posted speed limit with registering
majority of fatal accidents in Australia is 80 Km/hr. A large portion of the
accidents occur in areas with speed limits above 80 Km/hr since the upper
quartile is much compact than the lower quartile. The maximum speed
allowed in Australia is 130 Km/hr while the lowest is 15 Km/hr. Also, some
fatal accidents occur at speeds lower than 15 Km/hr thus forming part of
outlier.
3.1.2. One variable analysis 2
Analysis:
The four states with the highest number of fatalities (above 1500 people)
are New South Wales (NSW) followed by Victoria (VIC), Queensland (QLD)
and Western Australia (WA). The state with least fatalities is Australian
Capital Territory (ACT), Tasmania (TAS), Northern Territory (NT) and South
pg. 3
Paraphrase This Document
Need a fresh take? Get an instant paraphrase of this document with our AI Paraphraser
Data analysis report of the Number of Fatalities in Road accidents occurring in Australian
States/Territory between 2010 and 2018
Australia (SA) respectively.
3.1.3. One variable analysis 3
In Australia Saturday is the day of the week which registers high number
of fatalities followed by Friday and Sunday. In general, weekends register
high number of fatal accidents and the observation is worth investigating
further. The working days tend to have uniform number of fatalities.
3.2. Two-variable analysis
3.2.1. Two-variable analysis 1
pg. 4
Data analysis report of the Number of Fatalities in Road accidents occurring in Australian
States/Territory between 2010 and 2018
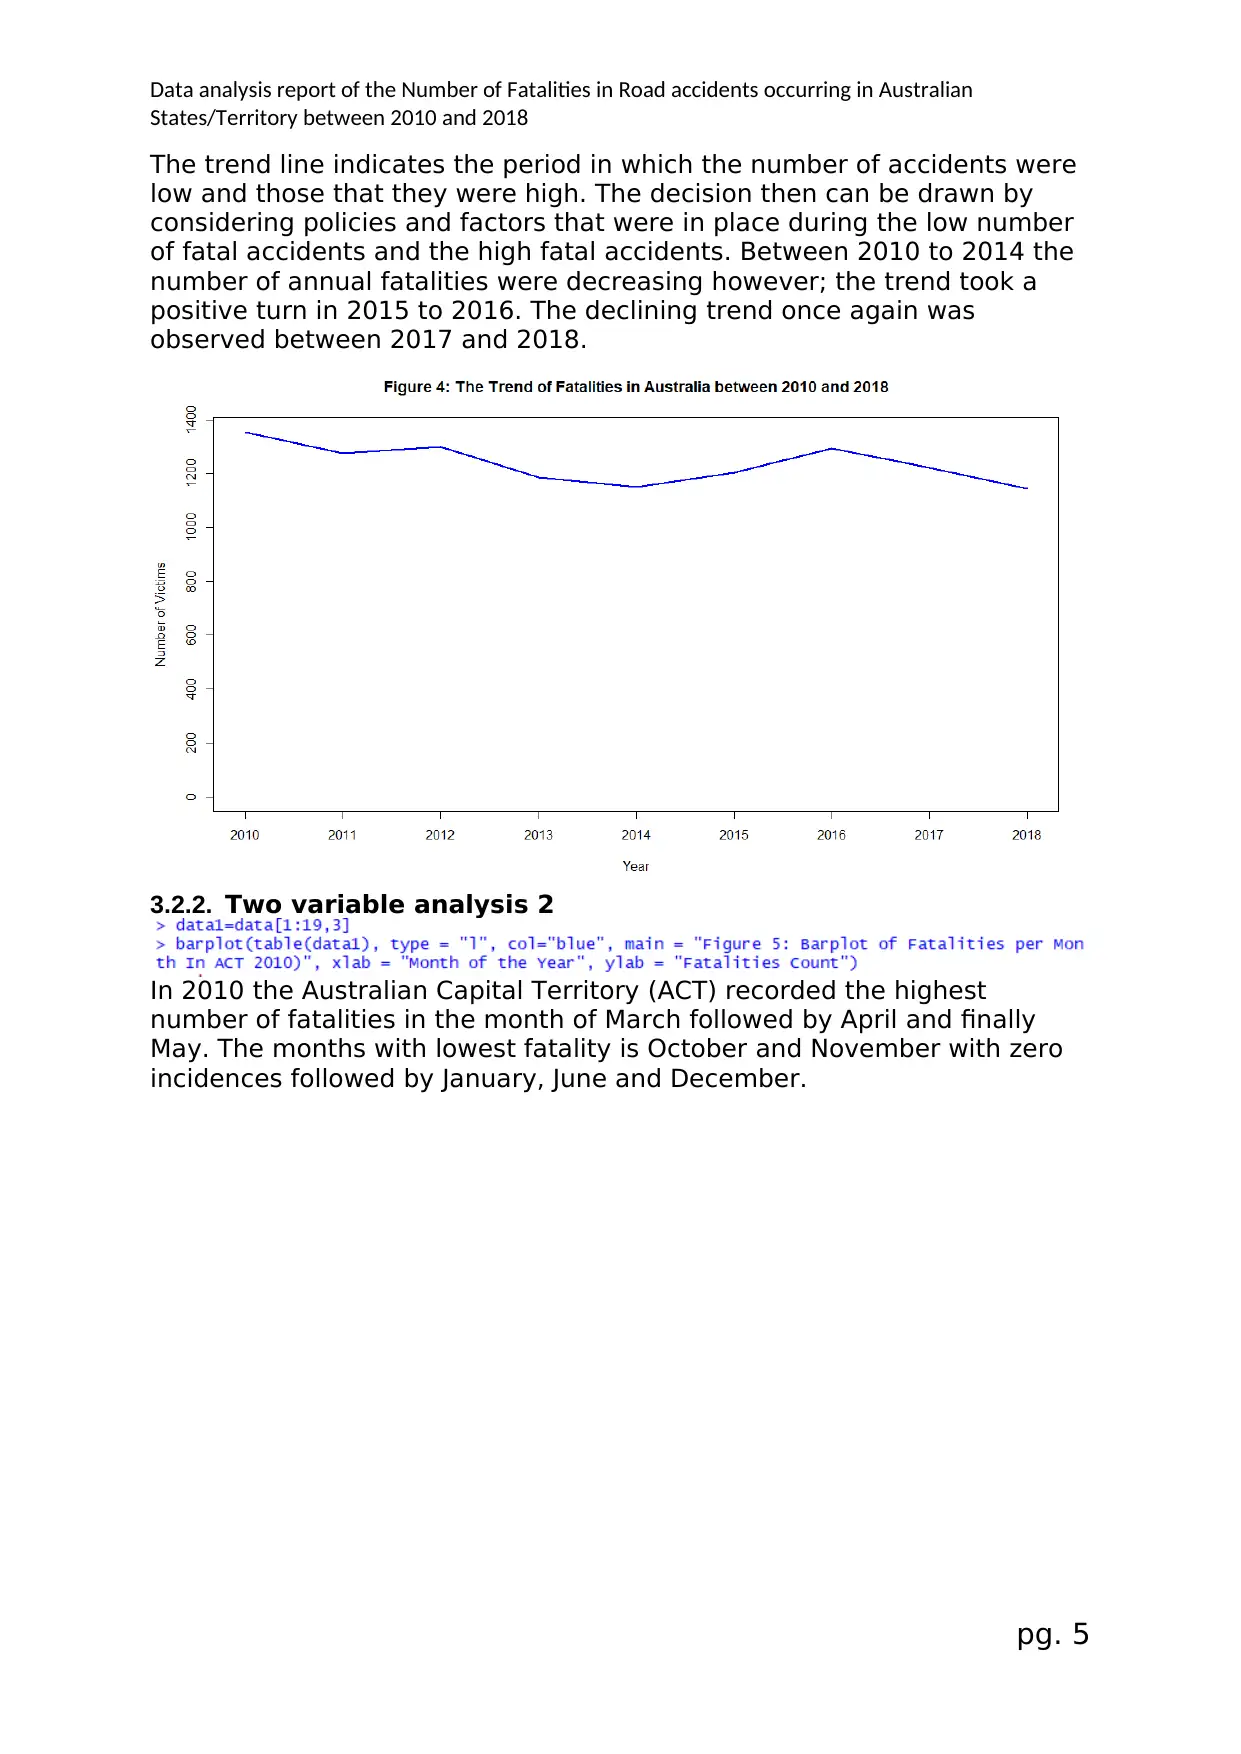
The trend line indicates the period in which the number of accidents were
low and those that they were high. The decision then can be drawn by
considering policies and factors that were in place during the low number
of fatal accidents and the high fatal accidents. Between 2010 to 2014 the
number of annual fatalities were decreasing however; the trend took a
positive turn in 2015 to 2016. The declining trend once again was
observed between 2017 and 2018.
3.2.2. Two variable analysis 2
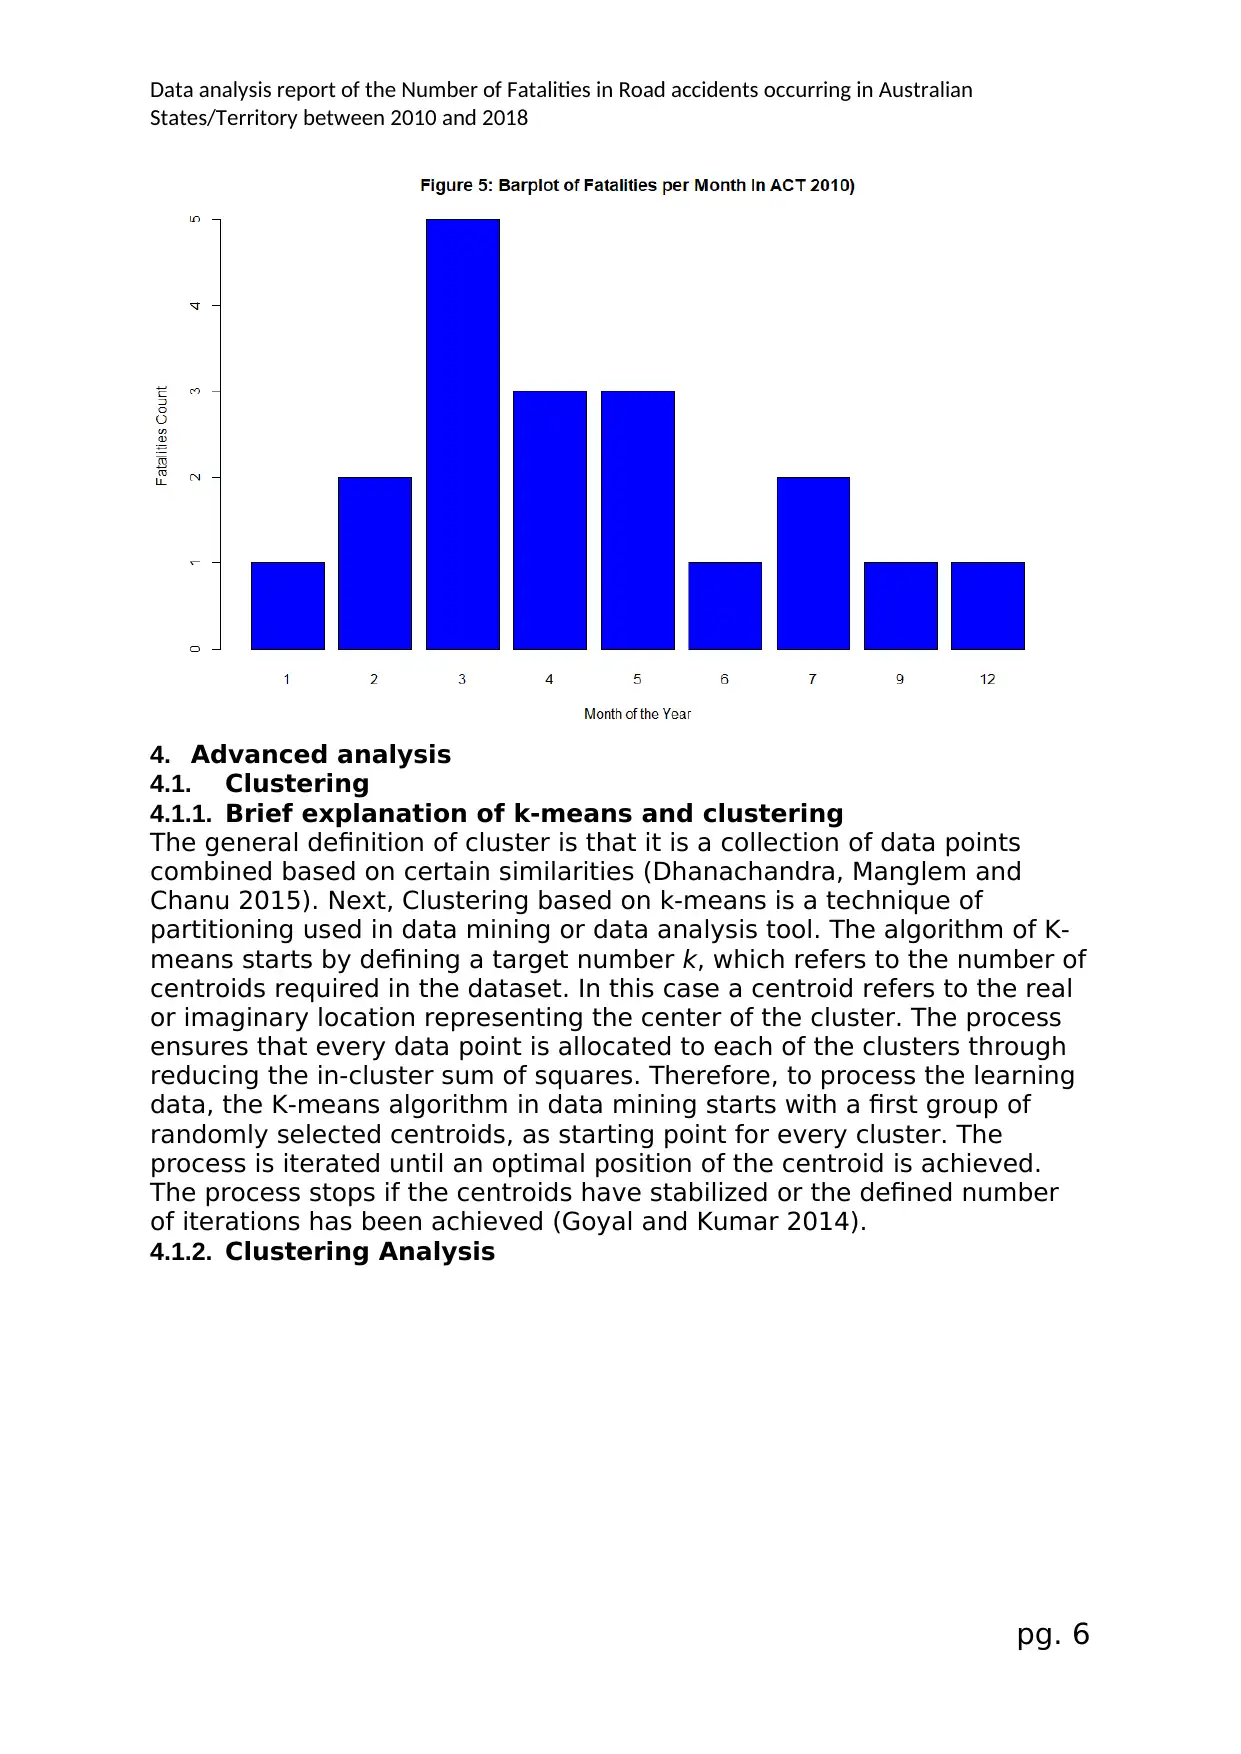
In 2010 the Australian Capital Territory (ACT) recorded the highest
number of fatalities in the month of March followed by April and finally
May. The months with lowest fatality is October and November with zero
incidences followed by January, June and December.
pg. 5
States/Territory between 2010 and 2018
The trend line indicates the period in which the number of accidents were
low and those that they were high. The decision then can be drawn by
considering policies and factors that were in place during the low number
of fatal accidents and the high fatal accidents. Between 2010 to 2014 the
number of annual fatalities were decreasing however; the trend took a
positive turn in 2015 to 2016. The declining trend once again was
observed between 2017 and 2018.
3.2.2. Two variable analysis 2
In 2010 the Australian Capital Territory (ACT) recorded the highest
number of fatalities in the month of March followed by April and finally
May. The months with lowest fatality is October and November with zero
incidences followed by January, June and December.
pg. 5
⊘ This is a preview!⊘
Do you want full access?
Subscribe today to unlock all pages.
Trusted by 1+ million students worldwide
Data analysis report of the Number of Fatalities in Road accidents occurring in Australian
States/Territory between 2010 and 2018
4. Advanced analysis
4.1. Clustering
4.1.1. Brief explanation of k-means and clustering
The general definition of cluster is that it is a collection of data points
combined based on certain similarities (Dhanachandra, Manglem and
Chanu 2015). Next, Clustering based on k-means is a technique of
partitioning used in data mining or data analysis tool. The algorithm of K-
means starts by defining a target number k, which refers to the number of
centroids required in the dataset. In this case a centroid refers to the real
or imaginary location representing the center of the cluster. The process
ensures that every data point is allocated to each of the clusters through
reducing the in-cluster sum of squares. Therefore, to process the learning
data, the K-means algorithm in data mining starts with a first group of
randomly selected centroids, as starting point for every cluster. The
process is iterated until an optimal position of the centroid is achieved.
The process stops if the centroids have stabilized or the defined number
of iterations has been achieved (Goyal and Kumar 2014).
4.1.2. Clustering Analysis
pg. 6
Paraphrase This Document
Need a fresh take? Get an instant paraphrase of this document with our AI Paraphraser
Data analysis report of the Number of Fatalities in Road accidents occurring in Australian
States/Territory between 2010 and 2018
pg. 7
States/Territory between 2010 and 2018
pg. 7
Data analysis report of the Number of Fatalities in Road accidents occurring in Australian
States/Territory between 2010 and 2018
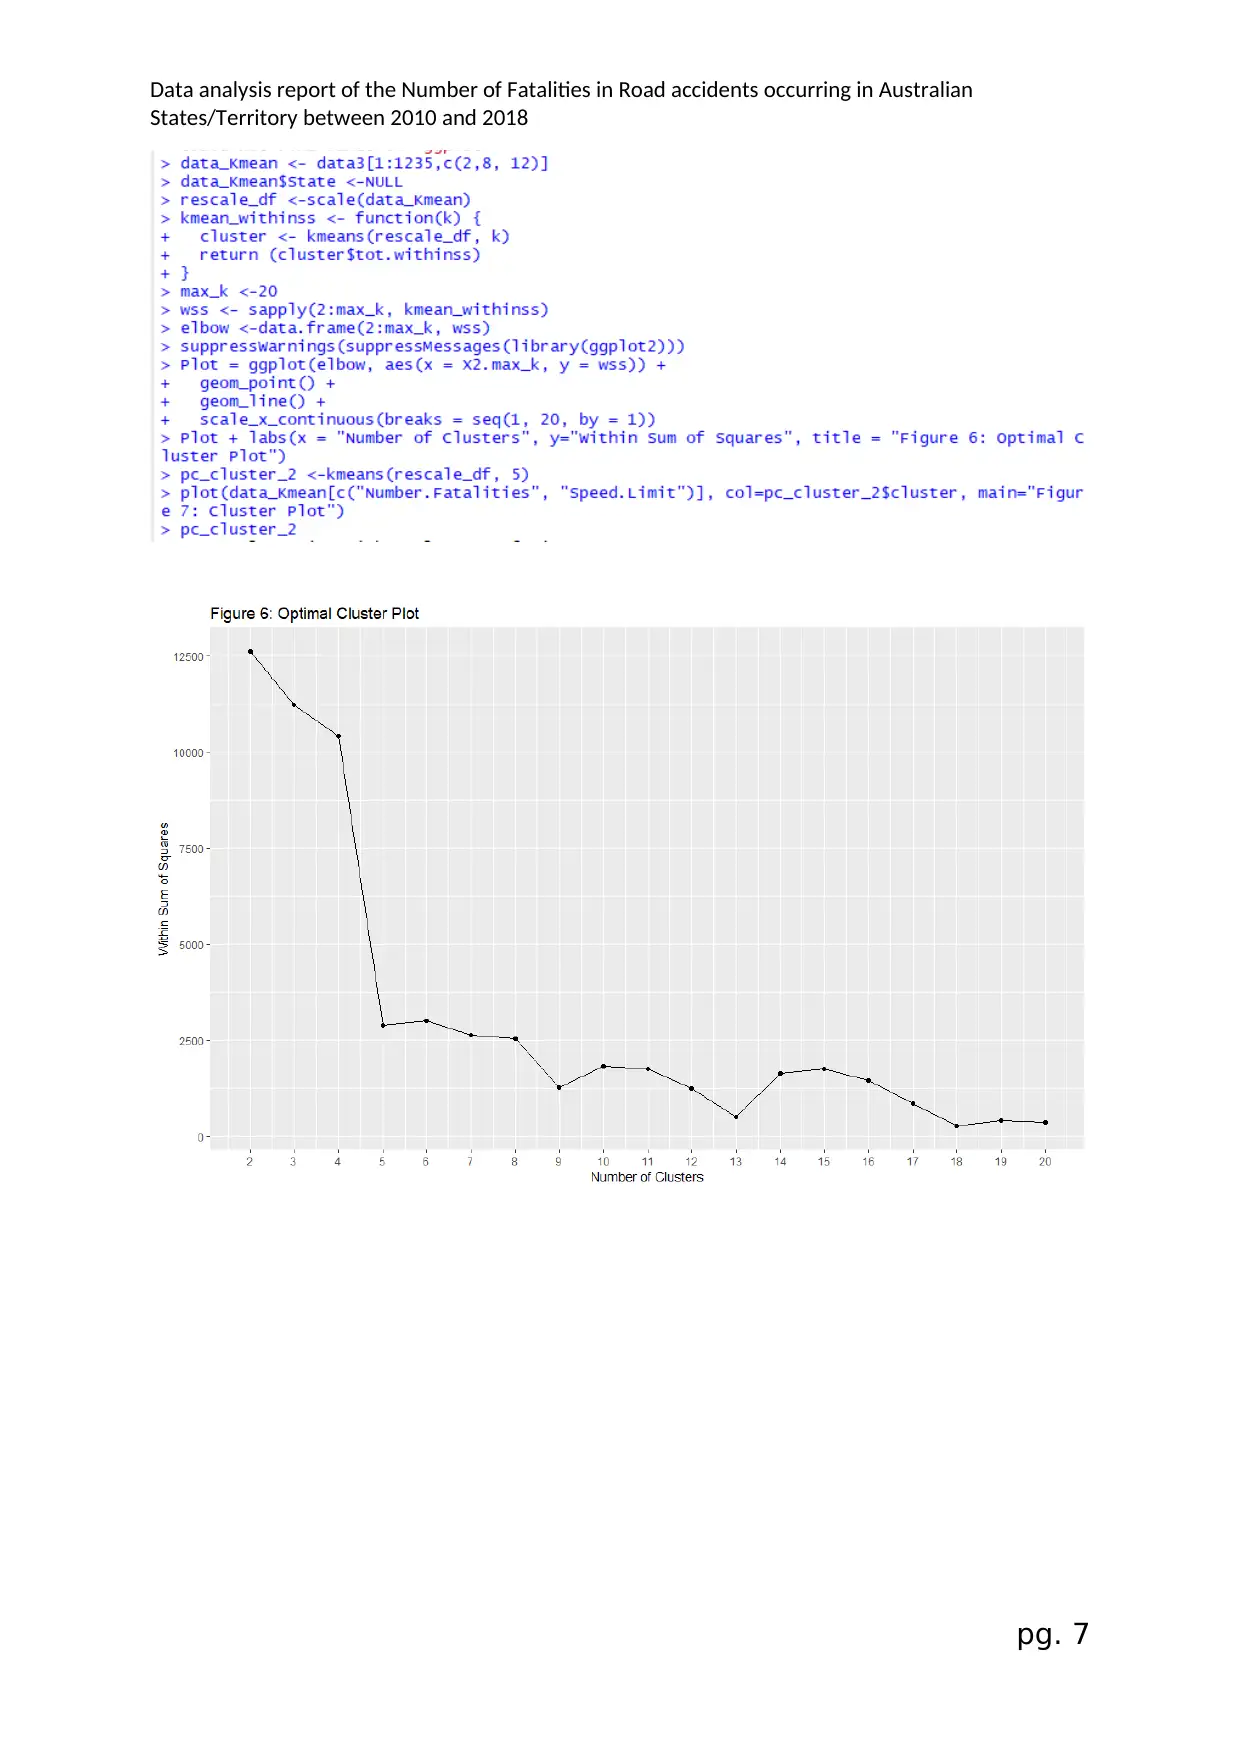
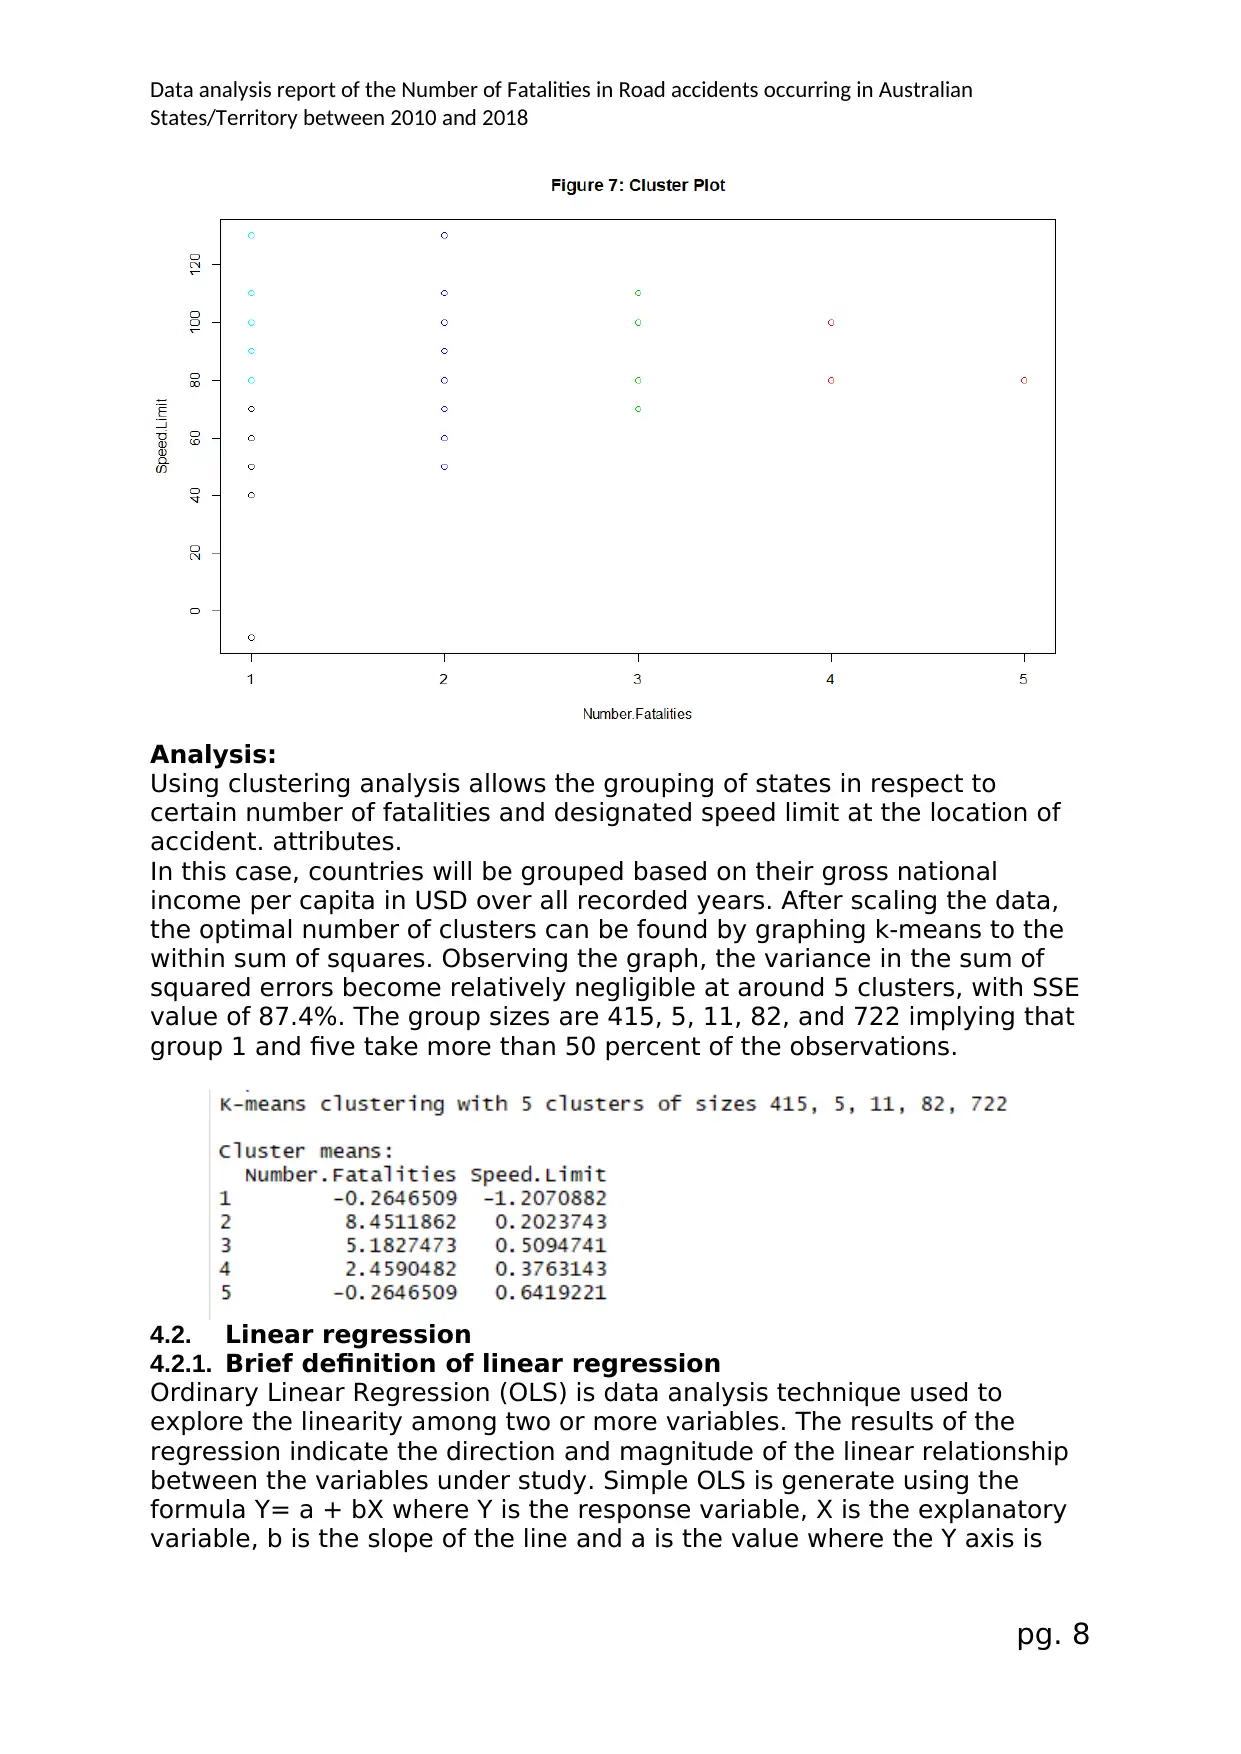
Analysis:
Using clustering analysis allows the grouping of states in respect to
certain number of fatalities and designated speed limit at the location of
accident. attributes.
In this case, countries will be grouped based on their gross national
income per capita in USD over all recorded years. After scaling the data,
the optimal number of clusters can be found by graphing k-means to the
within sum of squares. Observing the graph, the variance in the sum of
squared errors become relatively negligible at around 5 clusters, with SSE
value of 87.4%. The group sizes are 415, 5, 11, 82, and 722 implying that
group 1 and five take more than 50 percent of the observations.
4.2. Linear regression
4.2.1. Brief definition of linear regression
Ordinary Linear Regression (OLS) is data analysis technique used to
explore the linearity among two or more variables. The results of the
regression indicate the direction and magnitude of the linear relationship
between the variables under study. Simple OLS is generate using the
formula Y= a + bX where Y is the response variable, X is the explanatory
variable, b is the slope of the line and a is the value where the Y axis is
pg. 8
States/Territory between 2010 and 2018
Analysis:
Using clustering analysis allows the grouping of states in respect to
certain number of fatalities and designated speed limit at the location of
accident. attributes.
In this case, countries will be grouped based on their gross national
income per capita in USD over all recorded years. After scaling the data,
the optimal number of clusters can be found by graphing k-means to the
within sum of squares. Observing the graph, the variance in the sum of
squared errors become relatively negligible at around 5 clusters, with SSE
value of 87.4%. The group sizes are 415, 5, 11, 82, and 722 implying that
group 1 and five take more than 50 percent of the observations.
4.2. Linear regression
4.2.1. Brief definition of linear regression
Ordinary Linear Regression (OLS) is data analysis technique used to
explore the linearity among two or more variables. The results of the
regression indicate the direction and magnitude of the linear relationship
between the variables under study. Simple OLS is generate using the
formula Y= a + bX where Y is the response variable, X is the explanatory
variable, b is the slope of the line and a is the value where the Y axis is
pg. 8
⊘ This is a preview!⊘
Do you want full access?
Subscribe today to unlock all pages.
Trusted by 1+ million students worldwide
Data analysis report of the Number of Fatalities in Road accidents occurring in Australian
States/Territory between 2010 and 2018
intercepted (Pandis 2016). The slope displayed from the Y intercept can
model a line in which values can be predicted (Sainani 2013).
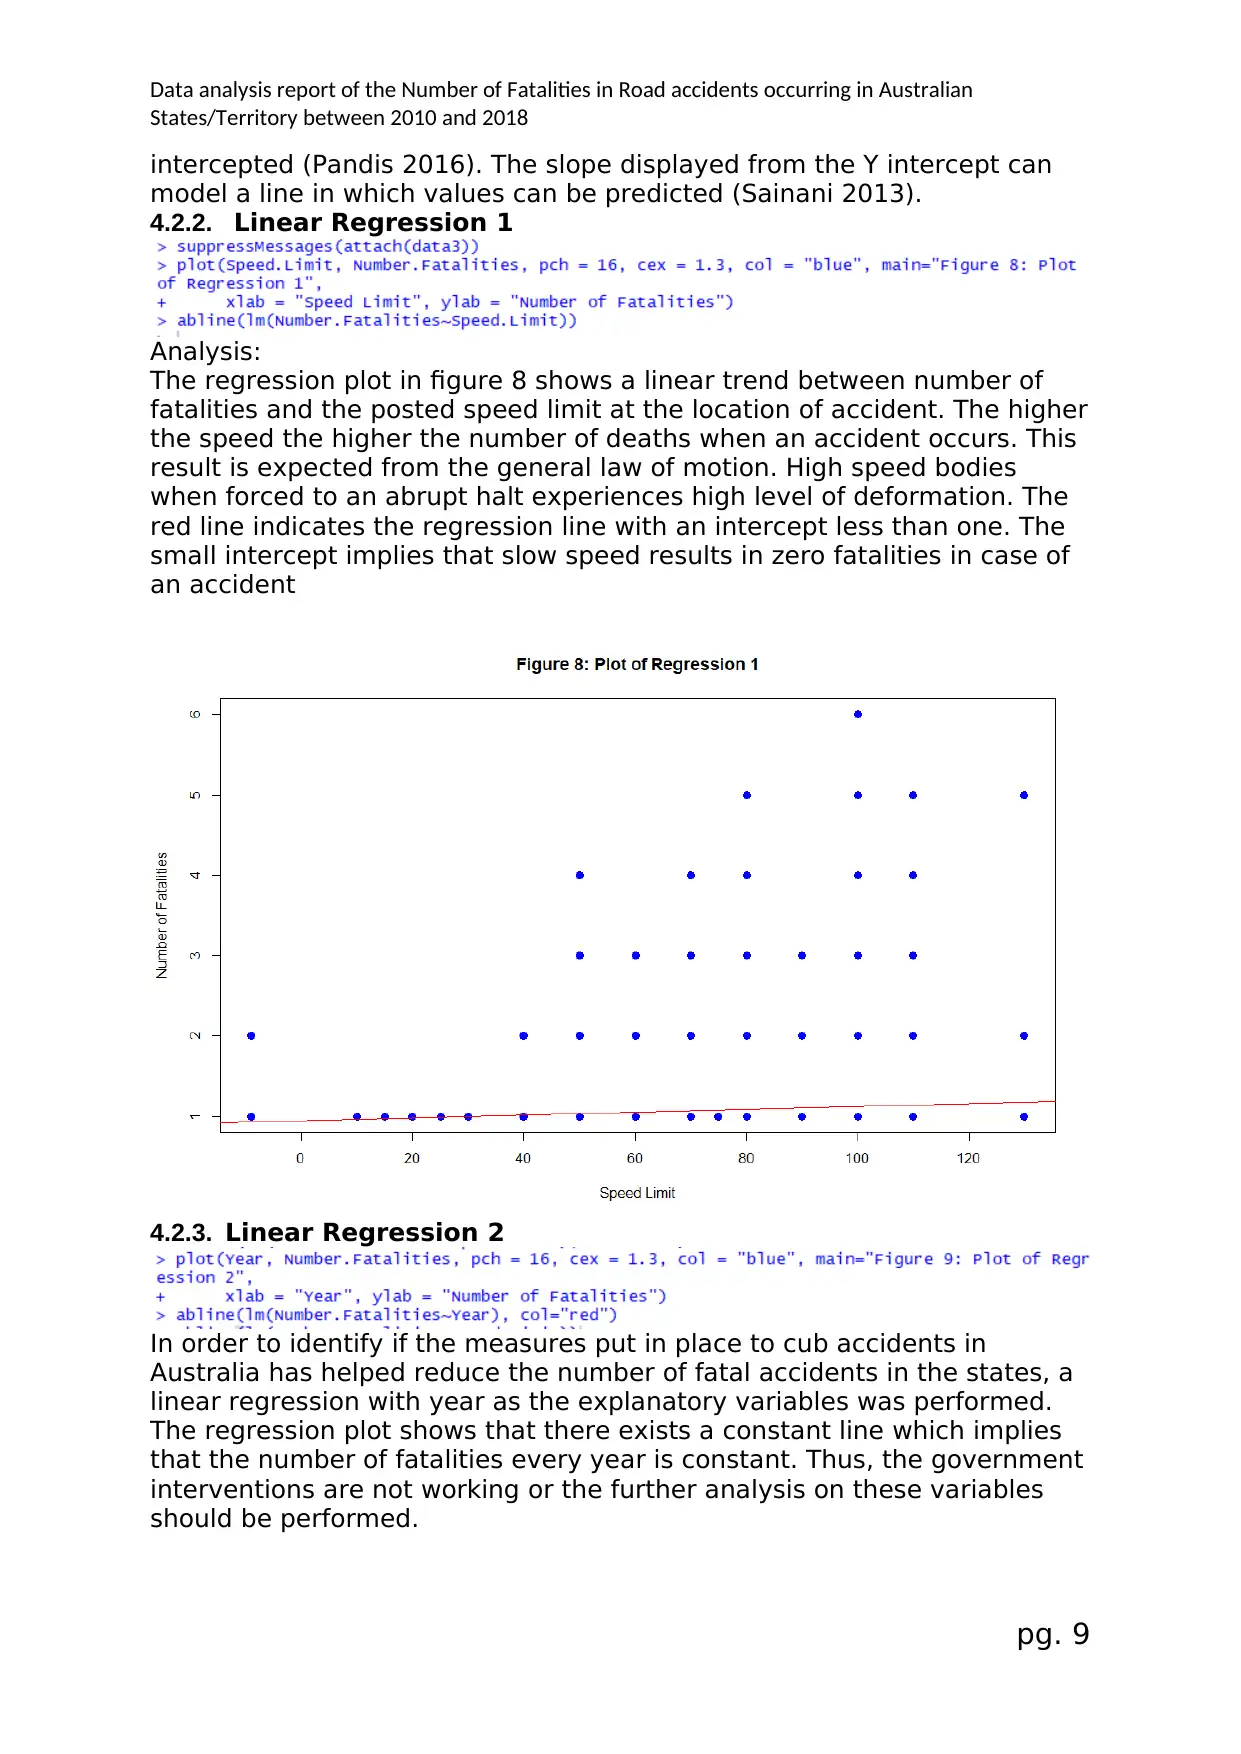
4.2.2. Linear Regression 1
Analysis:
The regression plot in figure 8 shows a linear trend between number of
fatalities and the posted speed limit at the location of accident. The higher
the speed the higher the number of deaths when an accident occurs. This
result is expected from the general law of motion. High speed bodies
when forced to an abrupt halt experiences high level of deformation. The
red line indicates the regression line with an intercept less than one. The
small intercept implies that slow speed results in zero fatalities in case of
an accident
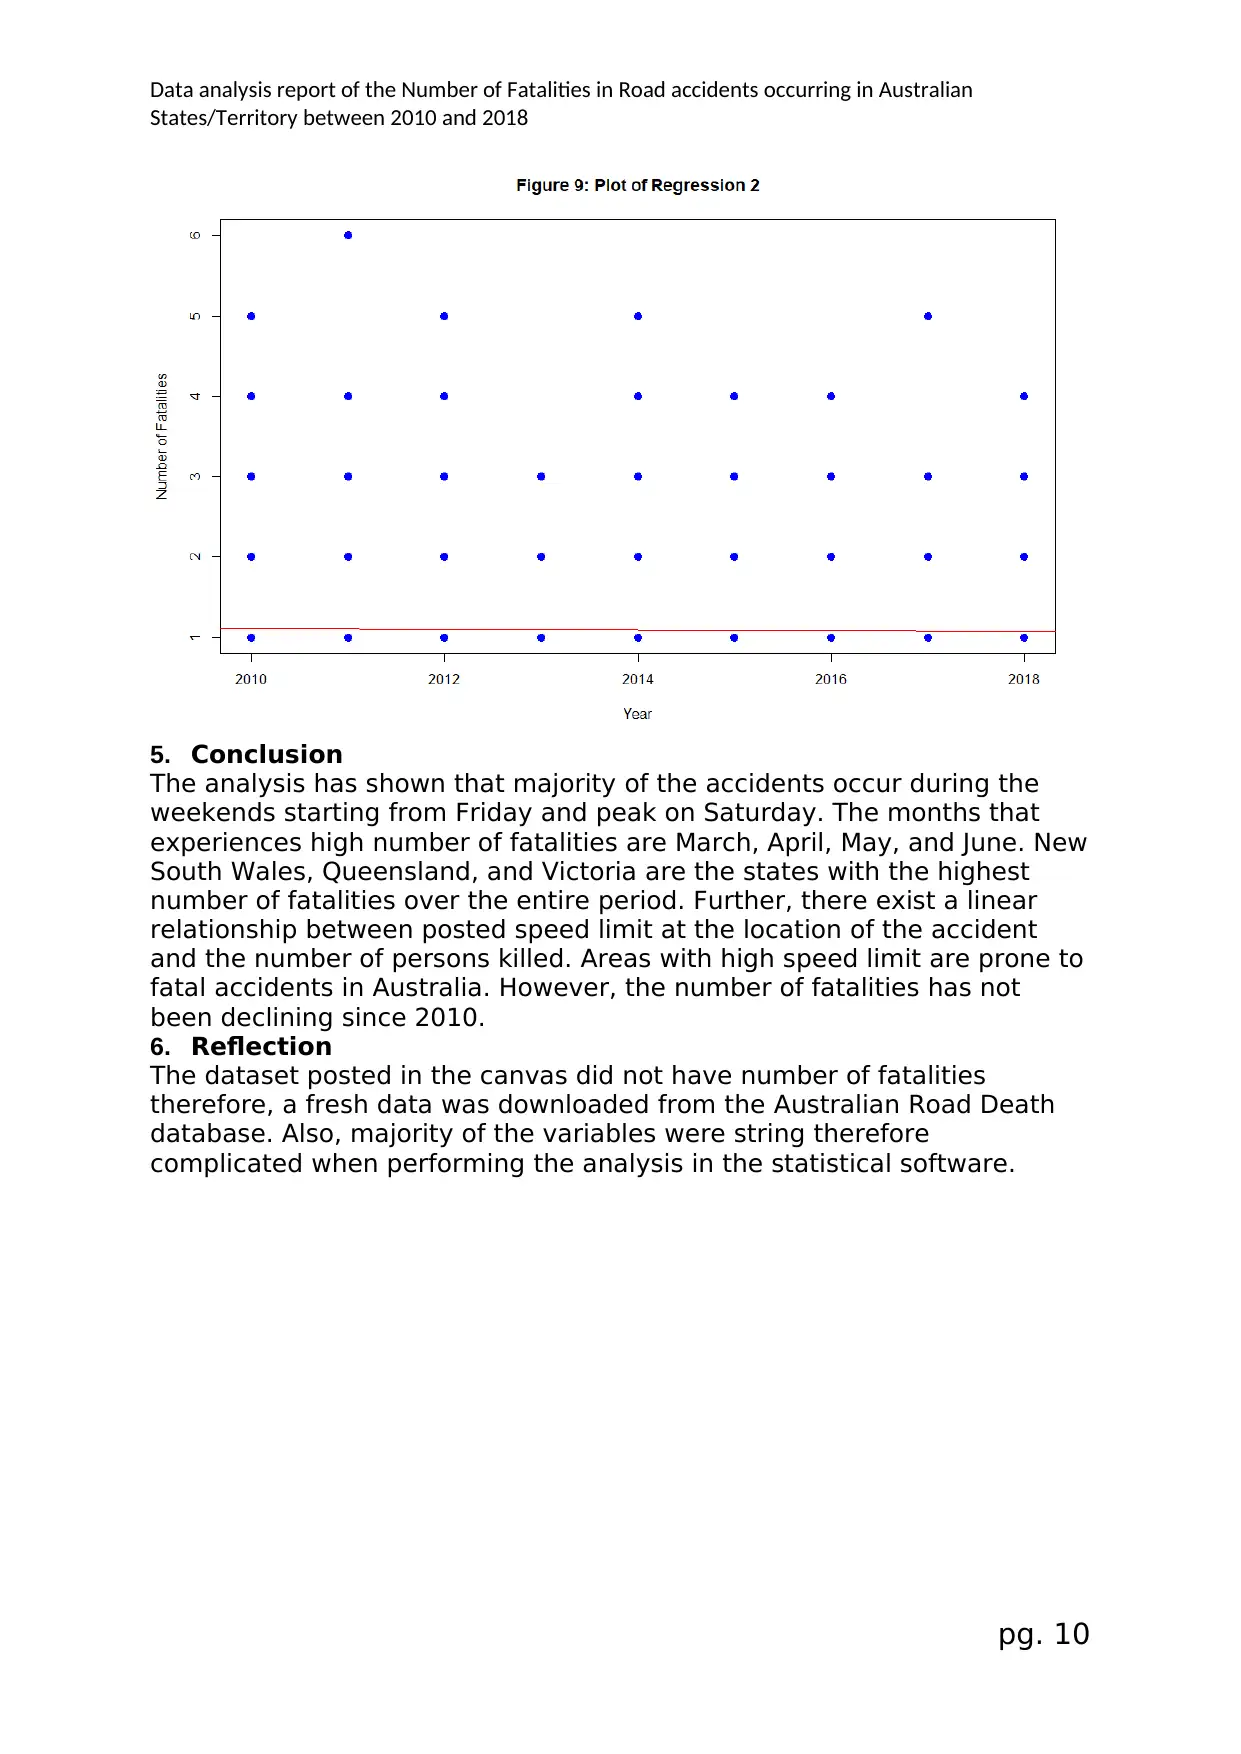
4.2.3. Linear Regression 2
In order to identify if the measures put in place to cub accidents in
Australia has helped reduce the number of fatal accidents in the states, a
linear regression with year as the explanatory variables was performed.
The regression plot shows that there exists a constant line which implies
that the number of fatalities every year is constant. Thus, the government
interventions are not working or the further analysis on these variables
should be performed.
pg. 9
States/Territory between 2010 and 2018
intercepted (Pandis 2016). The slope displayed from the Y intercept can
model a line in which values can be predicted (Sainani 2013).
4.2.2. Linear Regression 1
Analysis:
The regression plot in figure 8 shows a linear trend between number of
fatalities and the posted speed limit at the location of accident. The higher
the speed the higher the number of deaths when an accident occurs. This
result is expected from the general law of motion. High speed bodies
when forced to an abrupt halt experiences high level of deformation. The
red line indicates the regression line with an intercept less than one. The
small intercept implies that slow speed results in zero fatalities in case of
an accident
4.2.3. Linear Regression 2
In order to identify if the measures put in place to cub accidents in
Australia has helped reduce the number of fatal accidents in the states, a
linear regression with year as the explanatory variables was performed.
The regression plot shows that there exists a constant line which implies
that the number of fatalities every year is constant. Thus, the government
interventions are not working or the further analysis on these variables
should be performed.
pg. 9
Paraphrase This Document
Need a fresh take? Get an instant paraphrase of this document with our AI Paraphraser
Data analysis report of the Number of Fatalities in Road accidents occurring in Australian
States/Territory between 2010 and 2018
5. Conclusion
The analysis has shown that majority of the accidents occur during the
weekends starting from Friday and peak on Saturday. The months that
experiences high number of fatalities are March, April, May, and June. New
South Wales, Queensland, and Victoria are the states with the highest
number of fatalities over the entire period. Further, there exist a linear
relationship between posted speed limit at the location of the accident
and the number of persons killed. Areas with high speed limit are prone to
fatal accidents in Australia. However, the number of fatalities has not
been declining since 2010.
6. Reflection
The dataset posted in the canvas did not have number of fatalities
therefore, a fresh data was downloaded from the Australian Road Death
database. Also, majority of the variables were string therefore
complicated when performing the analysis in the statistical software.
pg. 10
Data analysis report of the Number of Fatalities in Road accidents occurring in Australian
States/Territory between 2010 and 2018
References
Dhanachandra, N., Manglem, K. and Chanu, Y.J., 2015. Image
segmentation using K-means clustering algorithm and subtractive
clustering algorithm. Procedia Computer Science, 54, pp.764-771.
Goyal, M. and Kumar, S., 2014. Improving the initial centroids of K-means
clustering algorithm to generalize its applicability. Journal of The
Institution of Engineers (India): Series B, 95(4), pp.345-350.
Orthopedics, vol. 149, no. 3, pp. 431-434, doi:
10.1016/j.ajodo.2015.11.019
Pandis, N 2016, Linear regression, American Journal of Orthodontics and
Dentofacial
Sainani, K 2013, Understanding linear regression, Statistically speaking,
vol. 5, pp. 10631068, doi: 10.1016/j.pmrj.2013.10.002.
pg. 11
⊘ This is a preview!⊘
Do you want full access?
Subscribe today to unlock all pages.
Trusted by 1+ million students worldwide
1 out of 12
Related Documents


Your All-in-One AI-Powered Toolkit for Academic Success.
+13062052269
info@desklib.com
Available 24*7 on WhatsApp / Email
![[object Object]](/_next/static/media/star-bottom.7253800d.svg)
Unlock your academic potential
Copyright © 2020–2026 A2Z Services. All Rights Reserved. Developed and managed by ZUCOL.