Data Analysis Report on Market Research of USC Soft Drink Consumption
VerifiedAdded on 2023/06/10
|10
|1990
|180
Report
AI Summary
This report provides a detailed data analysis of the soft drink market at USC, focusing on student preferences and consumption patterns. The analysis, based on a random sample of 90 students, identifies the most and least preferred beverages among both local and international students. The report examines the relationship between price and consumption, student loyalty to preferred brands, and differences in demand between local and international students using statistical tests like correlation coefficient and z-tests. Additionally, the report includes a confidence interval for the proportion of students who prefer soft drinks, providing a range within which the true proportion is likely to fall. The findings offer insights into the dynamics of the soft drink market within the USC student population.
Running head: DATA ANALYSIS REPORT ON MARKET RESEARCH
Data Analysis Report On Market Research
Name of the Student:
Name of the University:
Author Note:
Data Analysis Report On Market Research
Name of the Student:
Name of the University:
Author Note:
Paraphrase This Document
Need a fresh take? Get an instant paraphrase of this document with our AI Paraphraser
1DATA ANALYSIS REPORT ON MARKET RESEARCH
Table of Contents
Introduction......................................................................................................................................2
Data Analysis...................................................................................................................................2
Response to Question 1...............................................................................................................2
Response to Question 2...............................................................................................................2
Response to Question 3...............................................................................................................3
Response to Question 4...............................................................................................................4
Response to Question 5...............................................................................................................5
Response to Question 6...............................................................................................................6
Response to Question 7...............................................................................................................7
Summary..........................................................................................................................................8
References........................................................................................................................................9
2DATA ANALYSIS REPORT ON MARKET RESEARCH
Introduction
The purpose of this report is to provide a detailed analysis on the survey data based on
the beverages consumption between domestic students and international students of USC
University to understand the preference of beverages among thousands of students of the
university. The analysis is performed after selecting a random sample of 90 students. The
consumption of beverages is measured with reference to 375ml cans. In this paper, the most
preferred beverages have been chosen for total students and for local and international students
separately.
Data Analysis
All the given requirements are addressed in the course of this study. The dataset is given
in the Excel sheet with 200 responses. The random numbers were already calculated using
RAND() function in Excel (Mélard 2014). Firstly, the random sample of size 90 is drawn by
doing customised sorting of the random numbers.
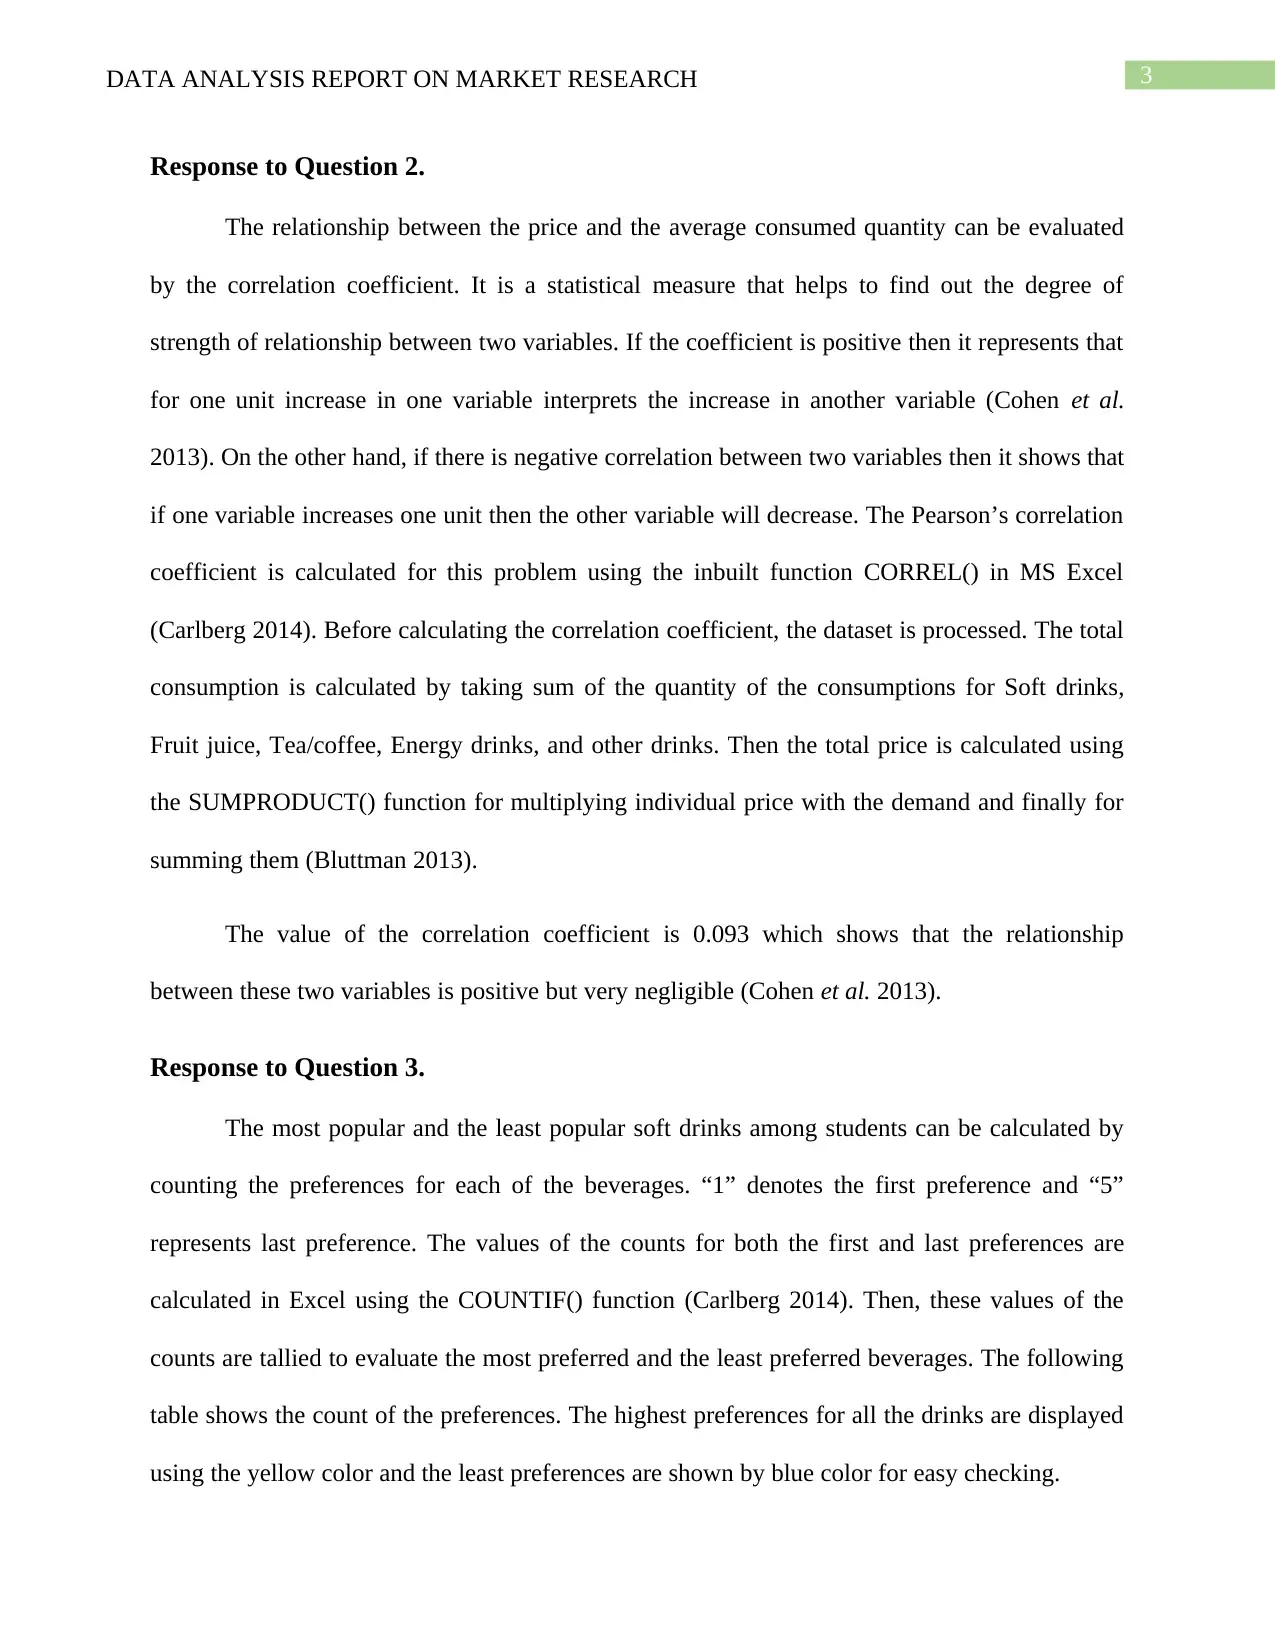
Response to Question 1.
The proportions of both local and international students are shown in the tabular form
below:
Proportion of local students 0.911111
Proportion of international students 0.088889
Introduction
The purpose of this report is to provide a detailed analysis on the survey data based on
the beverages consumption between domestic students and international students of USC
University to understand the preference of beverages among thousands of students of the
university. The analysis is performed after selecting a random sample of 90 students. The
consumption of beverages is measured with reference to 375ml cans. In this paper, the most
preferred beverages have been chosen for total students and for local and international students
separately.
Data Analysis
All the given requirements are addressed in the course of this study. The dataset is given
in the Excel sheet with 200 responses. The random numbers were already calculated using
RAND() function in Excel (Mélard 2014). Firstly, the random sample of size 90 is drawn by
doing customised sorting of the random numbers.
Response to Question 1.
The proportions of both local and international students are shown in the tabular form
below:
Proportion of local students 0.911111
Proportion of international students 0.088889
⊘ This is a preview!⊘
Do you want full access?
Subscribe today to unlock all pages.
Trusted by 1+ million students worldwide
3DATA ANALYSIS REPORT ON MARKET RESEARCH
Response to Question 2.
The relationship between the price and the average consumed quantity can be evaluated
by the correlation coefficient. It is a statistical measure that helps to find out the degree of
strength of relationship between two variables. If the coefficient is positive then it represents that
for one unit increase in one variable interprets the increase in another variable (Cohen et al.
2013). On the other hand, if there is negative correlation between two variables then it shows that
if one variable increases one unit then the other variable will decrease. The Pearson’s correlation
coefficient is calculated for this problem using the inbuilt function CORREL() in MS Excel
(Carlberg 2014). Before calculating the correlation coefficient, the dataset is processed. The total
consumption is calculated by taking sum of the quantity of the consumptions for Soft drinks,
Fruit juice, Tea/coffee, Energy drinks, and other drinks. Then the total price is calculated using
the SUMPRODUCT() function for multiplying individual price with the demand and finally for
summing them (Bluttman 2013).
The value of the correlation coefficient is 0.093 which shows that the relationship
between these two variables is positive but very negligible (Cohen et al. 2013).
Response to Question 3.
The most popular and the least popular soft drinks among students can be calculated by
counting the preferences for each of the beverages. “1” denotes the first preference and “5”
represents last preference. The values of the counts for both the first and last preferences are
calculated in Excel using the COUNTIF() function (Carlberg 2014). Then, these values of the
counts are tallied to evaluate the most preferred and the least preferred beverages. The following
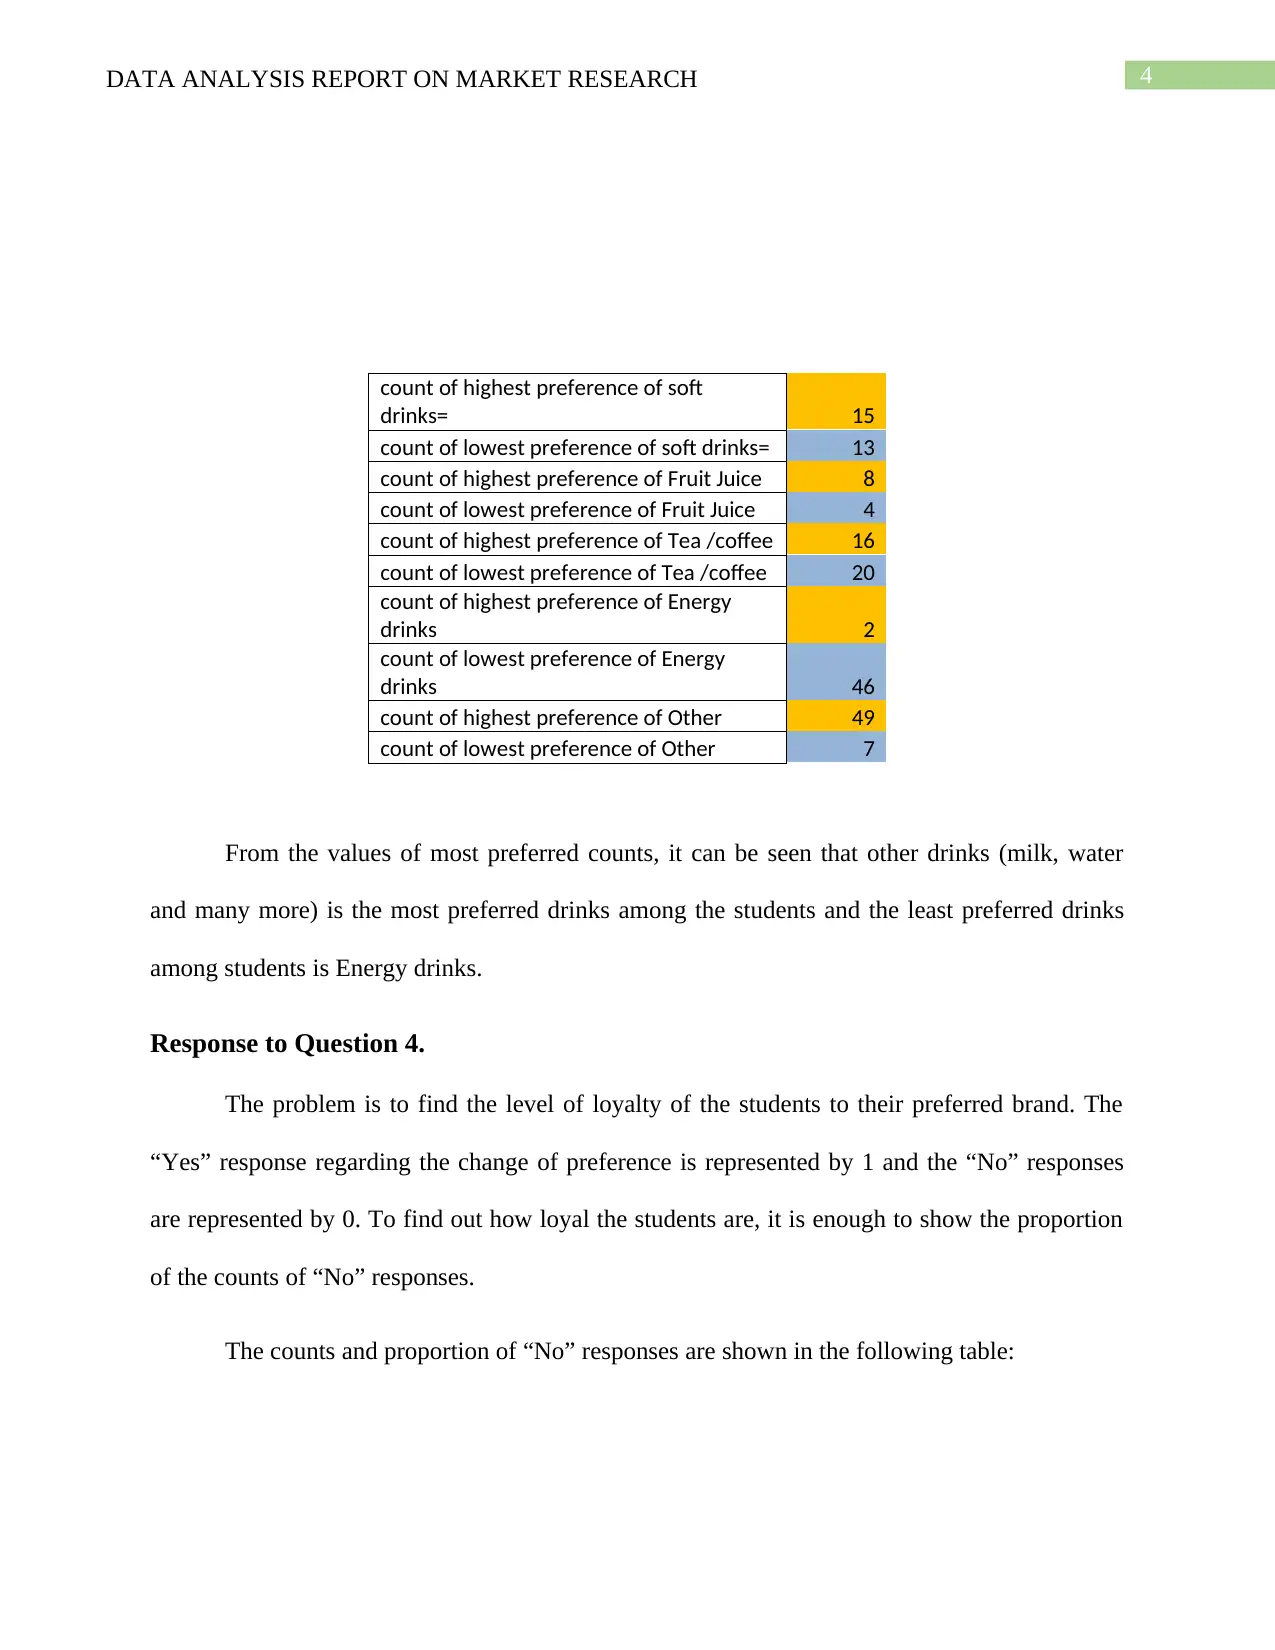
table shows the count of the preferences. The highest preferences for all the drinks are displayed
using the yellow color and the least preferences are shown by blue color for easy checking.
Response to Question 2.
The relationship between the price and the average consumed quantity can be evaluated
by the correlation coefficient. It is a statistical measure that helps to find out the degree of
strength of relationship between two variables. If the coefficient is positive then it represents that
for one unit increase in one variable interprets the increase in another variable (Cohen et al.
2013). On the other hand, if there is negative correlation between two variables then it shows that
if one variable increases one unit then the other variable will decrease. The Pearson’s correlation
coefficient is calculated for this problem using the inbuilt function CORREL() in MS Excel
(Carlberg 2014). Before calculating the correlation coefficient, the dataset is processed. The total
consumption is calculated by taking sum of the quantity of the consumptions for Soft drinks,
Fruit juice, Tea/coffee, Energy drinks, and other drinks. Then the total price is calculated using
the SUMPRODUCT() function for multiplying individual price with the demand and finally for
summing them (Bluttman 2013).
The value of the correlation coefficient is 0.093 which shows that the relationship
between these two variables is positive but very negligible (Cohen et al. 2013).
Response to Question 3.
The most popular and the least popular soft drinks among students can be calculated by
counting the preferences for each of the beverages. “1” denotes the first preference and “5”
represents last preference. The values of the counts for both the first and last preferences are
calculated in Excel using the COUNTIF() function (Carlberg 2014). Then, these values of the
counts are tallied to evaluate the most preferred and the least preferred beverages. The following
table shows the count of the preferences. The highest preferences for all the drinks are displayed
using the yellow color and the least preferences are shown by blue color for easy checking.
Paraphrase This Document
Need a fresh take? Get an instant paraphrase of this document with our AI Paraphraser
4DATA ANALYSIS REPORT ON MARKET RESEARCH
count of highest preference of soft
drinks= 15
count of lowest preference of soft drinks= 13
count of highest preference of Fruit Juice 8
count of lowest preference of Fruit Juice 4
count of highest preference of Tea /coffee 16
count of lowest preference of Tea /coffee 20
count of highest preference of Energy
drinks 2
count of lowest preference of Energy
drinks 46
count of highest preference of Other 49
count of lowest preference of Other 7
From the values of most preferred counts, it can be seen that other drinks (milk, water
and many more) is the most preferred drinks among the students and the least preferred drinks
among students is Energy drinks.
Response to Question 4.
The problem is to find the level of loyalty of the students to their preferred brand. The
“Yes” response regarding the change of preference is represented by 1 and the “No” responses
are represented by 0. To find out how loyal the students are, it is enough to show the proportion
of the counts of “No” responses.
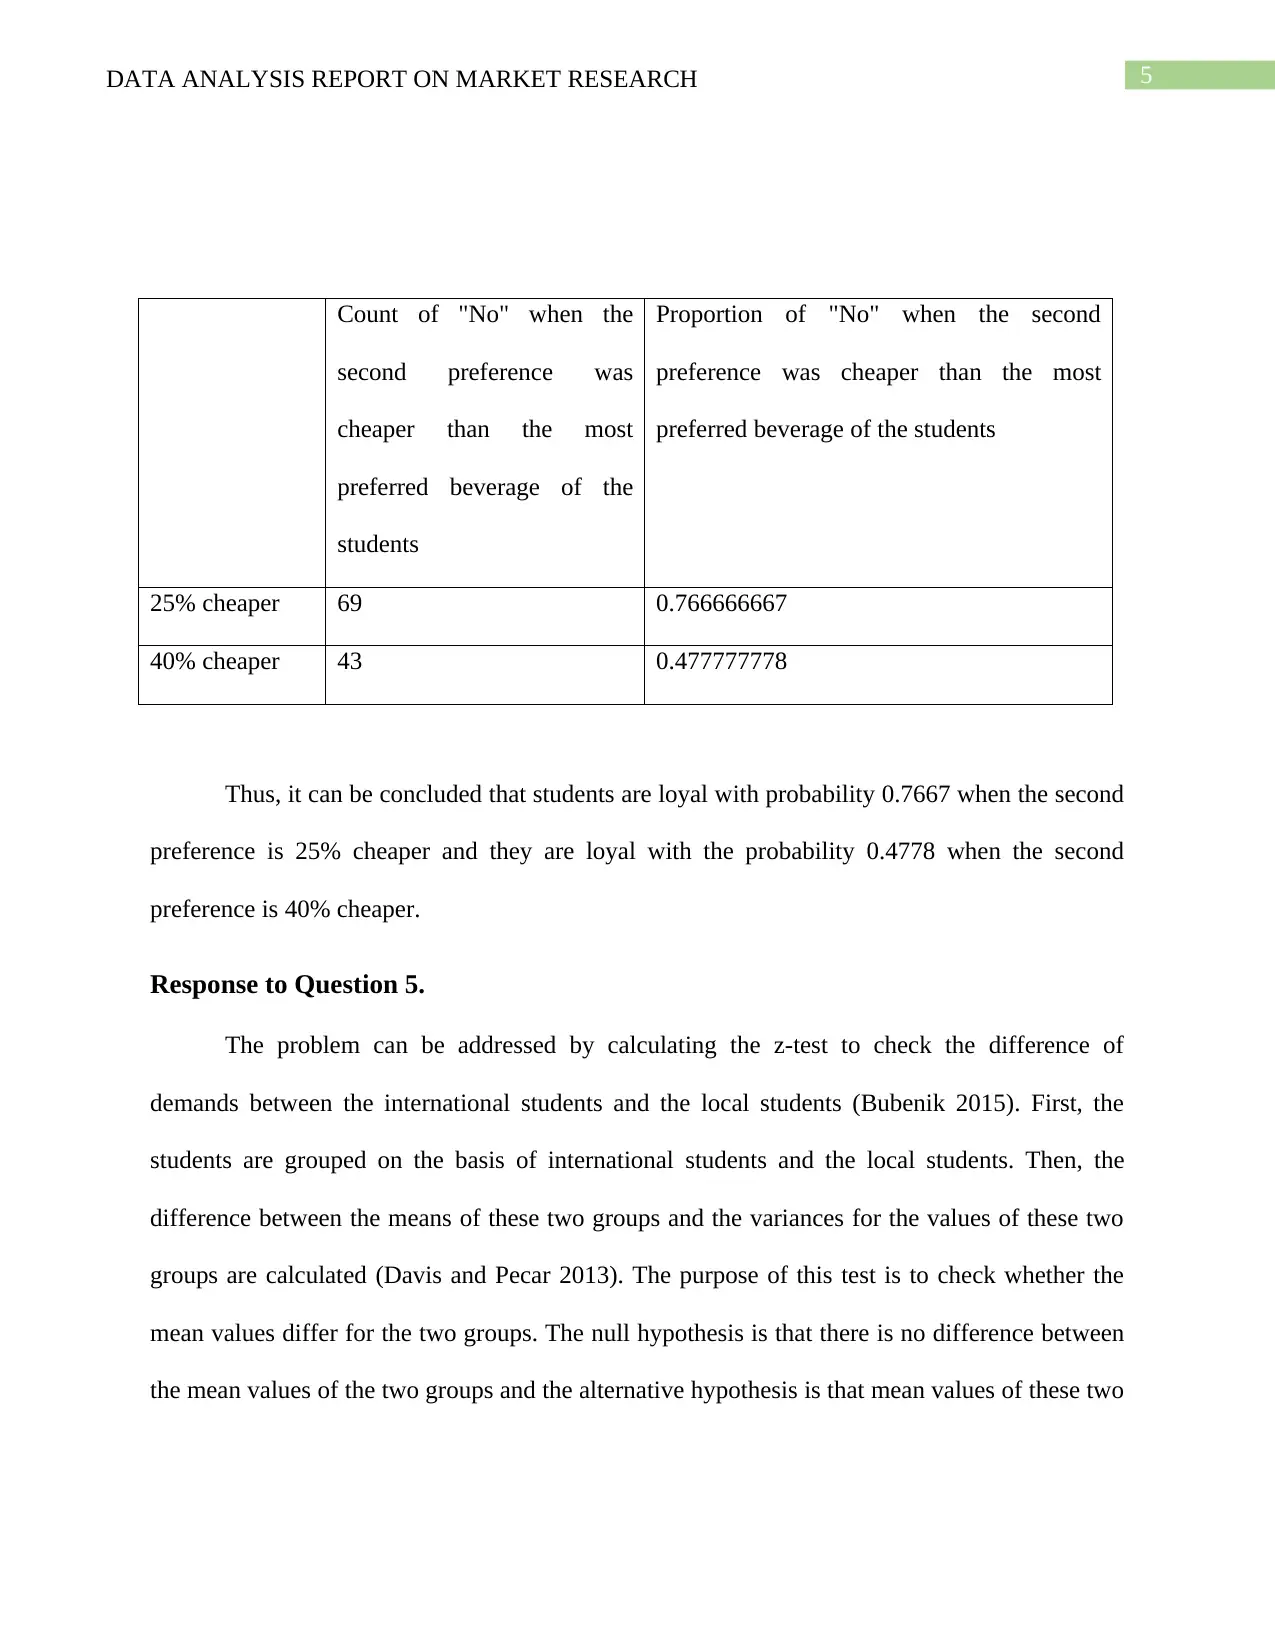
The counts and proportion of “No” responses are shown in the following table:
count of highest preference of soft
drinks= 15
count of lowest preference of soft drinks= 13
count of highest preference of Fruit Juice 8
count of lowest preference of Fruit Juice 4
count of highest preference of Tea /coffee 16
count of lowest preference of Tea /coffee 20
count of highest preference of Energy
drinks 2
count of lowest preference of Energy
drinks 46
count of highest preference of Other 49
count of lowest preference of Other 7
From the values of most preferred counts, it can be seen that other drinks (milk, water
and many more) is the most preferred drinks among the students and the least preferred drinks
among students is Energy drinks.
Response to Question 4.
The problem is to find the level of loyalty of the students to their preferred brand. The
“Yes” response regarding the change of preference is represented by 1 and the “No” responses
are represented by 0. To find out how loyal the students are, it is enough to show the proportion
of the counts of “No” responses.
The counts and proportion of “No” responses are shown in the following table:
5DATA ANALYSIS REPORT ON MARKET RESEARCH
Count of "No" when the
second preference was
cheaper than the most
preferred beverage of the
students
Proportion of "No" when the second
preference was cheaper than the most
preferred beverage of the students
25% cheaper 69 0.766666667
40% cheaper 43 0.477777778
Thus, it can be concluded that students are loyal with probability 0.7667 when the second
preference is 25% cheaper and they are loyal with the probability 0.4778 when the second
preference is 40% cheaper.
Response to Question 5.
The problem can be addressed by calculating the z-test to check the difference of
demands between the international students and the local students (Bubenik 2015). First, the
students are grouped on the basis of international students and the local students. Then, the
difference between the means of these two groups and the variances for the values of these two
groups are calculated (Davis and Pecar 2013). The purpose of this test is to check whether the
mean values differ for the two groups. The null hypothesis is that there is no difference between
the mean values of the two groups and the alternative hypothesis is that mean values of these two
⊘ This is a preview!⊘
Do you want full access?
Subscribe today to unlock all pages.
Trusted by 1+ million students worldwide
6DATA ANALYSIS REPORT ON MARKET RESEARCH
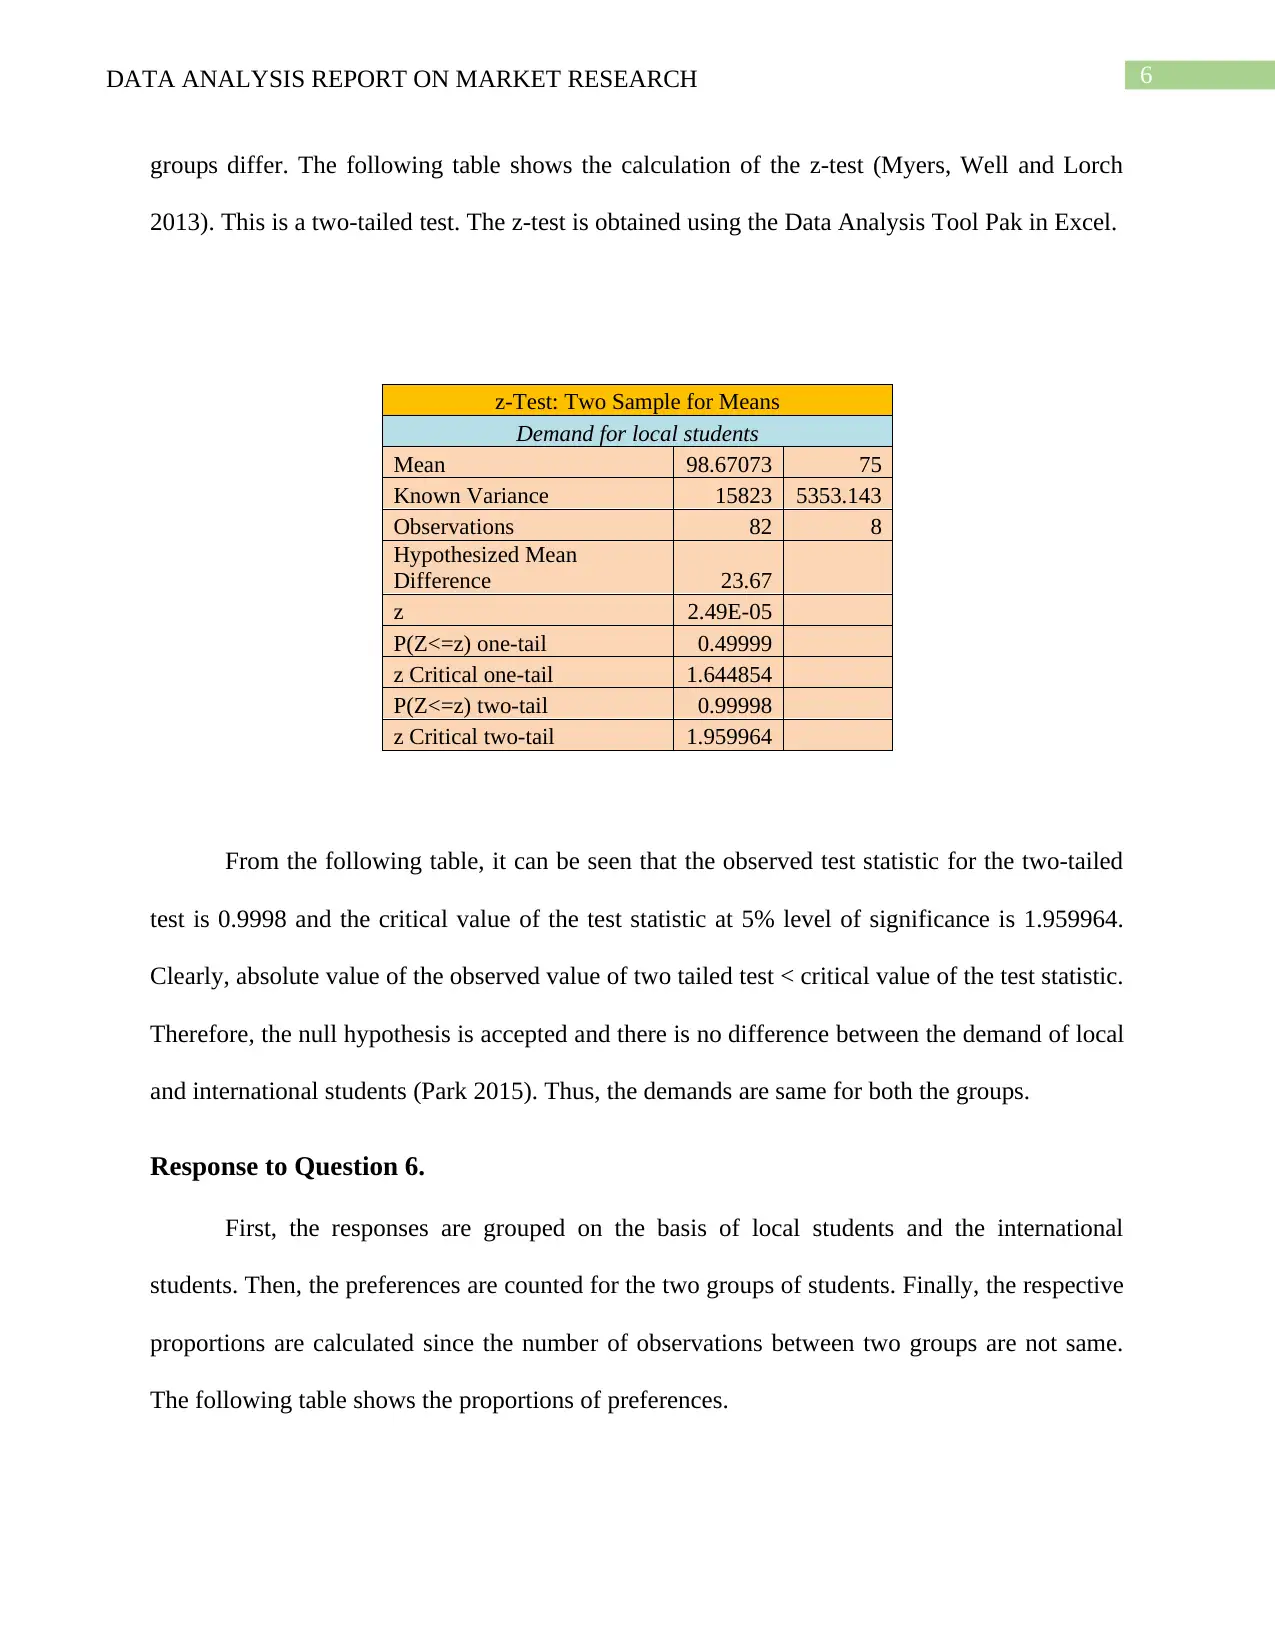
groups differ. The following table shows the calculation of the z-test (Myers, Well and Lorch
2013). This is a two-tailed test. The z-test is obtained using the Data Analysis Tool Pak in Excel.
From the following table, it can be seen that the observed test statistic for the two-tailed
test is 0.9998 and the critical value of the test statistic at 5% level of significance is 1.959964.
Clearly, absolute value of the observed value of two tailed test < critical value of the test statistic.
Therefore, the null hypothesis is accepted and there is no difference between the demand of local
and international students (Park 2015). Thus, the demands are same for both the groups.
Response to Question 6.
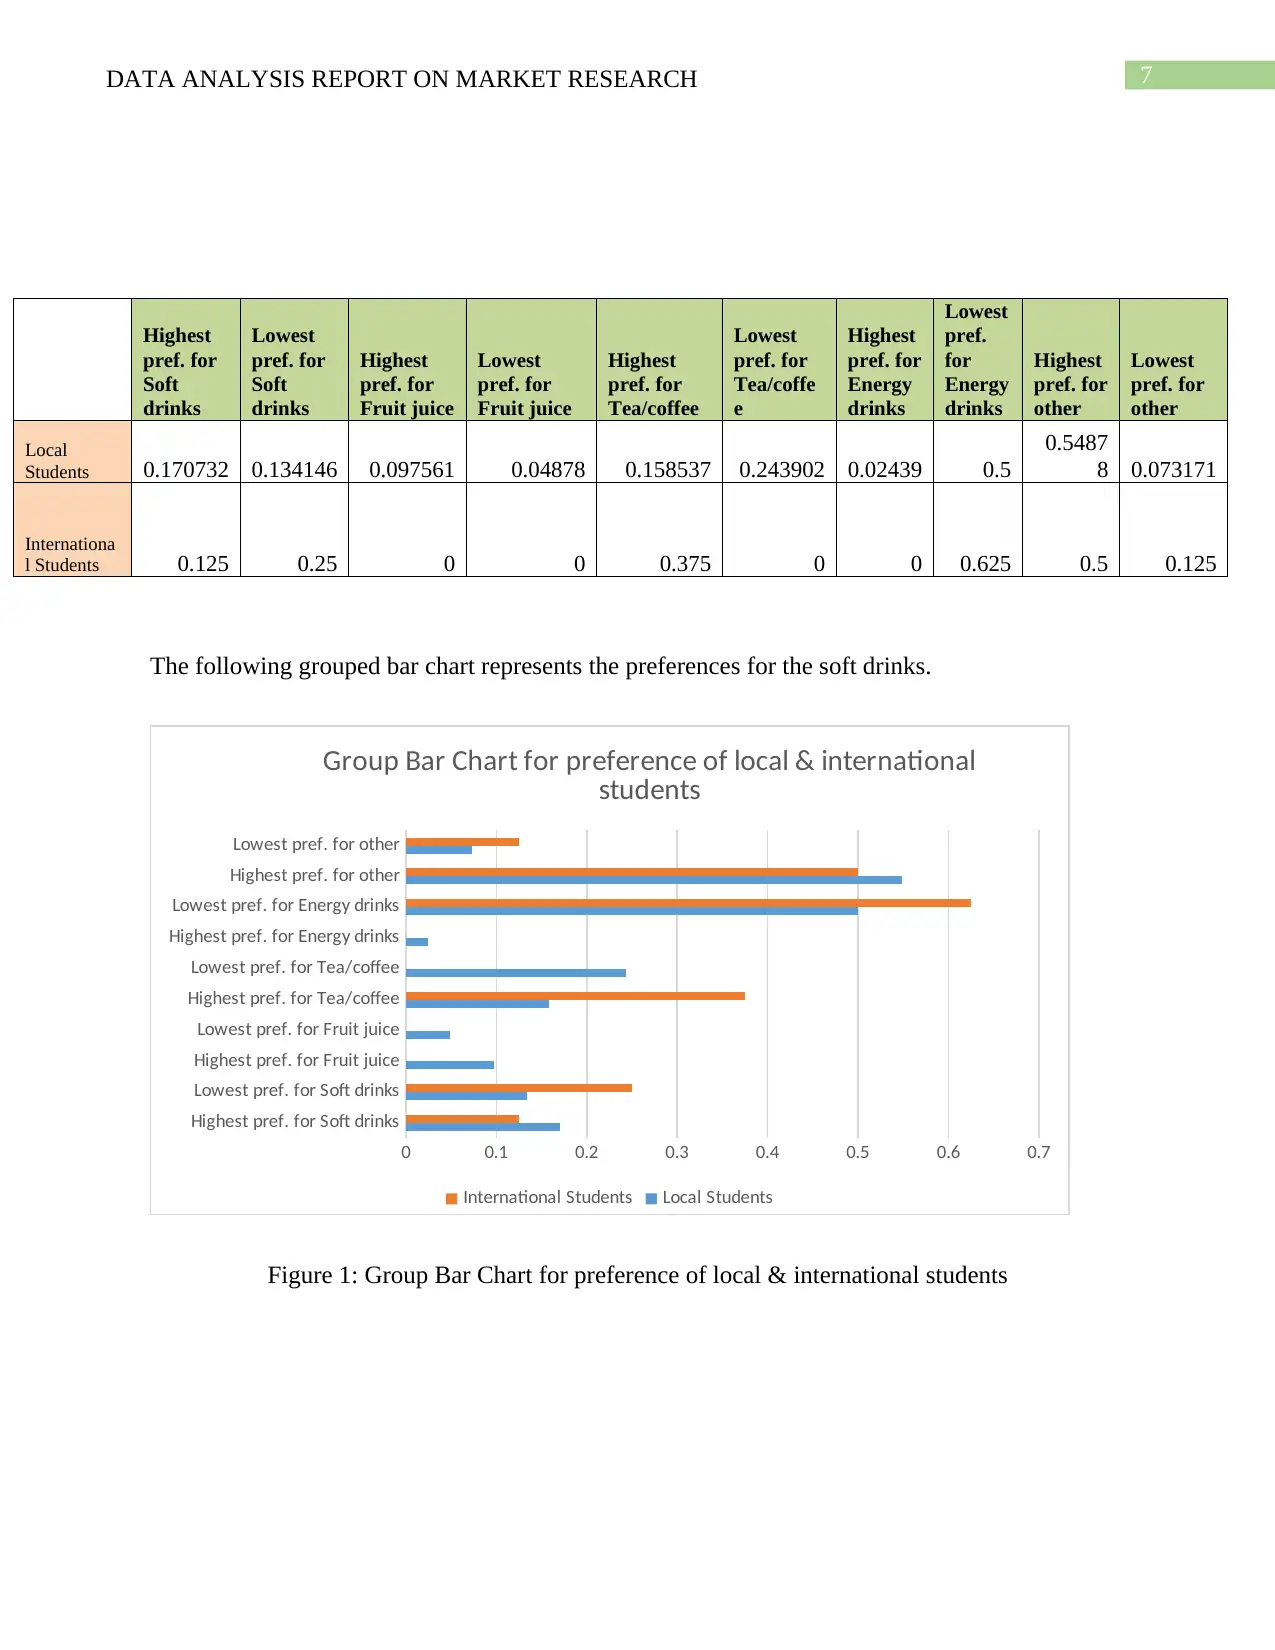
First, the responses are grouped on the basis of local students and the international
students. Then, the preferences are counted for the two groups of students. Finally, the respective
proportions are calculated since the number of observations between two groups are not same.
The following table shows the proportions of preferences.
z-Test: Two Sample for Means
Demand for local students
Mean 98.67073 75
Known Variance 15823 5353.143
Observations 82 8
Hypothesized Mean
Difference 23.67
z 2.49E-05
P(Z<=z) one-tail 0.49999
z Critical one-tail 1.644854
P(Z<=z) two-tail 0.99998
z Critical two-tail 1.959964
groups differ. The following table shows the calculation of the z-test (Myers, Well and Lorch
2013). This is a two-tailed test. The z-test is obtained using the Data Analysis Tool Pak in Excel.
From the following table, it can be seen that the observed test statistic for the two-tailed
test is 0.9998 and the critical value of the test statistic at 5% level of significance is 1.959964.
Clearly, absolute value of the observed value of two tailed test < critical value of the test statistic.
Therefore, the null hypothesis is accepted and there is no difference between the demand of local
and international students (Park 2015). Thus, the demands are same for both the groups.
Response to Question 6.
First, the responses are grouped on the basis of local students and the international
students. Then, the preferences are counted for the two groups of students. Finally, the respective
proportions are calculated since the number of observations between two groups are not same.
The following table shows the proportions of preferences.
z-Test: Two Sample for Means
Demand for local students
Mean 98.67073 75
Known Variance 15823 5353.143
Observations 82 8
Hypothesized Mean
Difference 23.67
z 2.49E-05
P(Z<=z) one-tail 0.49999
z Critical one-tail 1.644854
P(Z<=z) two-tail 0.99998
z Critical two-tail 1.959964
Paraphrase This Document
Need a fresh take? Get an instant paraphrase of this document with our AI Paraphraser
7DATA ANALYSIS REPORT ON MARKET RESEARCH
Highest
pref. for
Soft
drinks
Lowest
pref. for
Soft
drinks
Highest
pref. for
Fruit juice
Lowest
pref. for
Fruit juice
Highest
pref. for
Tea/coffee
Lowest
pref. for
Tea/coffe
e
Highest
pref. for
Energy
drinks
Lowest
pref.
for
Energy
drinks
Highest
pref. for
other
Lowest
pref. for
other
Local
Students 0.170732 0.134146 0.097561 0.04878 0.158537 0.243902 0.02439 0.5
0.5487
8 0.073171
Internationa
l Students 0.125 0.25 0 0 0.375 0 0 0.625 0.5 0.125
The following grouped bar chart represents the preferences for the soft drinks.
Highest pref. for Soft drinks
Lowest pref. for Soft drinks
Highest pref. for Fruit juice
Lowest pref. for Fruit juice
Highest pref. for Tea/coffee
Lowest pref. for Tea/coffee
Highest pref. for Energy drinks
Lowest pref. for Energy drinks
Highest pref. for other
Lowest pref. for other
0 0.1 0.2 0.3 0.4 0.5 0.6 0.7
Group Bar Chart for preference of local & international
students
International Students Local Students
Figure 1: Group Bar Chart for preference of local & international students
Highest
pref. for
Soft
drinks
Lowest
pref. for
Soft
drinks
Highest
pref. for
Fruit juice
Lowest
pref. for
Fruit juice
Highest
pref. for
Tea/coffee
Lowest
pref. for
Tea/coffe
e
Highest
pref. for
Energy
drinks
Lowest
pref.
for
Energy
drinks
Highest
pref. for
other
Lowest
pref. for
other
Local
Students 0.170732 0.134146 0.097561 0.04878 0.158537 0.243902 0.02439 0.5
0.5487
8 0.073171
Internationa
l Students 0.125 0.25 0 0 0.375 0 0 0.625 0.5 0.125
The following grouped bar chart represents the preferences for the soft drinks.
Highest pref. for Soft drinks
Lowest pref. for Soft drinks
Highest pref. for Fruit juice
Lowest pref. for Fruit juice
Highest pref. for Tea/coffee
Lowest pref. for Tea/coffee
Highest pref. for Energy drinks
Lowest pref. for Energy drinks
Highest pref. for other
Lowest pref. for other
0 0.1 0.2 0.3 0.4 0.5 0.6 0.7
Group Bar Chart for preference of local & international
students
International Students Local Students
Figure 1: Group Bar Chart for preference of local & international students
8DATA ANALYSIS REPORT ON MARKET RESEARCH
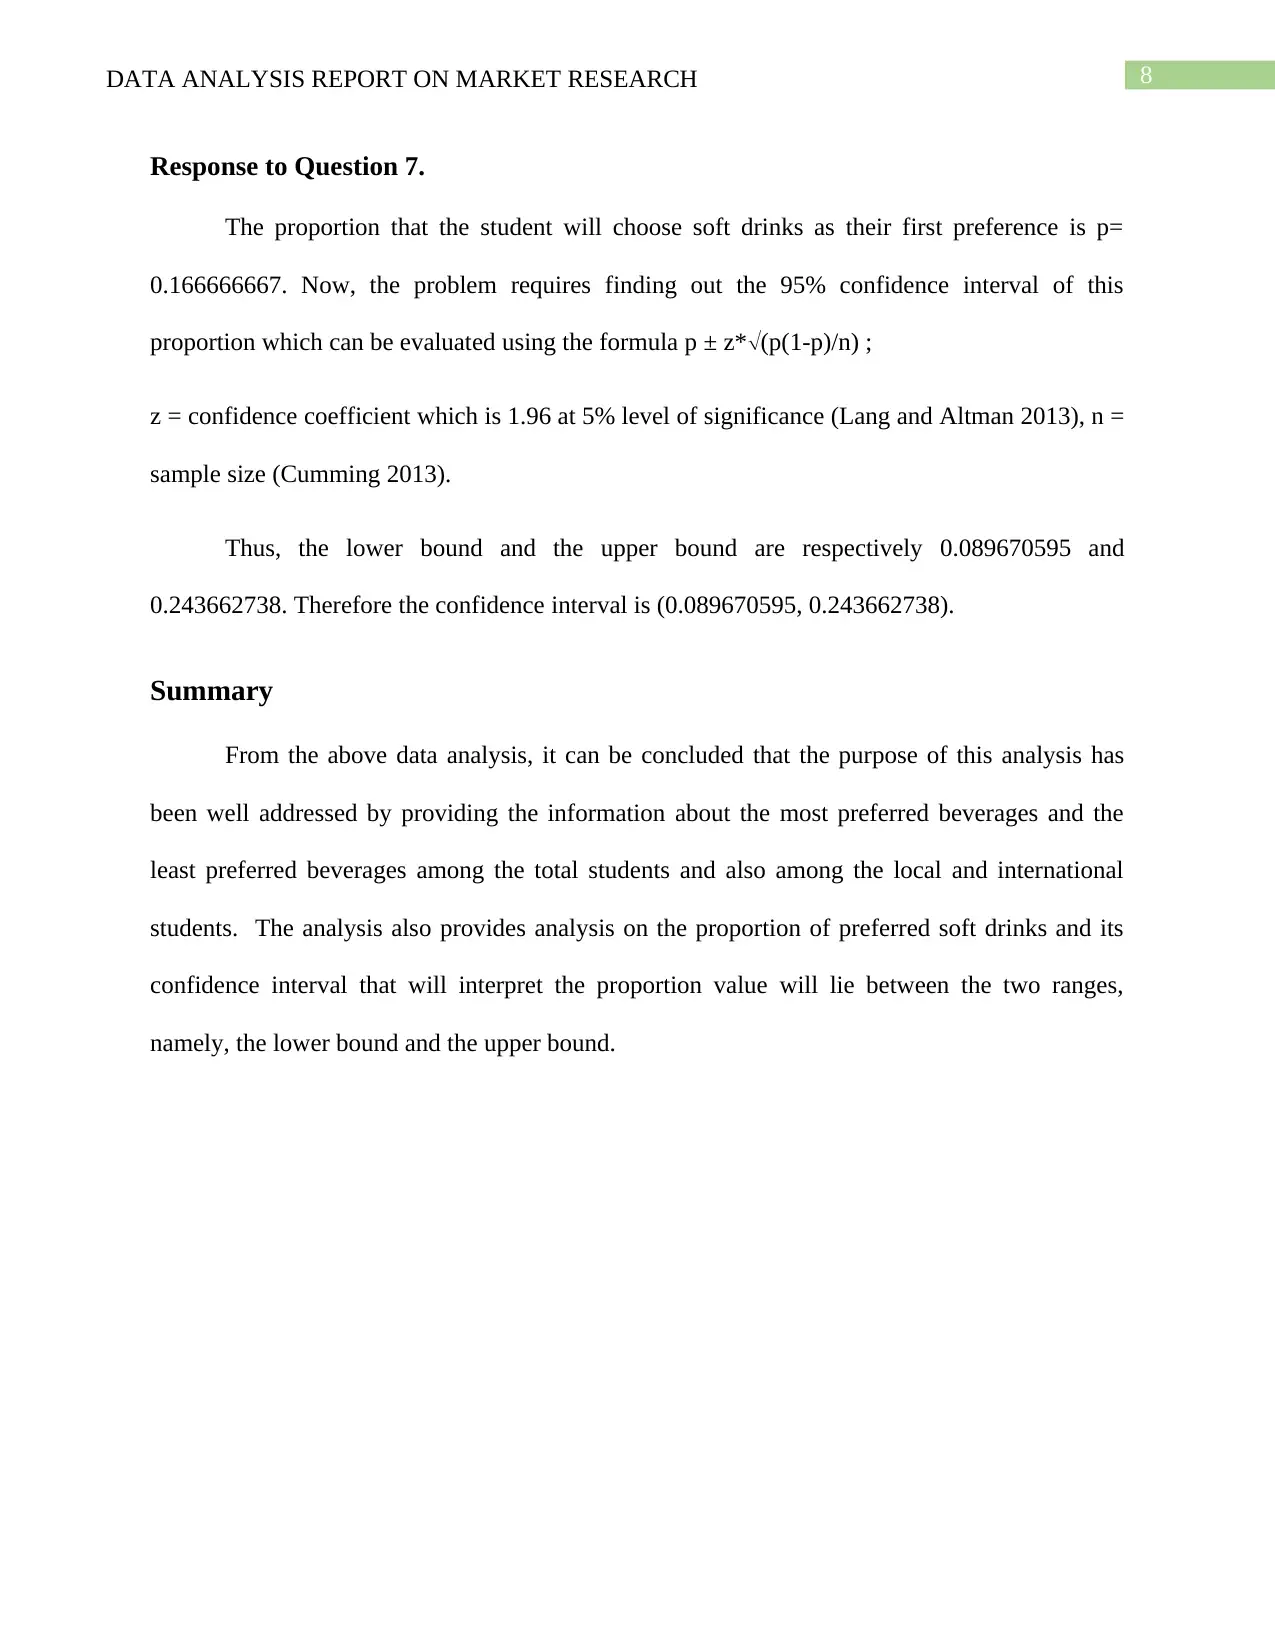
Response to Question 7.
The proportion that the student will choose soft drinks as their first preference is p=
0.166666667. Now, the problem requires finding out the 95% confidence interval of this
proportion which can be evaluated using the formula p ± z*(p(1-p)/n) ;
z = confidence coefficient which is 1.96 at 5% level of significance (Lang and Altman 2013), n =
sample size (Cumming 2013).
Thus, the lower bound and the upper bound are respectively 0.089670595 and
0.243662738. Therefore the confidence interval is (0.089670595, 0.243662738).
Summary
From the above data analysis, it can be concluded that the purpose of this analysis has
been well addressed by providing the information about the most preferred beverages and the
least preferred beverages among the total students and also among the local and international
students. The analysis also provides analysis on the proportion of preferred soft drinks and its
confidence interval that will interpret the proportion value will lie between the two ranges,
namely, the lower bound and the upper bound.
⊘ This is a preview!⊘
Do you want full access?
Subscribe today to unlock all pages.
Trusted by 1+ million students worldwide
9DATA ANALYSIS REPORT ON MARKET RESEARCH
References
Bluttman, K., 2013. Excel formulas and functions for dummies. John Wiley & Sons.
Bubenik, P., 2015. Statistical topological data analysis using persistence landscapes. The Journal
of Machine Learning Research, 16(1), pp.77-102.
Carlberg, C., 2014. Statistical analysis: microsoft excel 2013. Que Publishing.
Cohen, J., Cohen, P., West, S.G. and Aiken, L.S., 2013. Applied multiple regression/correlation
analysis for the behavioral sciences. Routledge.
Cumming, G., 2013. Understanding the new statistics: Effect sizes, confidence intervals, and
meta-analysis. Routledge.
Davis, G. and Pecar, B., 2013. Business statistics using Excel. Oxford University Press.
Lang, T.A. and Altman, D.G., 2013. Basic statistical reporting for articles published in
biomedical journals: the “Statistical Analyses and Methods in the Published Literature” or the
SAMPL Guidelines”. Handbook, European Association of Science Editors, 256, p.256.
Mélard, G., 2014. On the accuracy of statistical procedures in Microsoft Excel 2010.
Computational statistics, 29(5), pp.1095-1128.
Myers, J.L., Well, A.D. and Lorch Jr, R.F., 2013. Research design and statistical analysis.
Routledge.
Park, H.M., 2015. Hypothesis testing and statistical power of a test.
1 out of 10
Related Documents


Your All-in-One AI-Powered Toolkit for Academic Success.
+13062052269
info@desklib.com
Available 24*7 on WhatsApp / Email
![[object Object]](/_next/static/media/star-bottom.7253800d.svg)
Unlock your academic potential
Copyright © 2020–2026 A2Z Services. All Rights Reserved. Developed and managed by ZUCOL.