Using and Managing Data and Information Contents Assignment

Verified

Added on  2022/12/22

|11
|512
|26
Homework Assignment
AI Summary
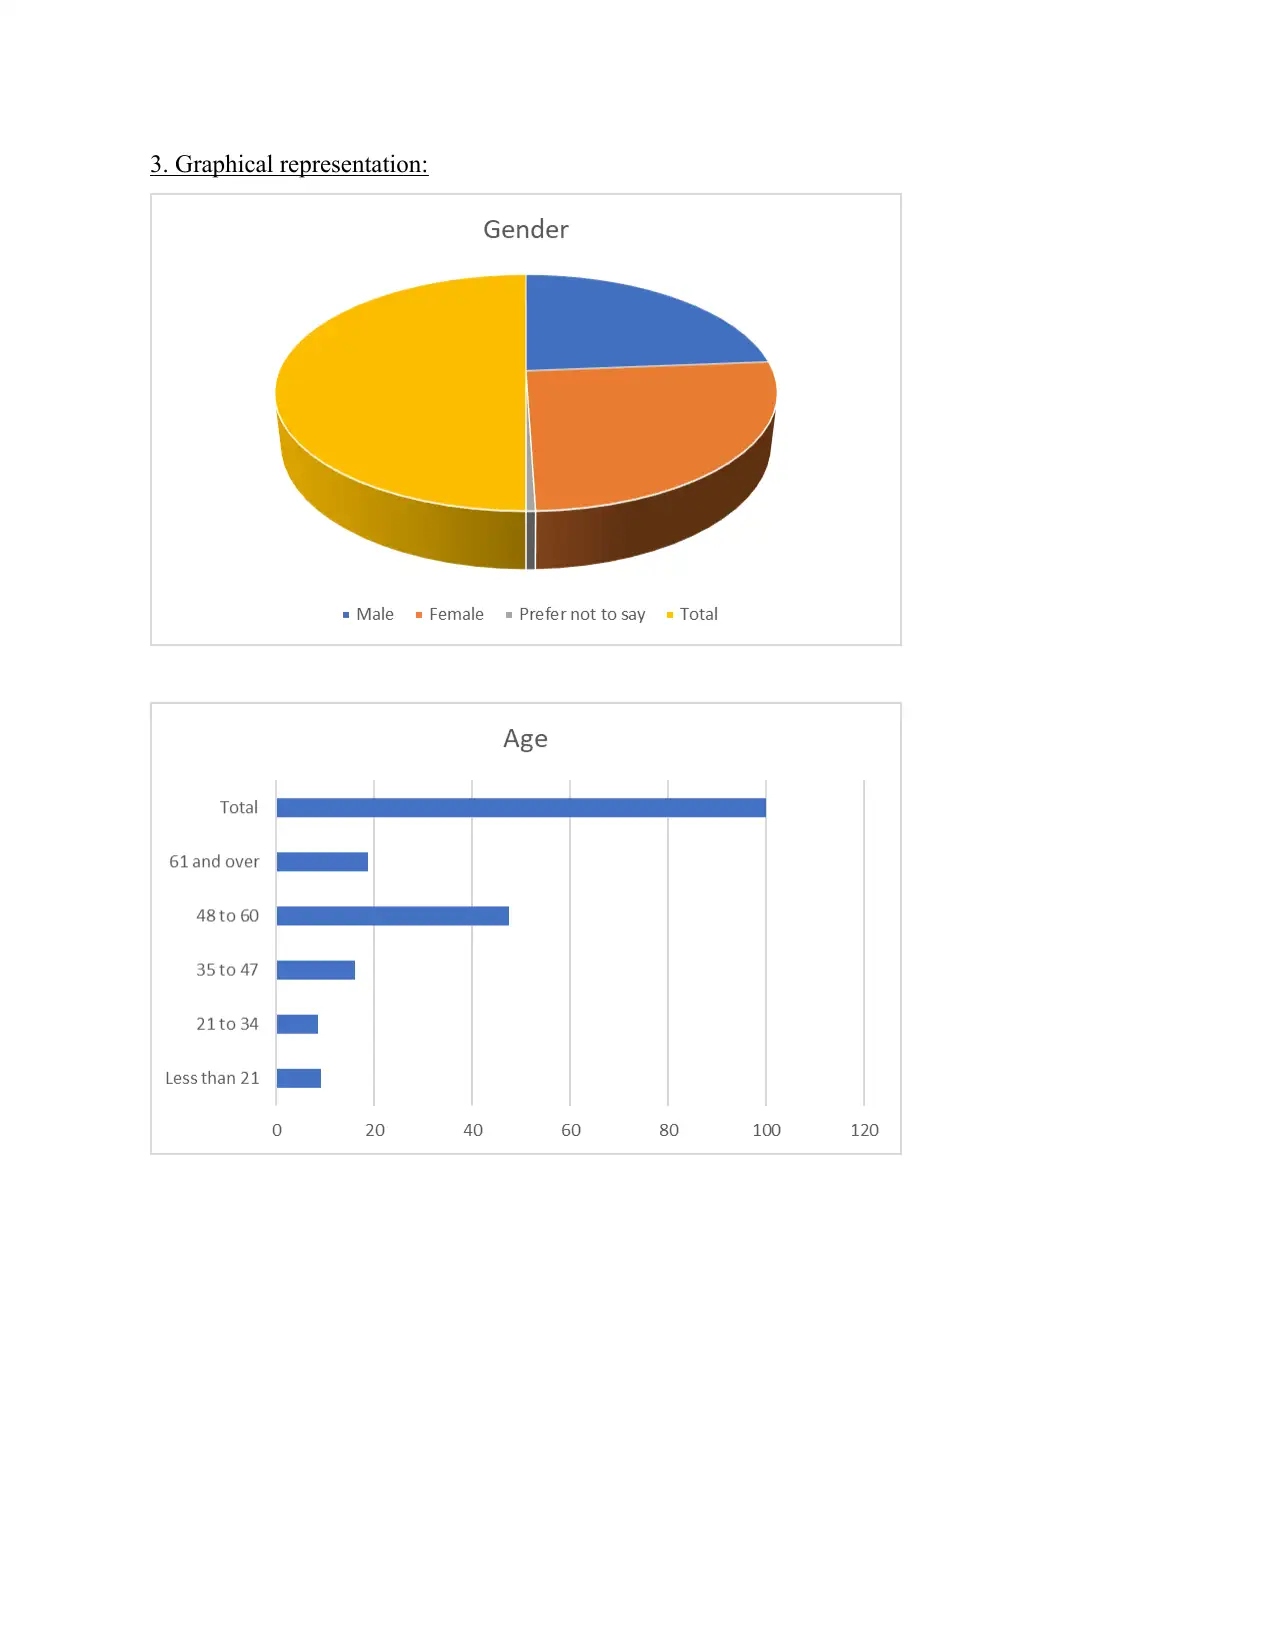
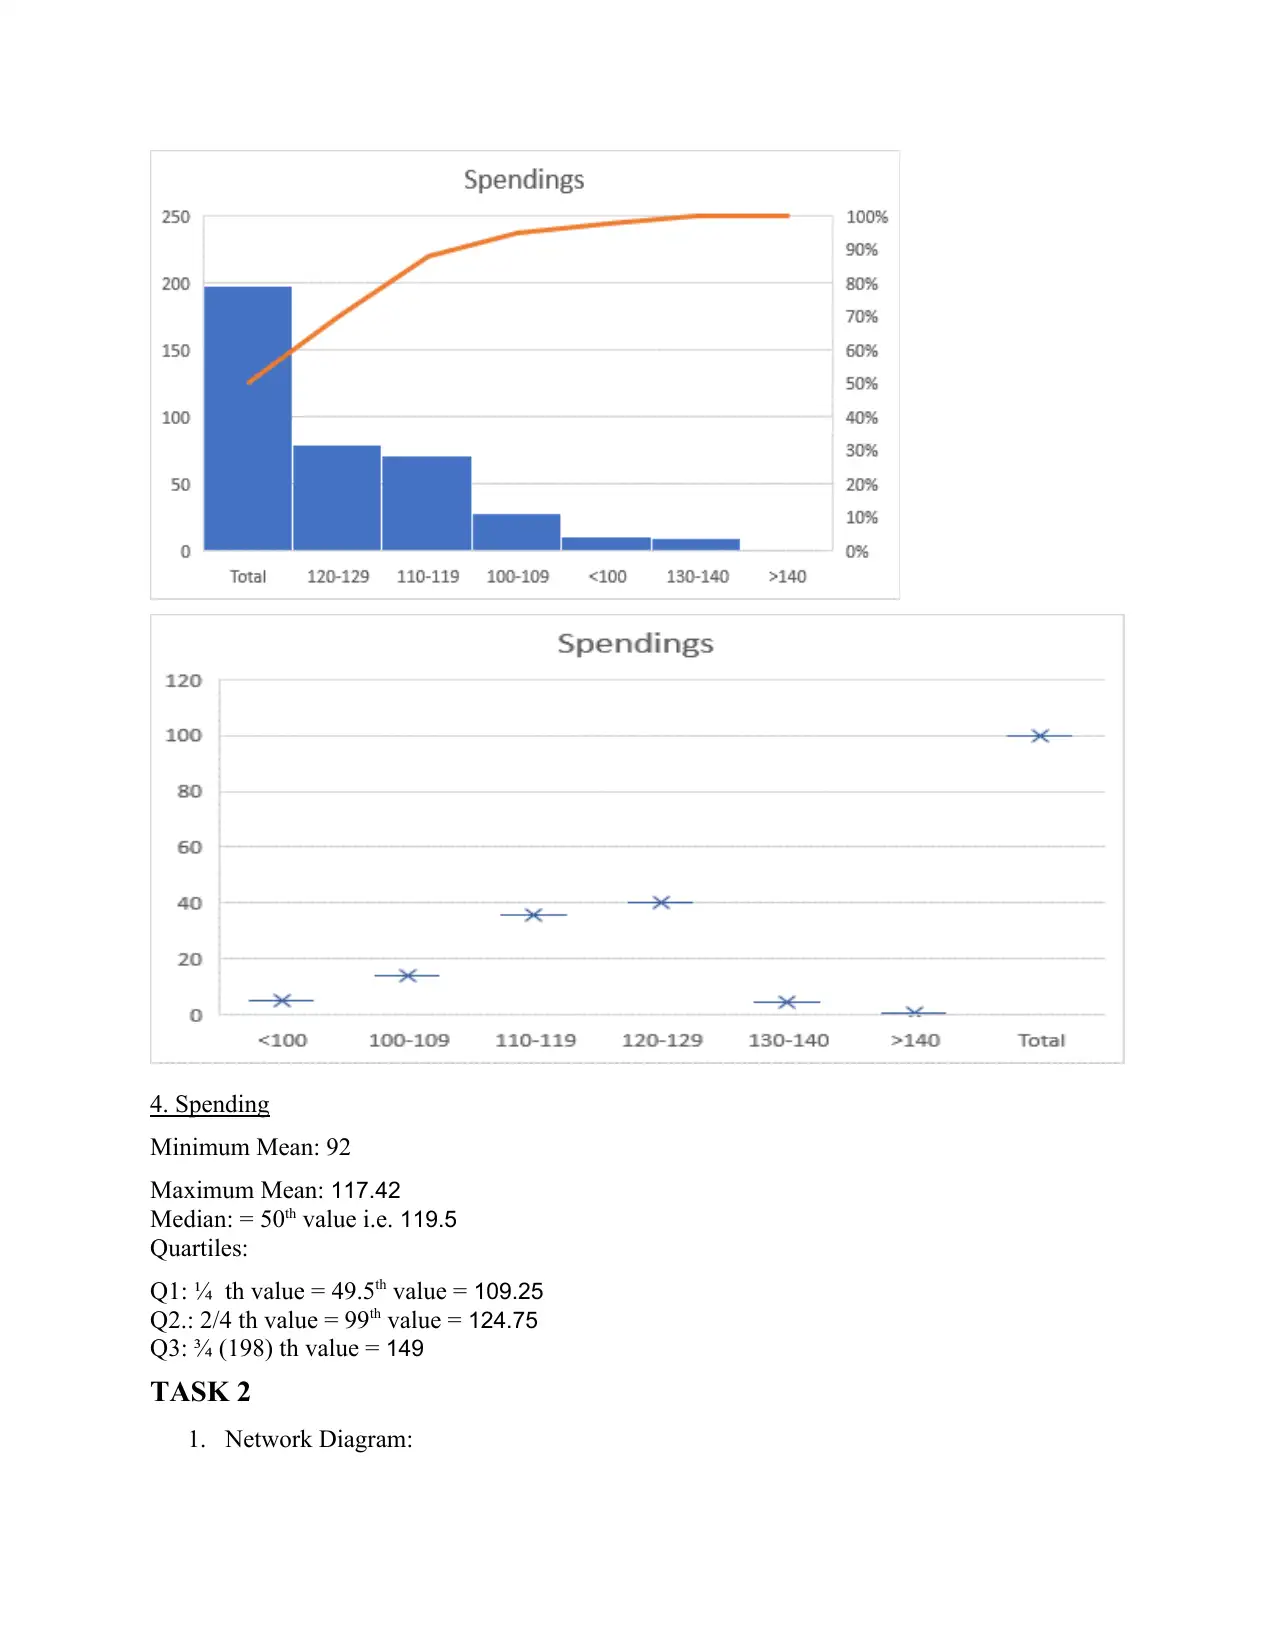
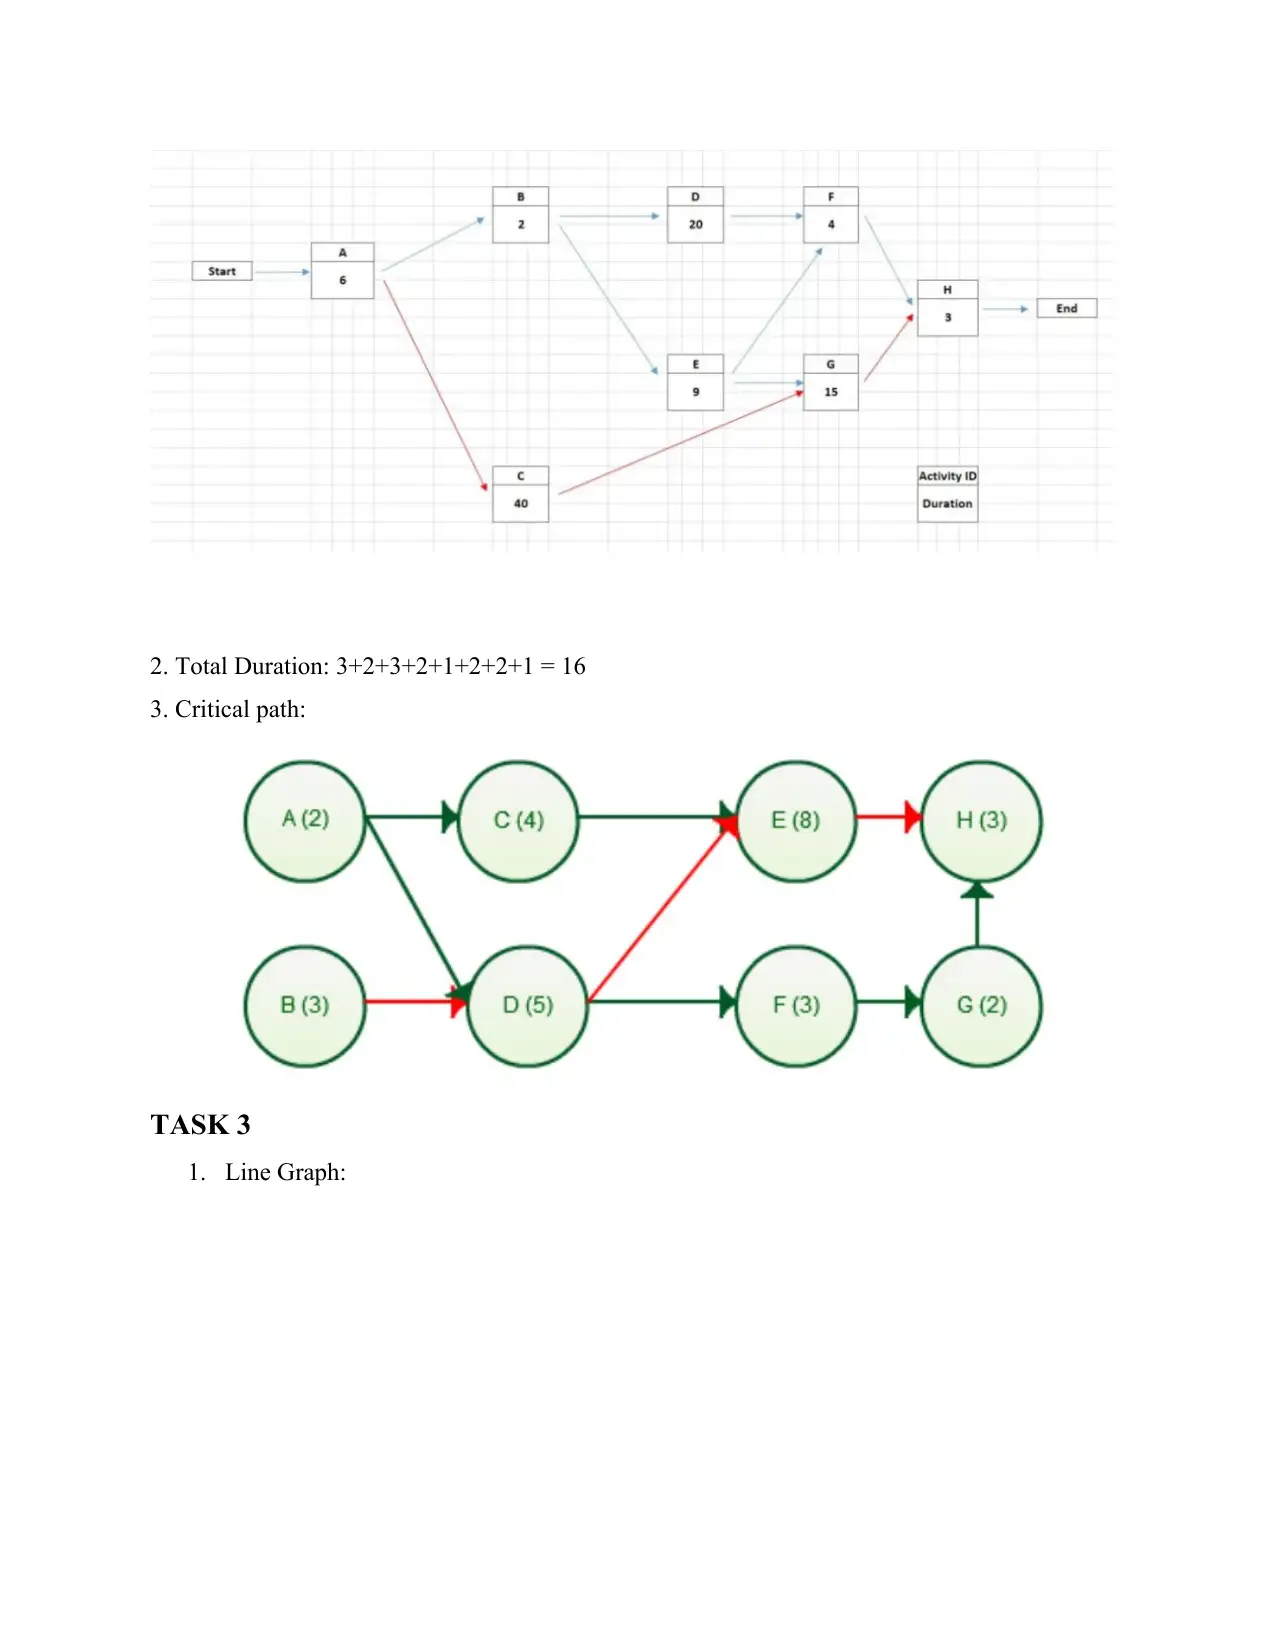
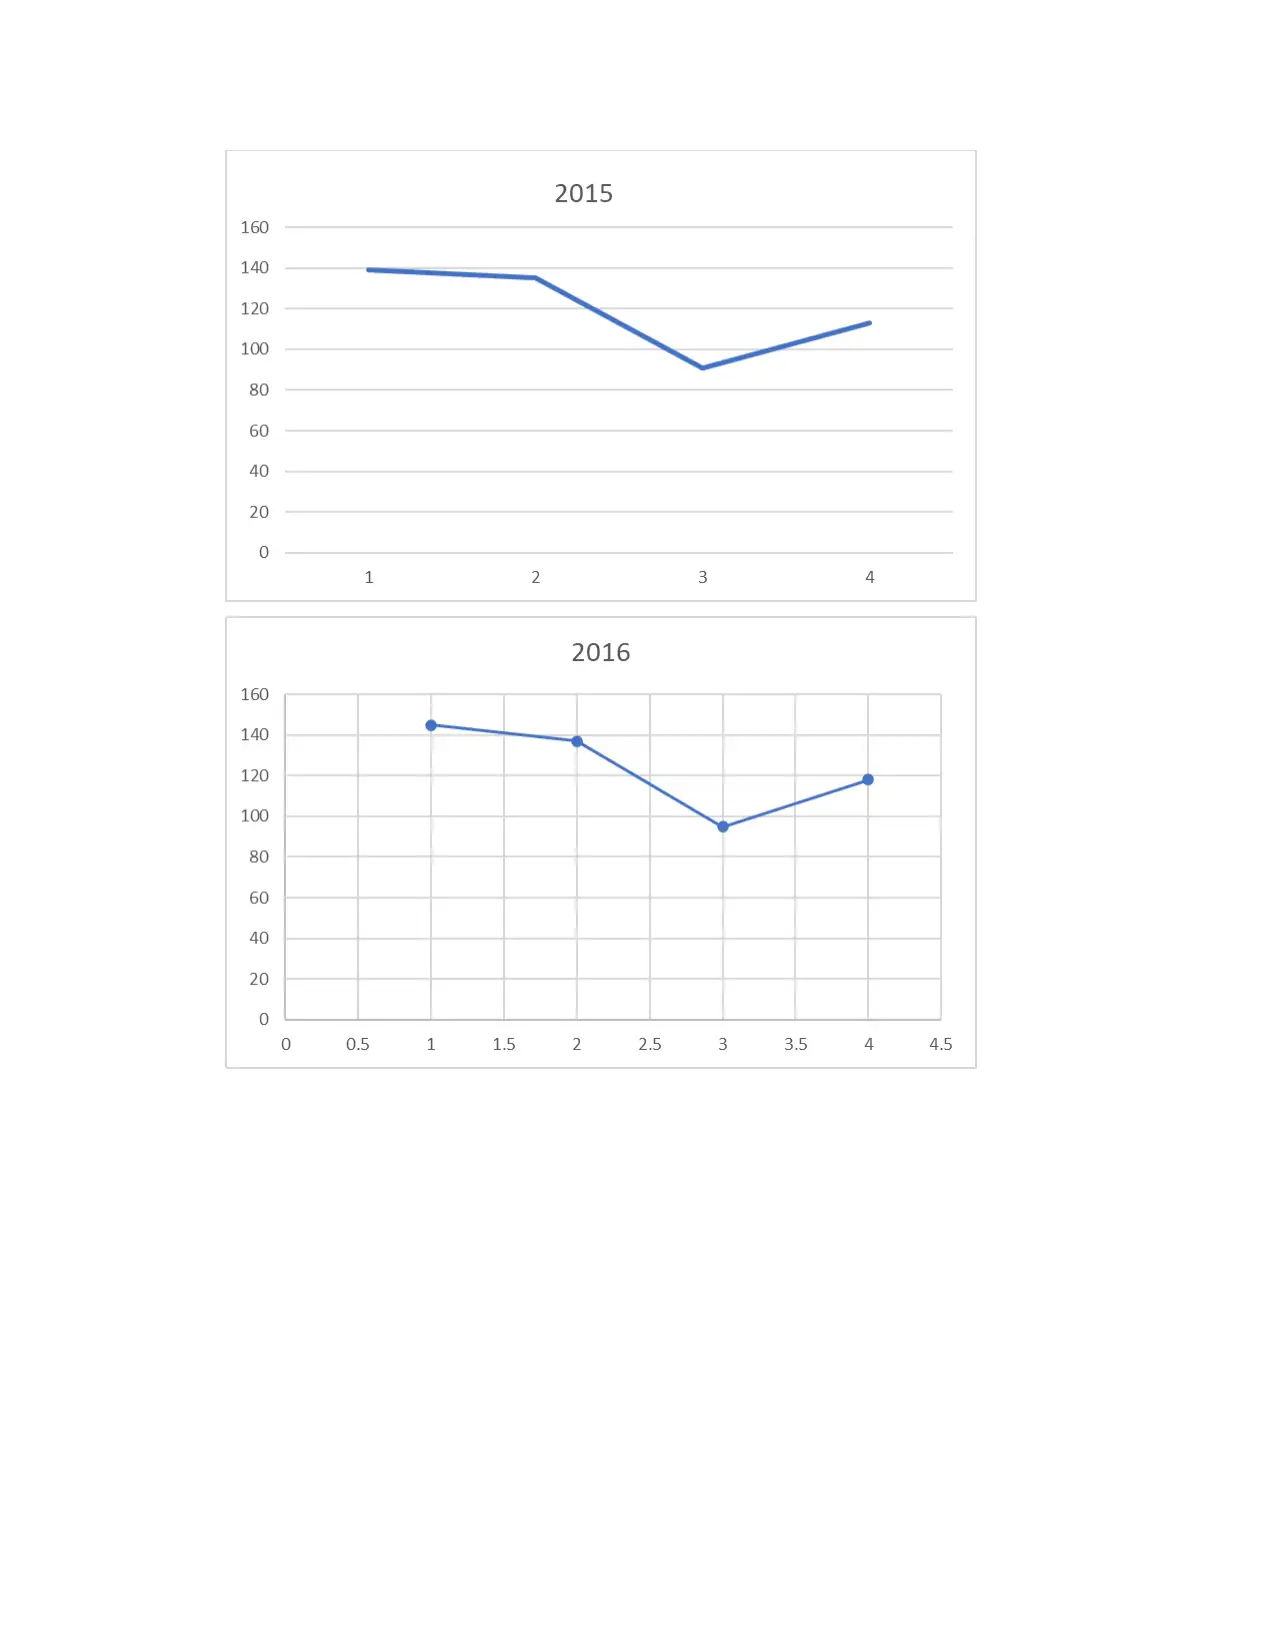
This document presents a comprehensive solution to a data analysis and information management homework assignment. The solution encompasses various tasks, including labeling codes for categories, constructing frequency and percentage frequency tables, and creating graphical representations such as bar charts and scatter diagrams. The assignment further delves into statistical analysis, calculating spending metrics like minimum, maximum, mean, median, and quartiles. Network diagrams, critical path analysis, and line graphs with moving averages are also included. Additionally, the document features a decision tree and a profit maximization analysis using linear programming to determine optimal product quantities. This solution provides a detailed approach to data analysis and information management principles.
tabler-icon-diamond-filled.svg

Contribute Materials

Your contribution can guide someone’s learning journey. Share your documents today.
Document Page
Using and Managing Data and
Information
tabler-icon-diamond-filled.svg

Secure Best Marks with AI Grader

Need help grading? Try our AI Grader for instant feedback on your assignments.
Document Page
Contents
TASK 1
............................................................................................................................................ 3
1. Label the codes for categories:
........................................................................................... 3
2. Frequency and percentage frequency tables:
......................................................................3
3. Graphical representation:
....................................................................................................5
4. Spending
............................................................................................................................. 6
5. Cross Table:
........................................................................................................................7
6. Scatter Diagram:
.................................................................................................................8
TASK 2
............................................................................................................................................ 8
TASK 3
............................................................................................................................................ 9
TASK 4
.......................................................................................................................................... 13
Document Page
TASK 1
1. Label the codes for categories:

Gender:
1. Male?
2. Female? 3. Prefer not to say
Age:
1. Less than 21
2. 21 to 34 3. 35 to 47 4. 48 to 60 5. 61 and over
Education:
1. GCSE or below
2. A’ level or Diploma 3. Degree or further
Are you a regular user of self-checkout user?:
1. Yes
2. No
2. Frequency and percentage frequency tables:

Gender

Frequency
Percentage
Male
20 40.00%
Female
29 58.00%
Prefer not to

say

1
2.00%
Total
50 100%
Age
Frequency Percentage
Less than

21

4
8.00%
21 to 34
3 6.00%
35 to 47
6 12.00%
48 to 60
23 46.00%
61 and

over

14
28.00%
Total
50 100
Education
Frequency Percentage
Document Page
GCSE or below 13 26.00%
A’ level or

Diploma

18
36.00%
Degree or further
19 38.00%
Total
50 100%
SSC

User

Frequency
Percentage
Yes
15 30.00%
No
35 70.00%
Total
50 100
Spending
Frequency Percentage
<100
5 10.00%
100-109
8 16.00%
110-119
12 24.00%
120-129
20 40.00%
130-140
4 8.00%
>140
1 2.0%
Total
50 100
tabler-icon-diamond-filled.svg

Secure Best Marks with AI Grader

Need help grading? Try our AI Grader for instant feedback on your assignments.
Document Page
3. Graphical representation:
Document Page
4. Spending
Minimum Mean: 92

Maximum Mean:
117.42
Median: = 50
th value i.e. 119.5
Quartiles:

Q1: ¼ th value = 49.5
th value = 109.25
Q2.: 2/4 th value = 99
th value = 124.75
Q3: ¾ (198) th value =
149
TASK 2

1.
Network Diagram:
Document Page
2. Total Duration: 3+2+3+2+1+2+2+1 = 16
3. Critical path:

TASK 3

1.
Line Graph:
tabler-icon-diamond-filled.svg

Paraphrase This Document

Need a fresh take? Get an instant paraphrase of this document with our AI Paraphraser
Document Page
Document Page
Document Page
Moving Average:
Year
Quarter Sales Average Moving
Average

2015
1 239 219.5 201.13
2
235
3
191
4
213
2016
1 245 223.75
2
237
3
195
4
218
2017
1 250 227.25
2
241
3
199
4
219
2018
1 156 133.75
2
149
3
105
4
125
Line Graph:
tabler-icon-diamond-filled.svg

Secure Best Marks with AI Grader

Need help grading? Try our AI Grader for instant feedback on your assignments.
Document Page
TASK 4
Decision Tree:

TASK 5

1.

Packet
Brie Gouda
chevron_up_icon
1 out of 11
circle_padding
hide_on_mobile
zoom_out_icon
logo.png

Your All-in-One AI-Powered Toolkit for Academic Success.

Available 24*7 on WhatsApp / Email

[object Object]