Numeracy & Data Analysis: Statistical Measures and Linear Model

Verified

Added on  2023/06/18

|12
|1562
|467
Homework Assignment
AI Summary
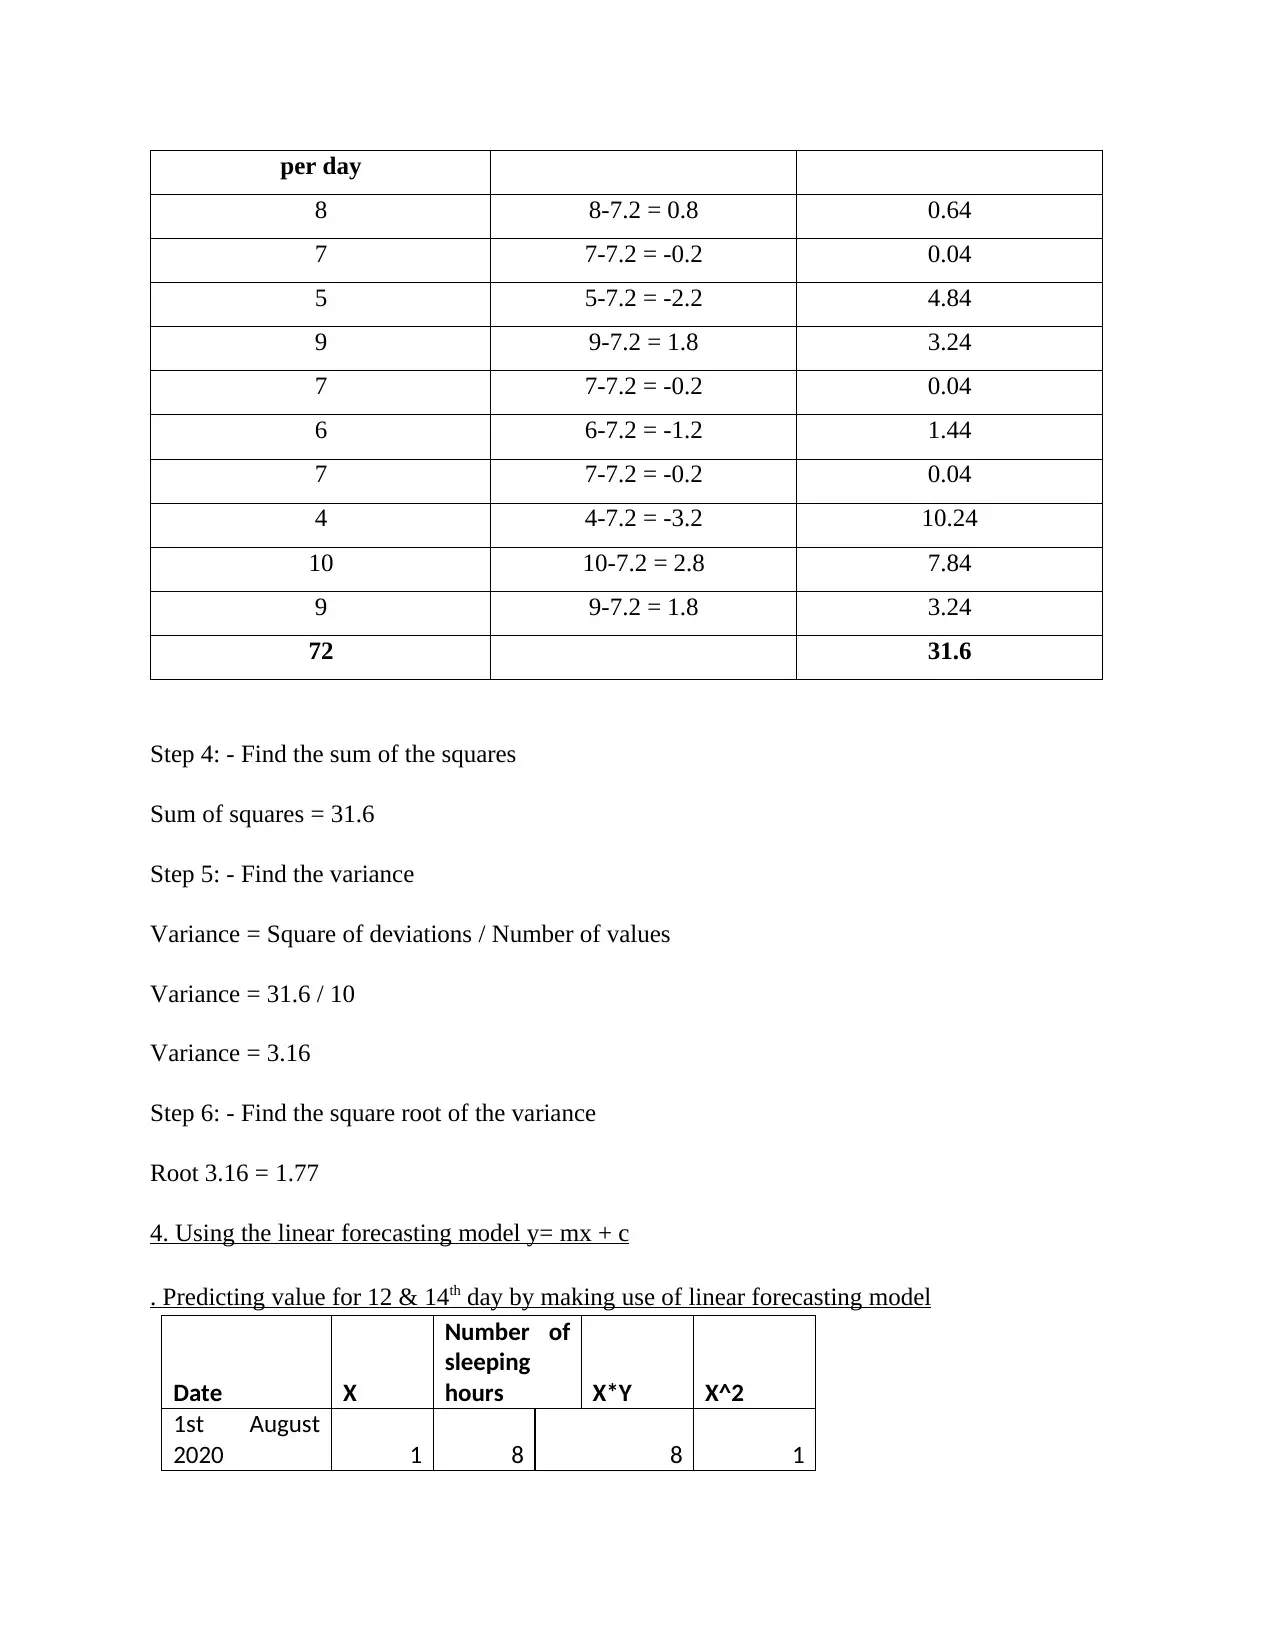
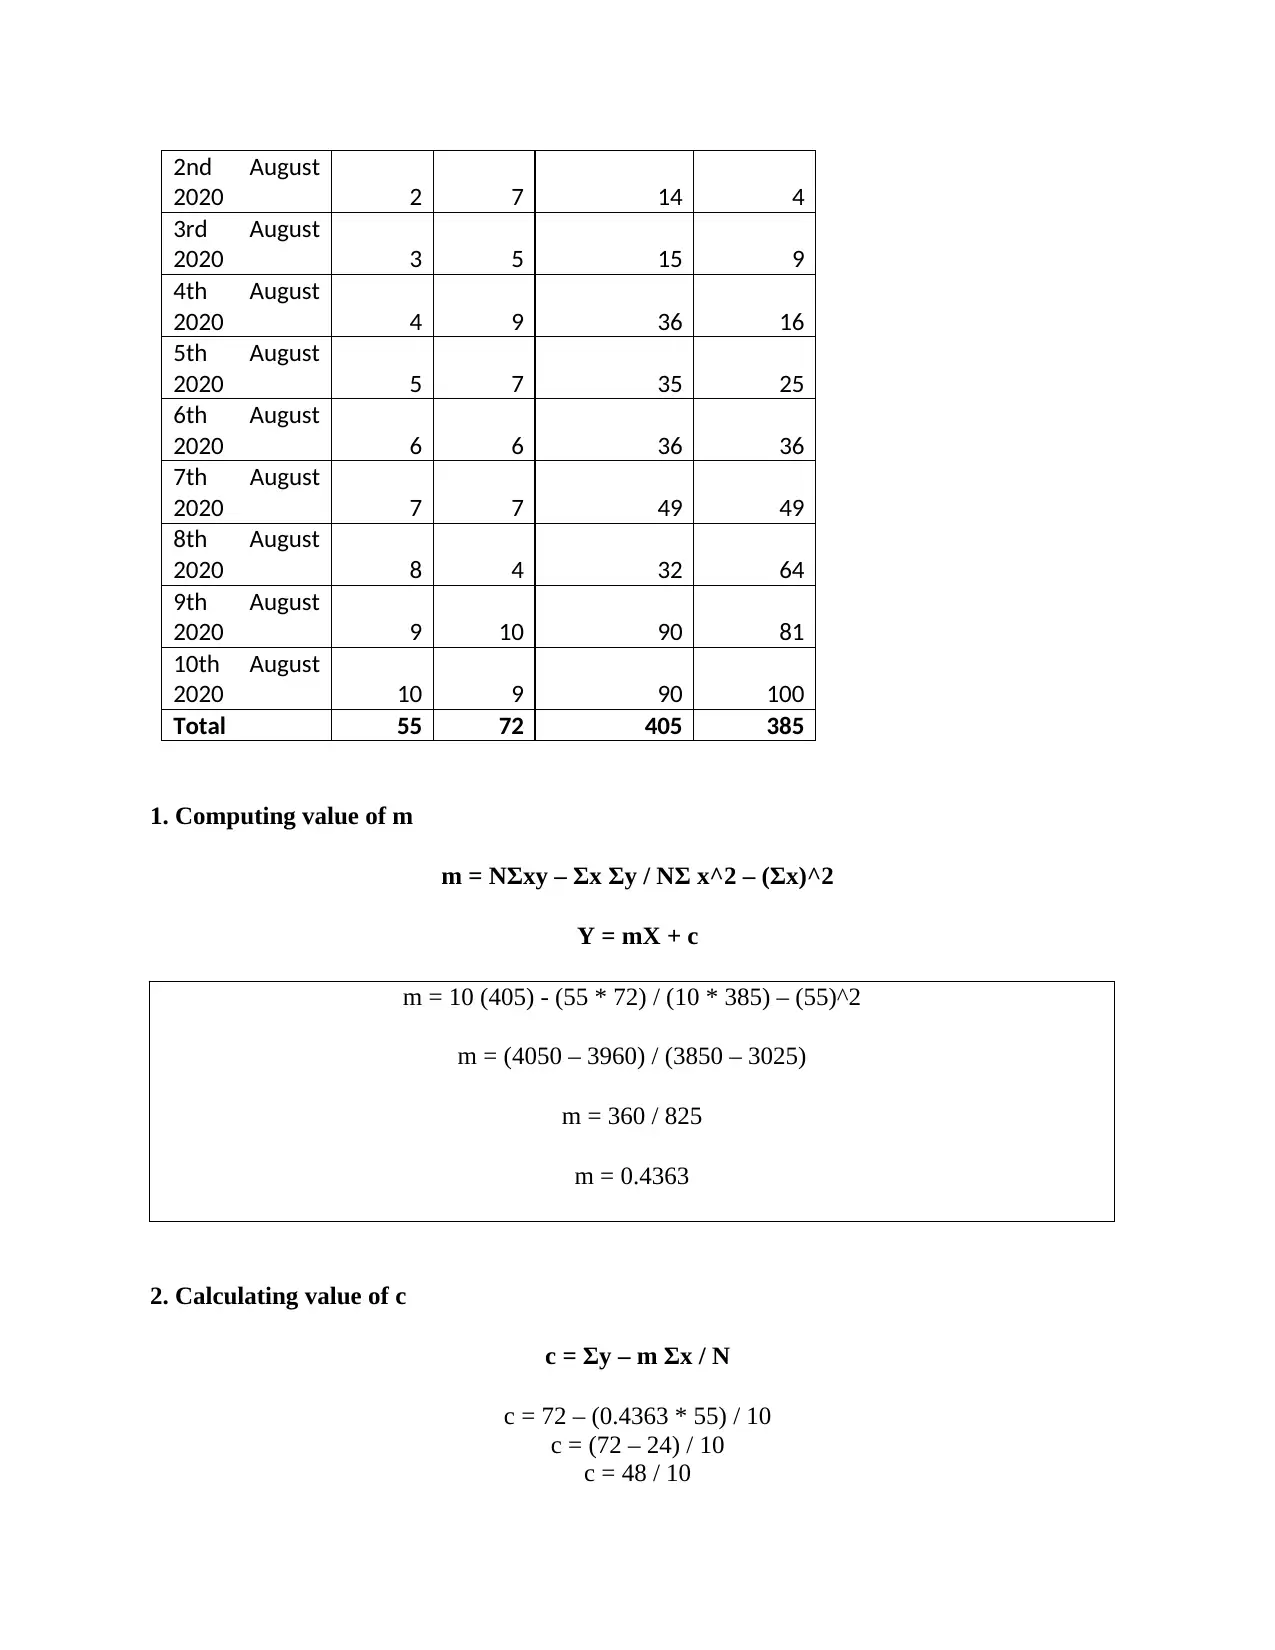
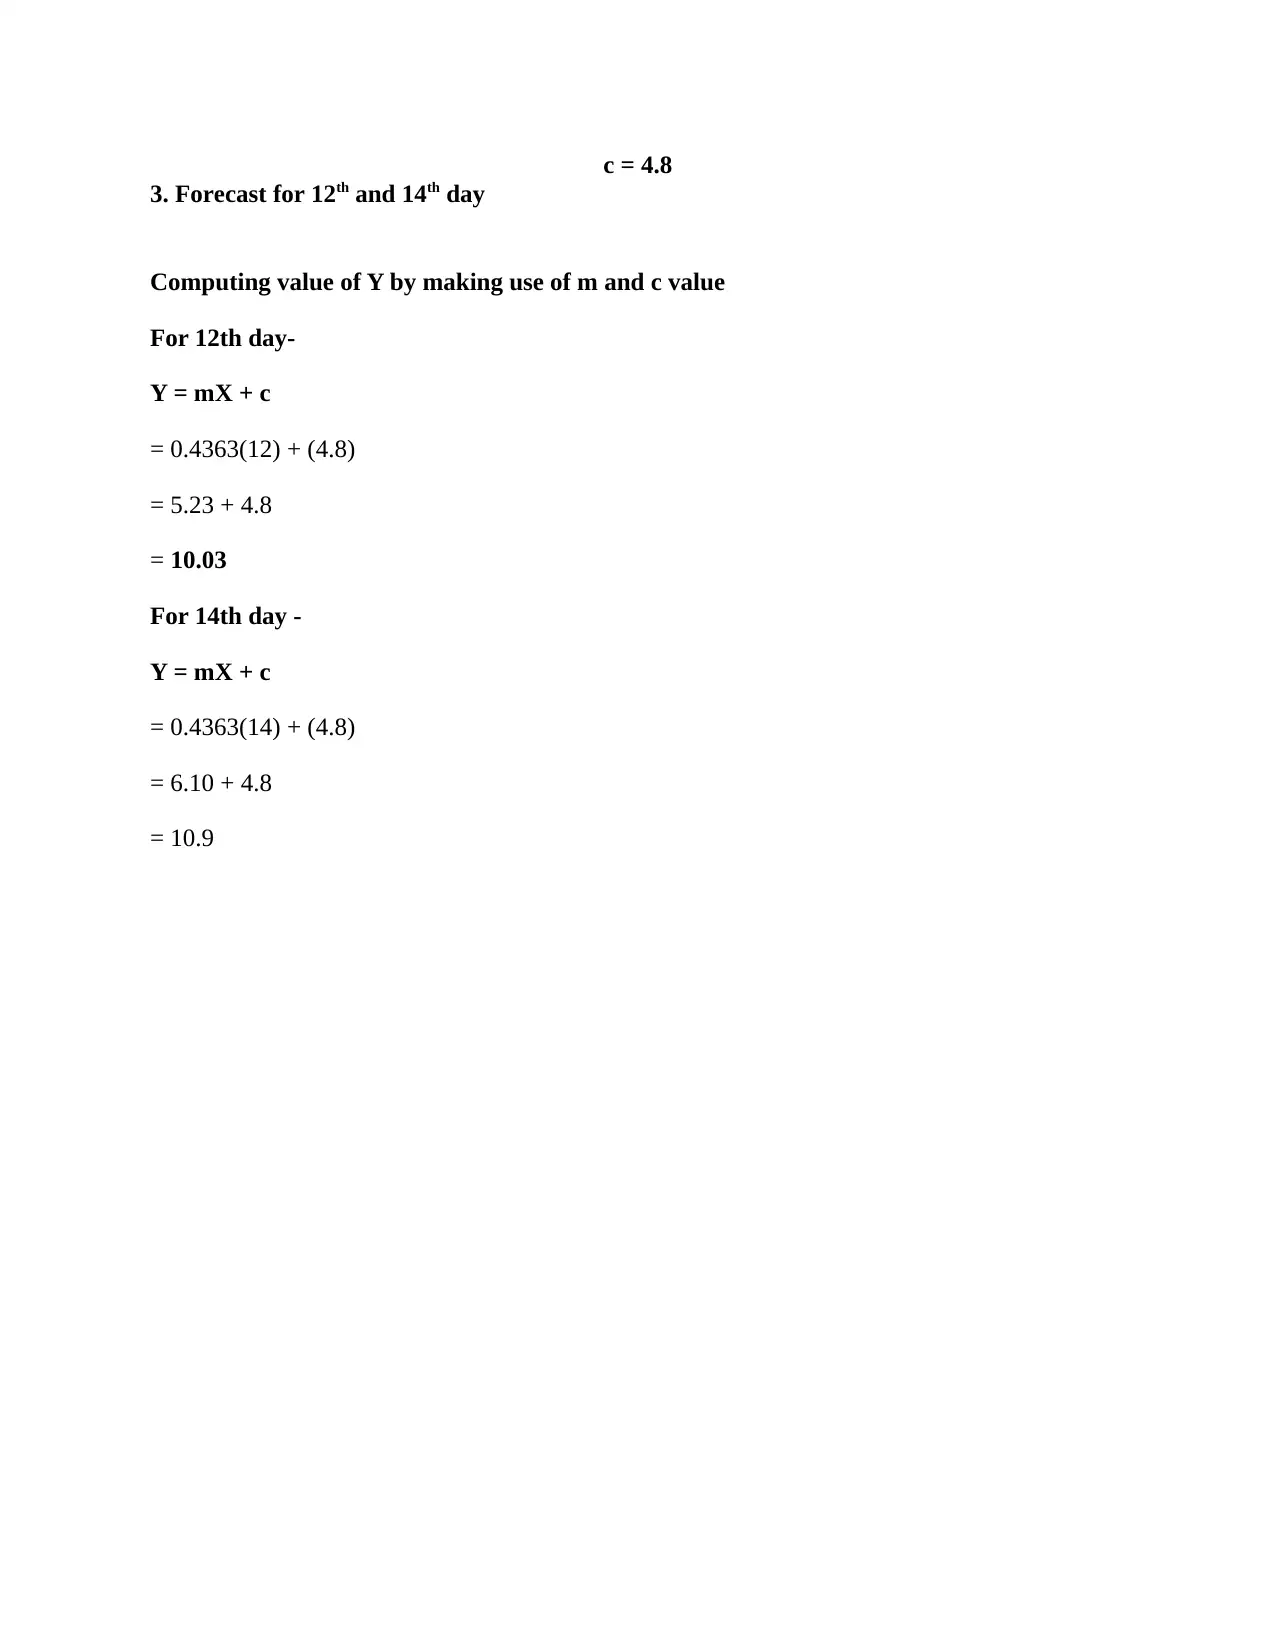
This assignment focuses on numeracy and data analysis, presenting a comprehensive approach to understanding and interpreting data. It begins by arranging data in a tabular format, followed by graphical representations using bar and line charts to visualize trends. The assignment then delves into calculating various statistical measures, including mean, median, mode, range, and standard deviation, providing step-by-step calculations and explanations. Furthermore, it utilizes a linear forecasting model (y = mx + c) to predict values for future data points, demonstrating practical application. The solution includes detailed calculations and interpretations of statistical measures and forecasting results. This resource is ideal for students seeking clarity and examples in data analysis techniques.
Document Page
NUMERACY AND DATA
ANALYSIS
tabler-icon-diamond-filled.svg

Paraphrase This Document

Need a fresh take? Get an instant paraphrase of this document with our AI Paraphraser
Document Page
TABLE OF CONTENTS
MAIN BODY..................................................................................................................................3
1. Arranging the data in tabular format.......................................................................................3
2. Representation of the data using charts...................................................................................3
3. Calculation of the different statistical measures......................................................................5
ΣX / N..........................................................................................................................................5
4. Using the linear forecasting model y= mx + c.........................................................................9
. Predicting value for 12 & 14th day by making use of linear forecasting model........................9
Document Page
MAIN BODY
1. Arranging the data in tabular format
The table below represents the total number of hours sleeping per day for the 10
consecutive days: -
Days Number of hours sleeping per day
1 8
2 7
3 5
4 9
5 7
6 6
7 7
8 4
9 10
10 9
Total 72
The total number of hours slept in the 10 consecutive days are equal to 72.
2. Representation of the data using charts
Bar Chart: - The bar charts can be referred to the graphical representation of the data in the form
of rectangular bars that differ in the height corresponding to the values that are respectively
stated in the data provided. It can be regarded as the summary of the data that is categorical in
nature through which the easy understanding can be developed in respect of the data (Grebitus
and Davis, 2019). It can be prepared in the four different types which are horizontal, vertical,
grouped and the stacked bar graph. This diagrammatic presentation is supportive as it shall be
presenting the movement that can evidently be noticed by the data analyzer.
Document Page
1
2
3
4
5
6
7
8
9
10
0 2 4 6 8 10 12
Number of hours sleeping per day
Line Chart: - The line charts are another form of the graphical representation which is done
through a continuous line which established the connection between the several data points. The
curved line formation efficiently displays the information so that the in-depth analysis of the
same can be done visually as well (Martin and Lazendic, 2018). These types of the charts are
mostly used in the financial analysis of the closing prices in the share market, showing the
significant movement of the prices.
1 2 3 4 5 6 7 8 9 10
0
2
4
6
8
10
12
Number of hours sleeping per day
tabler-icon-diamond-filled.svg

Paraphrase This Document

Need a fresh take? Get an instant paraphrase of this document with our AI Paraphraser
Document Page
3. Calculation of the different statistical measures
I) Mean: - Mean is the measure of central tendency which refers to the average of the data set
that is provided. It is calculated by dividing the sum of the values by number of the values given
in the data set.
Steps of calculation for the mean value
Step 1: - Determine the set of values for which the mean value is to be found
Step 2: - Add all the values to find the sum
Total number of hours slept in the 10 consecutive days = 72
Step 3: - Count the number of values in the group
Number of values in the group = 10
Step 4: - Divide the sum by the number of values
ΣX / N
= 72 / 10
= 7.2
II) Median: - According to the statistical measures median is the middle value of the series that
shall be separating the higher and lower values from exactly the half (Sawe, Chafe and Treviño,
2020).
Steps of calculation for the median
Step 1: - The set of data is to be arranged in either the ascending or the descending order
Number of hours sleeping per day
10
9
9
8
7
Document Page
7
7
6
5
4
Step 2: - In case of even number of items in the series, find the two middle values
7, 7 are the middle values
Step 3: - Add both the values and divide by 2 to calculate the median
7 + 7 = 14
14 / 2 = 7
So the median is 7.
III) Mode: - Mode is the statistical measure that shall be measuring the value which has most
frequently occurred in the data set.
Steps for calculation of the mode
Step 1: - Collect and organize the dataset
Step 2: - Determine the distinct values in dataset
Number of hours sleeping per day
10
9
8
7
6
5
4
Document Page
Step 3: - Count the frequency of occurrence for the distinct values
Number of hours sleeping per day Frequency of occurrence
10 1
9 2
8 1
7 3
6 1
5 1
4 1
So, the modal value is 7 since it has occurred most frequently in the series which is 3 times.
IV) Range: - Range measures the variation in the data series between the highest and the lowest
value.
Steps for calculation of the range
Step 1: - List the elements in the dataset in the ascending or the descending order
Number of hours sleeping per day
10
9
9
8
7
7
7
6
5
4
Step 2: - Identify the highest and the lowest numbers in the series
tabler-icon-diamond-filled.svg

Paraphrase This Document

Need a fresh take? Get an instant paraphrase of this document with our AI Paraphraser
Document Page
Highest number = 10
Lowest number = 4
Step 3: - Subtract the smallest number from the largest number in the series
Range = Highest – Lowest
Range = 10 – 4 = 6
V) Standard deviation
Steps for calculation of standard deviation
Step 1: - Find the mean
Mean = 7.2
Step 2: - Find each score’s deviation from the mean
Days Number of hours sleeping
per day
Deviation from the mean
1 8 8-7.2 = 0.8
2 7 7-7.2 = -0.2
3 5 5-7.2 = -2.2
4 9 9-7.2 = 1.8
5 7 7-7.2 = -0.2
6 6 6-7.2 = -1.2
7 7 7-7.2 = -0.2
8 4 4-7.2 = -3.2
9 10 10-7.2 = 2.8
10 9 9-7.2 = 1.8
Total 72
Step 3: - Square each deviation
Number of hours sleeping Deviation from the mean Square of deviations
Document Page
per day
8 8-7.2 = 0.8 0.64
7 7-7.2 = -0.2 0.04
5 5-7.2 = -2.2 4.84
9 9-7.2 = 1.8 3.24
7 7-7.2 = -0.2 0.04
6 6-7.2 = -1.2 1.44
7 7-7.2 = -0.2 0.04
4 4-7.2 = -3.2 10.24
10 10-7.2 = 2.8 7.84
9 9-7.2 = 1.8 3.24
72 31.6
Step 4: - Find the sum of the squares
Sum of squares = 31.6
Step 5: - Find the variance
Variance = Square of deviations / Number of values
Variance = 31.6 / 10
Variance = 3.16
Step 6: - Find the square root of the variance
Root 3.16 = 1.77
4. Using the linear forecasting model y= mx + c
. Predicting value for 12 & 14th day by making use of linear forecasting model
Date X
Number of
sleeping
hours X*Y X^2
1st August
2020 1 8 8 1
Document Page
2nd August
2020 2 7 14 4
3rd August
2020 3 5 15 9
4th August
2020 4 9 36 16
5th August
2020 5 7 35 25
6th August
2020 6 6 36 36
7th August
2020 7 7 49 49
8th August
2020 8 4 32 64
9th August
2020 9 10 90 81
10th August
2020 10 9 90 100
Total 55 72 405 385
1. Computing value of m
m = NΣxy – Σx Σy / NΣ x^2 – (Σx)^2
Y = mX + c
m = 10 (405) - (55 * 72) / (10 * 385) – (55)^2
m = (4050 – 3960) / (3850 – 3025)
m = 360 / 825
m = 0.4363
2. Calculating value of c
c = Σy – m Σx / N
c = 72 – (0.4363 * 55) / 10
c = (72 – 24) / 10
c = 48 / 10
tabler-icon-diamond-filled.svg

Paraphrase This Document

Need a fresh take? Get an instant paraphrase of this document with our AI Paraphraser
Document Page
c = 4.8
3. Forecast for 12th and 14th day
Computing value of Y by making use of m and c value
For 12th day-
Y = mX + c
= 0.4363(12) + (4.8)
= 5.23 + 4.8
= 10.03
For 14th day -
Y = mX + c
= 0.4363(14) + (4.8)
= 6.10 + 4.8
= 10.9
Document Page
REFERENCES
Sawe, N., Chafe, C. and Treviño, J., 2020. Using Data Sonification to Overcome Science
Literacy, Numeracy, and Visualization Barriers in Science Communication. Frontiers in
Communication. 5. p.46.
Martin, A. J. and Lazendic, G., 2018. Achievement in large-scale national numeracy assessment:
An ecological study of motivation and student, home, and school predictors. Journal of
Educational Psychology. 110(4). p.465.
Grebitus, C. and Davis, G. C., 2019. Does the new nutrition facts panel help compensate for low
numeracy skills? An eye‐tracking analysis. Agricultural economics. 50(3). pp.249-258.
chevron_up_icon
1 out of 12
circle_padding
hide_on_mobile
zoom_out_icon
[object Object]