Data Analysis and Linear Forecasting: Statistics Assignment

Verified

Added on  2023/01/12

|8
|1356
|77
Homework Assignment
AI Summary
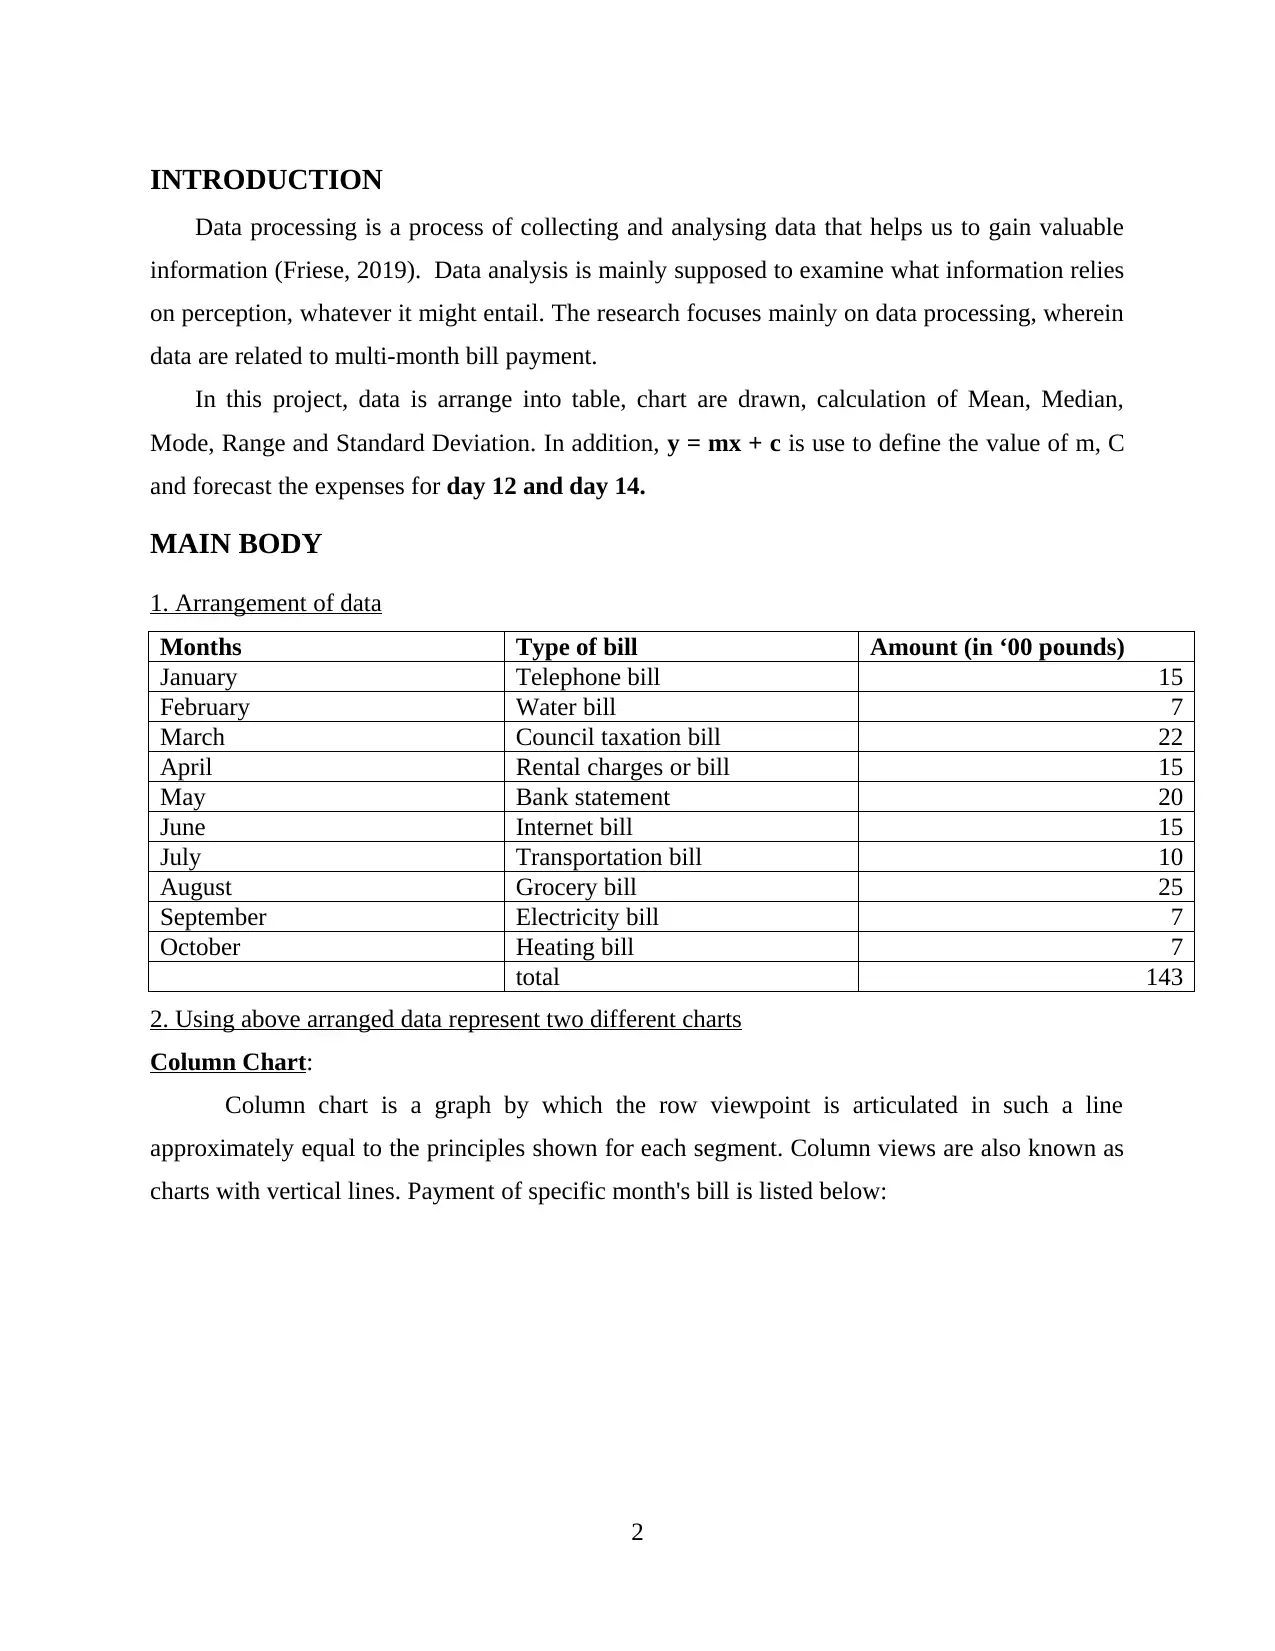
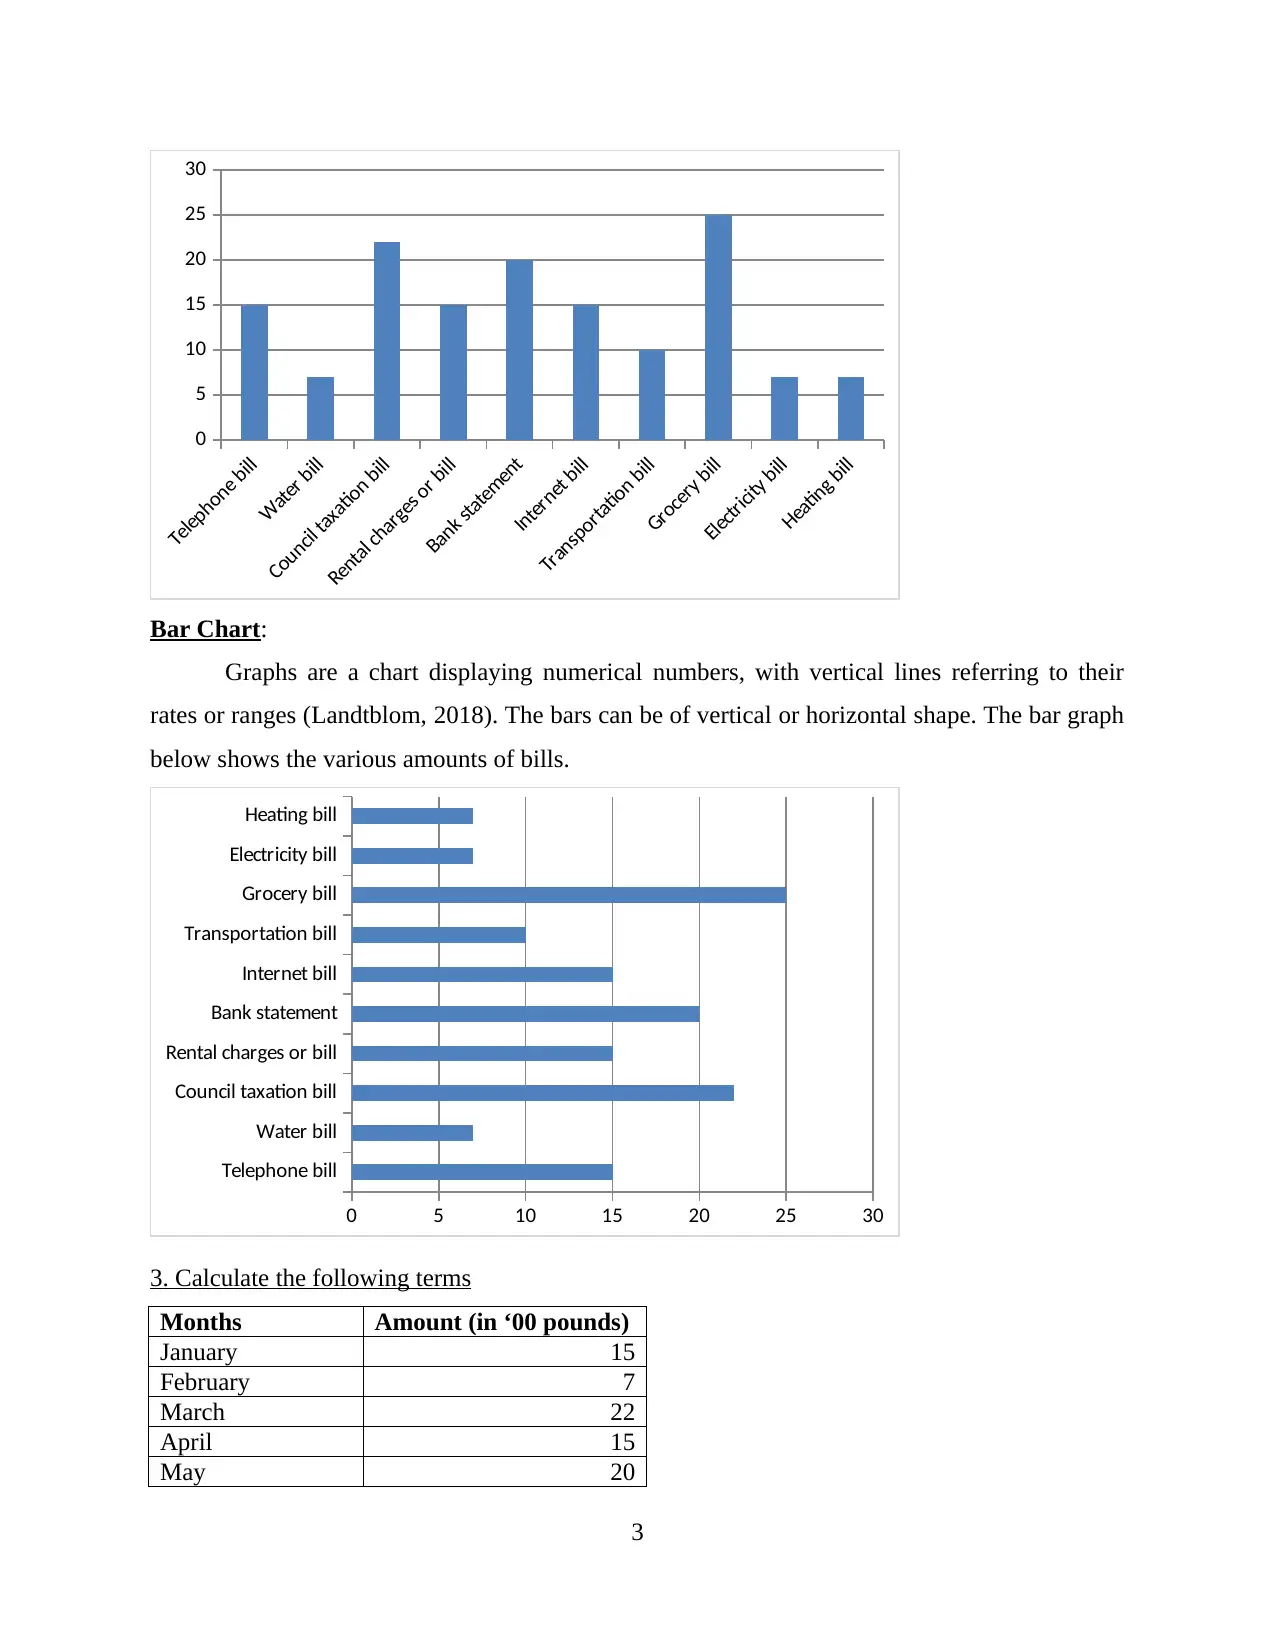
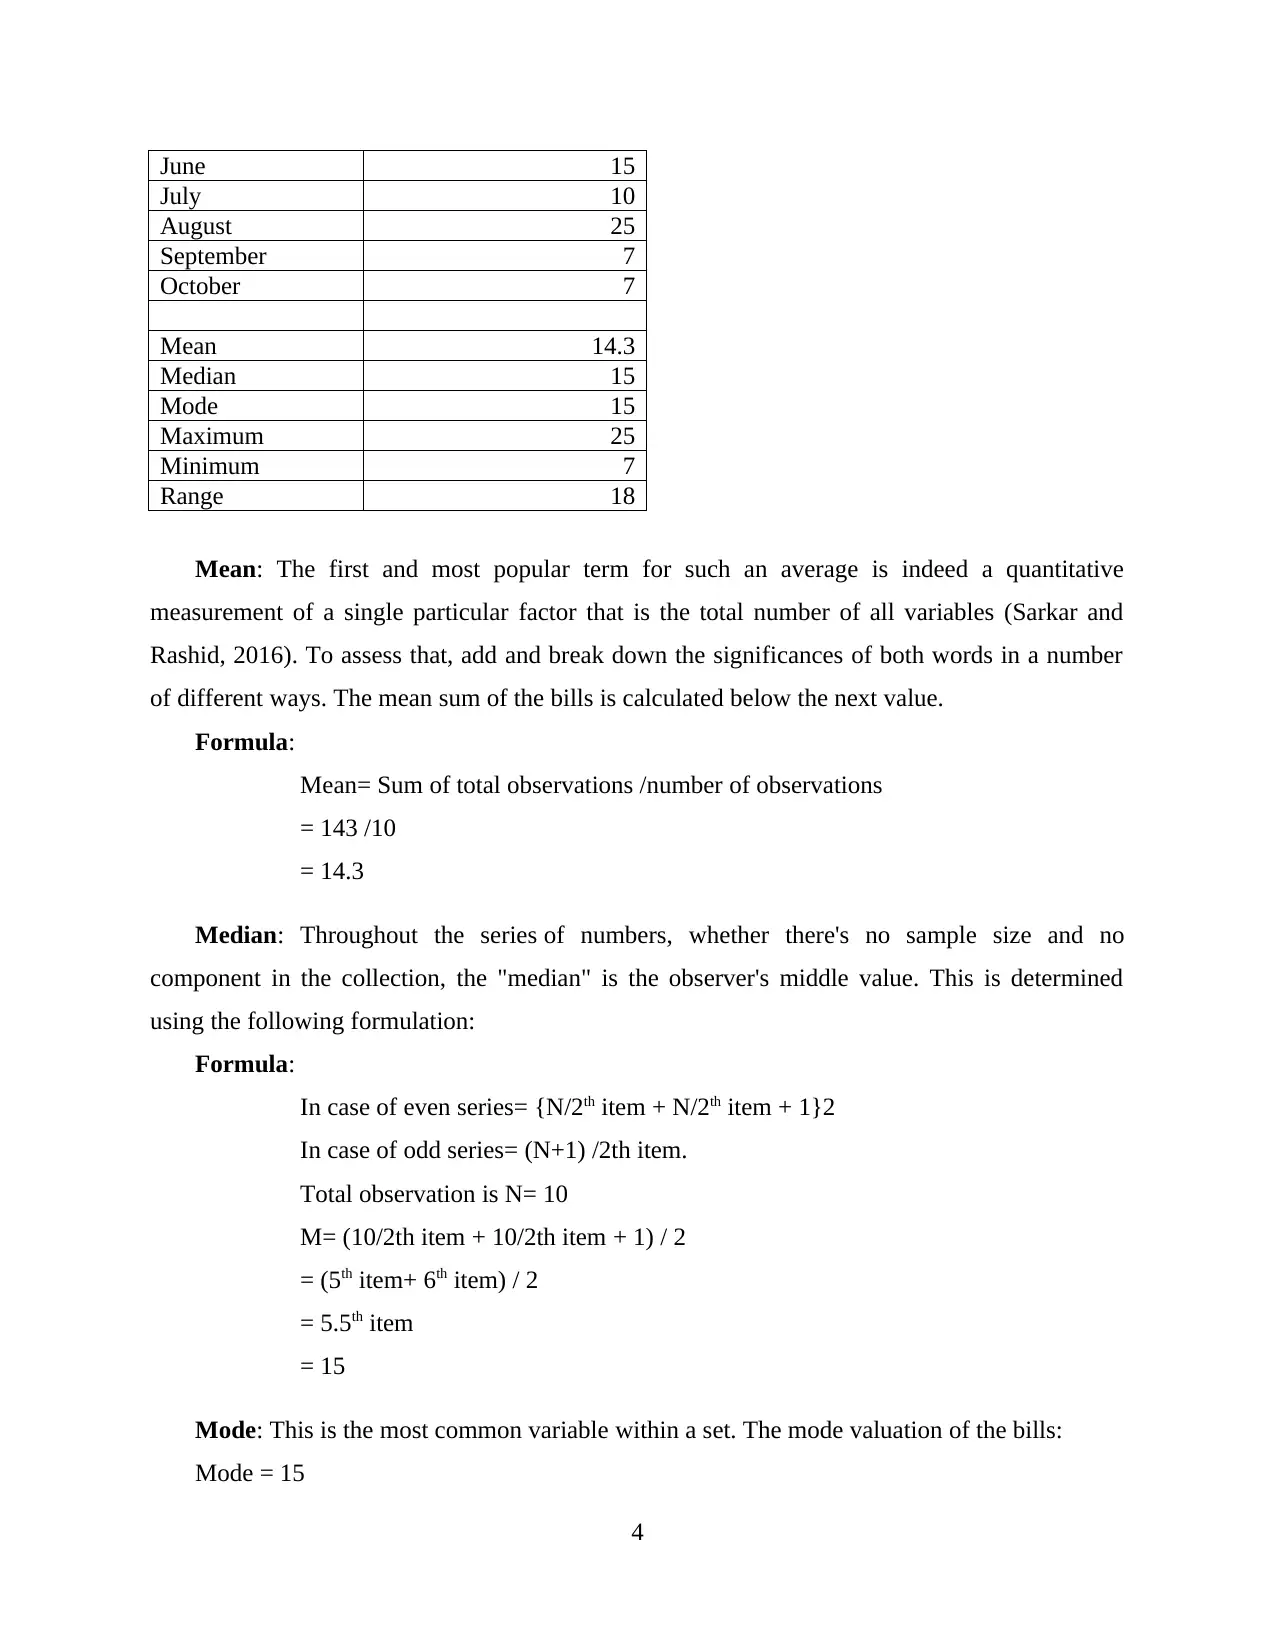
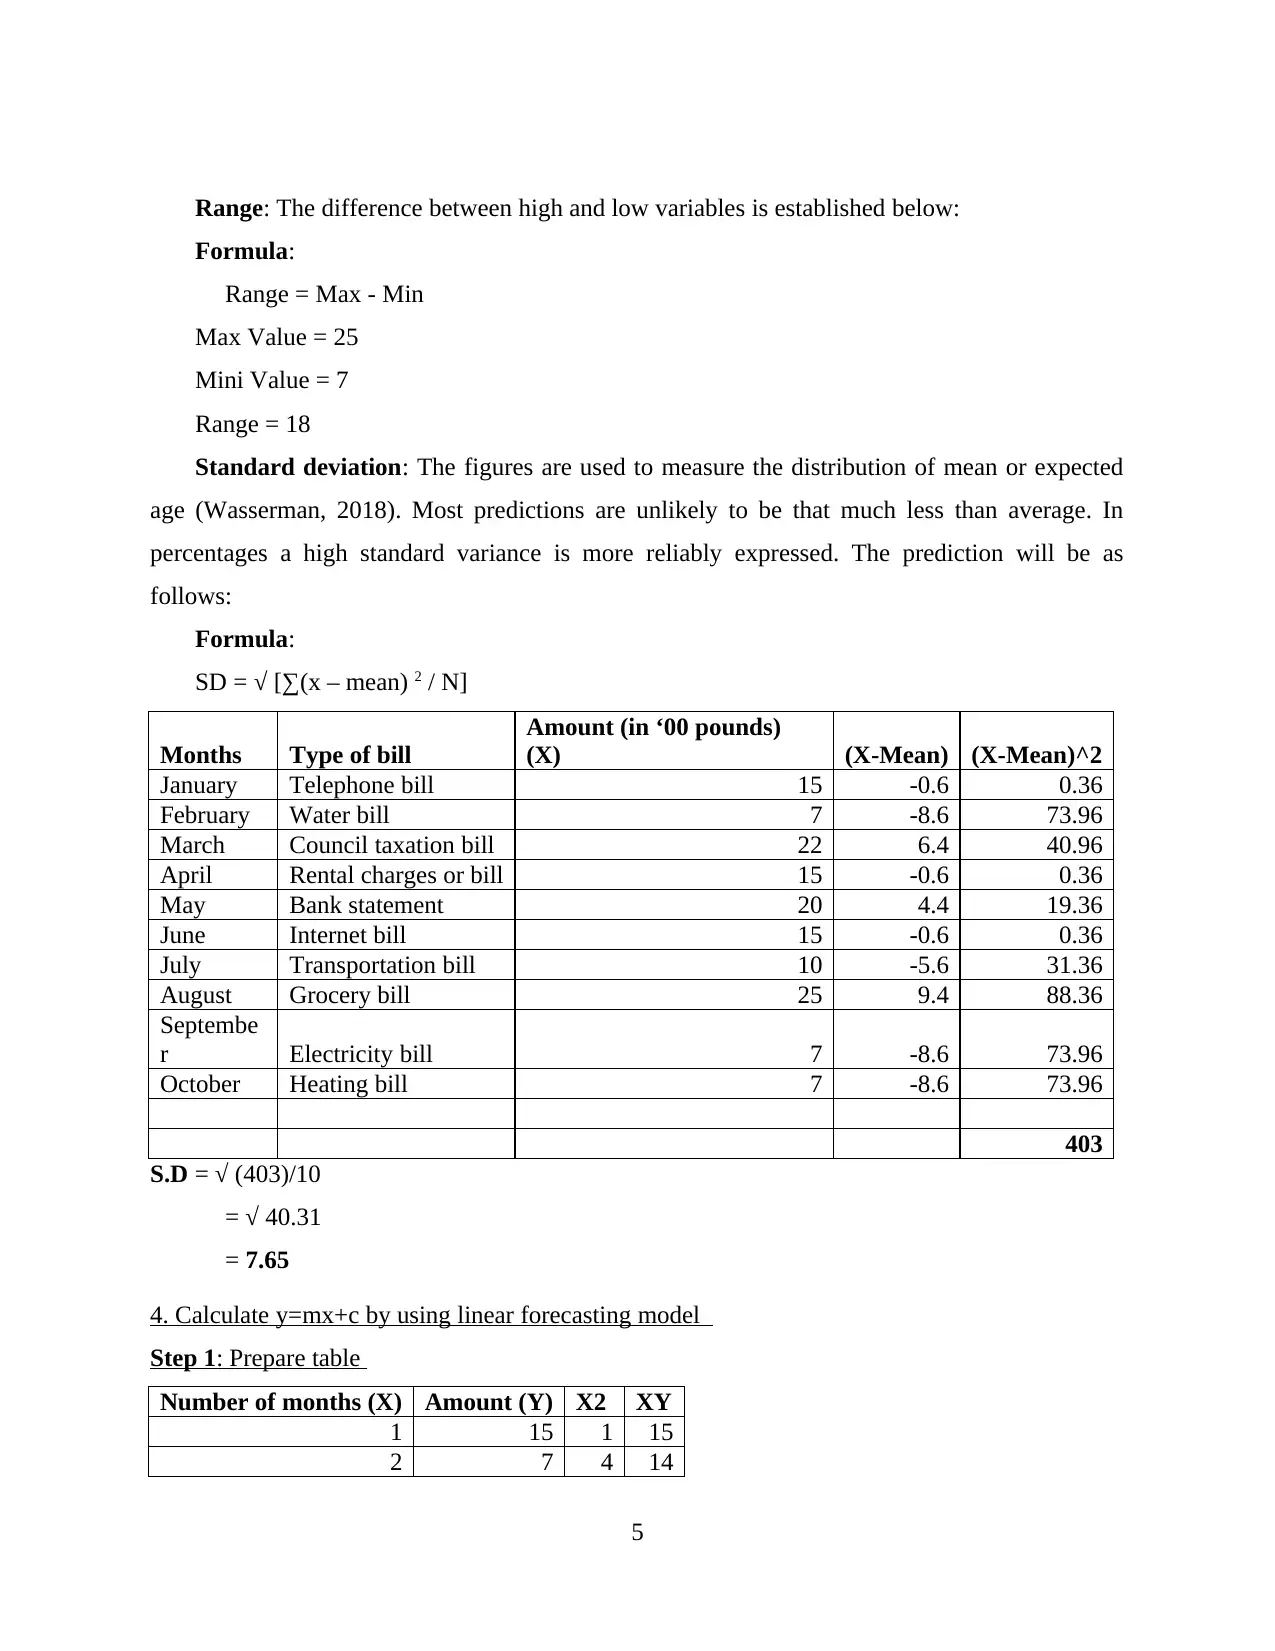
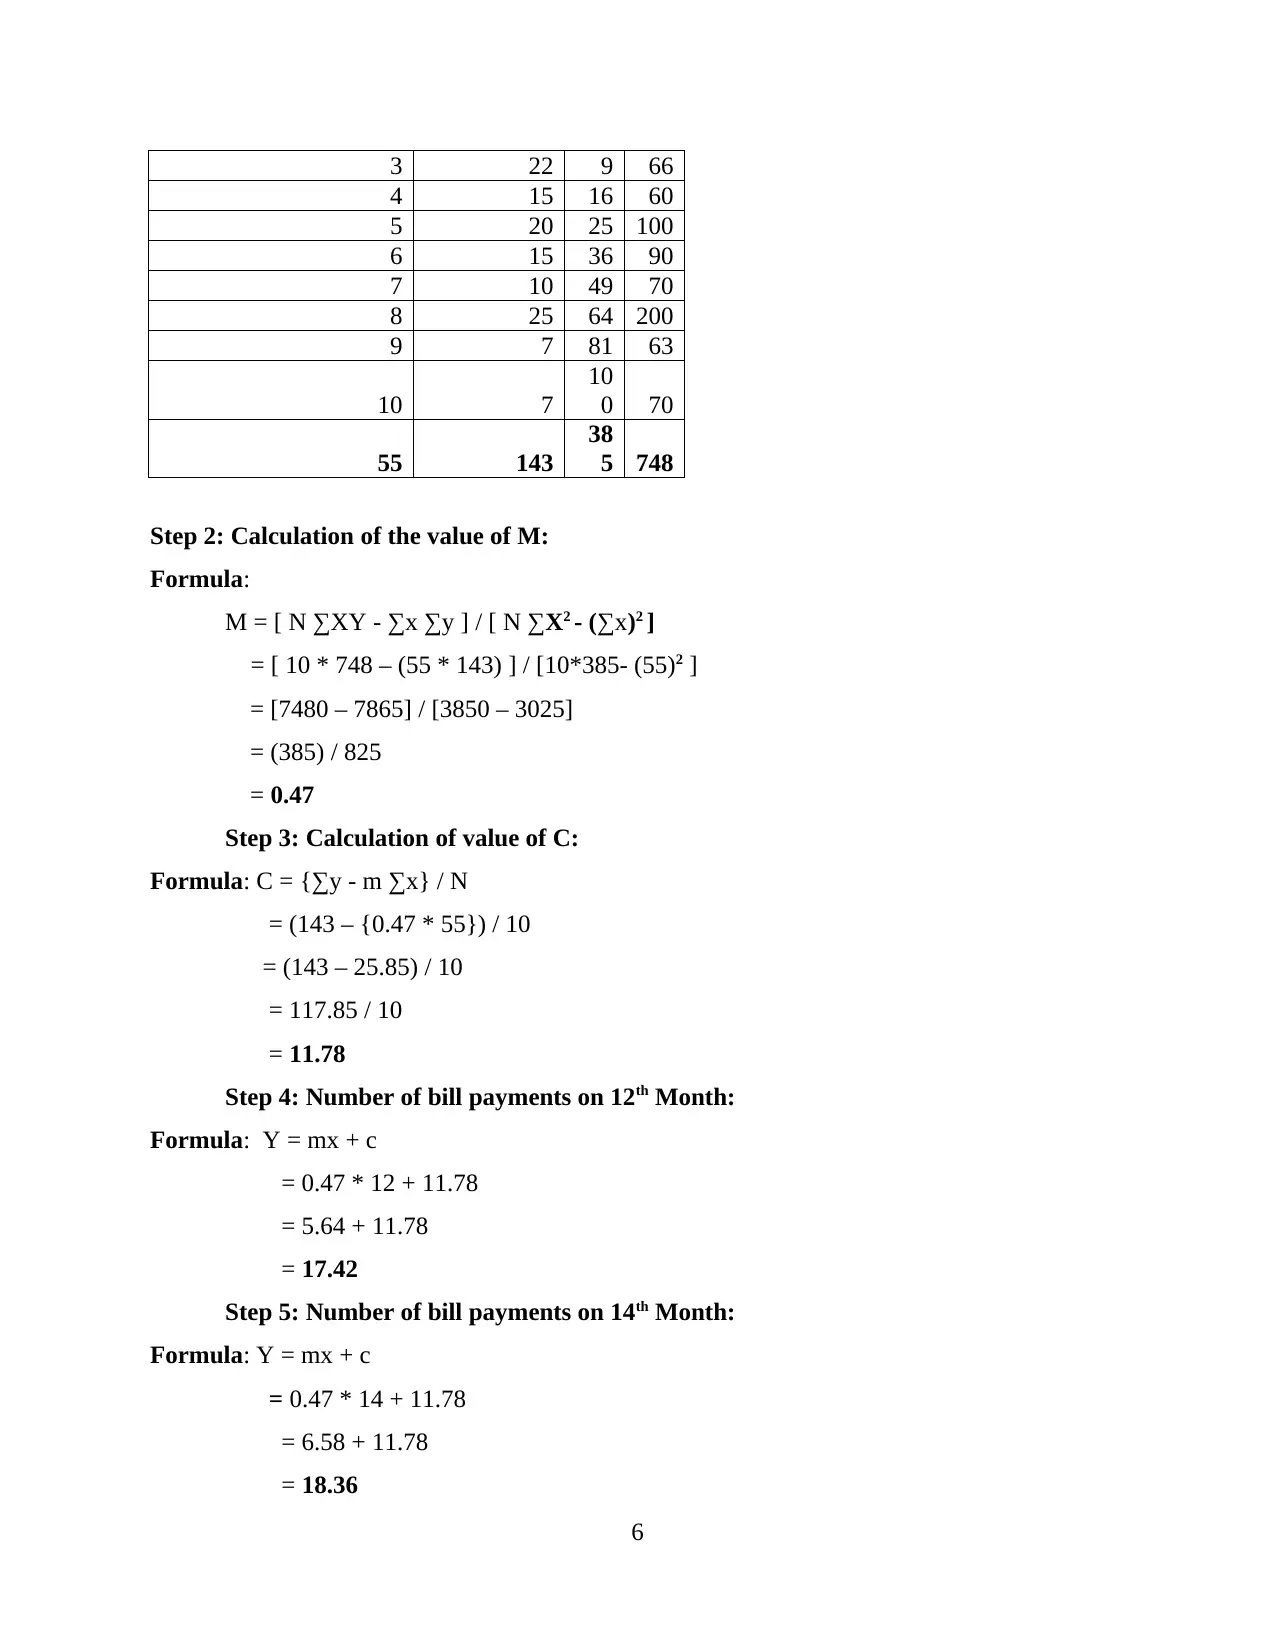
This assignment delves into the realm of data processing and analysis, using multi-month bill payment data as a case study. The solution begins with the arrangement of raw data into a structured table, followed by the creation of column and bar charts for visual representation. Core statistical concepts such as mean, median, mode, range, and standard deviation are calculated and explained. Furthermore, the assignment applies a linear forecasting model (y = mx + c) to determine the values of 'm' and 'c', and to predict bill payments for the 12th and 14th months. The report concludes by summarizing the importance of data processing and the various statistical methods used to derive meaningful insights from the dataset, with references to relevant sources.
tabler-icon-diamond-filled.svg

Contribute Materials

Your contribution can guide someone’s learning journey. Share your documents today.
Document Page
Numeracy and Data Analysis
INTRODUCTION...........................................................................................................................3
MAIN BODY..................................................................................................................................3
1. Arrangement of data................................................................................................................3
2. Using above arranged data represent two different charts.......................................................3
3. Calculate the following terms..................................................................................................5
4. Calculate y=mx+c by using linear forecasting model.............................................................7
CONCLUSION................................................................................................................................9
REFERENCES..............................................................................................................................10
1
tabler-icon-diamond-filled.svg

Secure Best Marks with AI Grader

Need help grading? Try our AI Grader for instant feedback on your assignments.
Document Page
INTRODUCTION
Data processing is a process of collecting and analysing data that helps us to gain valuable
information (Friese, 2019). Data analysis is mainly supposed to examine what information relies
on perception, whatever it might entail. The research focuses mainly on data processing, wherein
data are related to multi-month bill payment.
In this project, data is arrange into table, chart are drawn, calculation of Mean, Median,
Mode, Range and Standard Deviation. In addition, y = mx + c is use to define the value of m, C
and forecast the expenses for day 12 and day 14.
MAIN BODY
1. Arrangement of data
Months Type of bill Amount (in ‘00 pounds)
January Telephone bill 15
February Water bill 7
March Council taxation bill 22
April Rental charges or bill 15
May Bank statement 20
June Internet bill 15
July Transportation bill 10
August Grocery bill 25
September Electricity bill 7
October Heating bill 7
total 143
2. Using above arranged data represent two different charts
Column Chart:
Column chart is a graph by which the row viewpoint is articulated in such a line
approximately equal to the principles shown for each segment. Column views are also known as
charts with vertical lines. Payment of specific month's bill is listed below:
2
Document Page
Telephone bill
Water bill
Council taxation bill
Rental charges or bill
Bank statement
Internet bill
Transportation bill
Grocery bill
Electricity bill
Heating bill
0
5
10
15
20
25
30
Bar Chart:
Graphs are a chart displaying numerical numbers, with vertical lines referring to their
rates or ranges (Landtblom, 2018). The bars can be of vertical or horizontal shape. The bar graph
below shows the various amounts of bills.
Telephone bill
Water bill
Council taxation bill
Rental charges or bill
Bank statement
Internet bill
Transportation bill
Grocery bill
Electricity bill
Heating bill
0 5 10 15 20 25 30
3. Calculate the following terms
Months Amount (in ‘00 pounds)
January 15
February 7
March 22
April 15
May 20
3
Document Page
June 15
July 10
August 25
September 7
October 7
Mean 14.3
Median 15
Mode 15
Maximum 25
Minimum 7
Range 18
Mean: The first and most popular term for such an average is indeed a quantitative
measurement of a single particular factor that is the total number of all variables (Sarkar and
Rashid, 2016). To assess that, add and break down the significances of both words in a number
of different ways. The mean sum of the bills is calculated below the next value.
Formula:
Mean= Sum of total observations /number of observations
= 143 /10
= 14.3
Median: Throughout the series of numbers, whether there's no sample size and no
component in the collection, the "median" is the observer's middle value. This is determined
using the following formulation:
Formula:
In case of even series= {N/2th item + N/2th item + 1}2
In case of odd series= (N+1) /2th item.
Total observation is N= 10
M= (10/2th item + 10/2th item + 1) / 2
= (5th item+ 6th item) / 2
= 5.5th item
= 15
Mode: This is the most common variable within a set. The mode valuation of the bills:
Mode = 15
4
tabler-icon-diamond-filled.svg

Secure Best Marks with AI Grader

Need help grading? Try our AI Grader for instant feedback on your assignments.
Document Page
Range: The difference between high and low variables is established below:
Formula:
Range = Max - Min
Max Value = 25
Mini Value = 7
Range = 18
Standard deviation: The figures are used to measure the distribution of mean or expected
age (Wasserman, 2018). Most predictions are unlikely to be that much less than average. In
percentages a high standard variance is more reliably expressed. The prediction will be as
follows:
Formula:
SD = [∑(x – mean) 2 / N]
Months Type of bill
Amount (in ‘00 pounds)
(X) (X-Mean) (X-Mean)^2
January Telephone bill 15 -0.6 0.36
February Water bill 7 -8.6 73.96
March Council taxation bill 22 6.4 40.96
April Rental charges or bill 15 -0.6 0.36
May Bank statement 20 4.4 19.36
June Internet bill 15 -0.6 0.36
July Transportation bill 10 -5.6 31.36
August Grocery bill 25 9.4 88.36
Septembe
r Electricity bill 7 -8.6 73.96
October Heating bill 7 -8.6 73.96
403
S.D = √ (403)/10
= √ 40.31
= 7.65
4. Calculate y=mx+c by using linear forecasting model
Step 1: Prepare table
Number of months (X) Amount (Y) X2 XY
1 15 1 15
2 7 4 14
5
Document Page
3 22 9 66
4 15 16 60
5 20 25 100
6 15 36 90
7 10 49 70
8 25 64 200
9 7 81 63
10 7
10
0 70
55 143
38
5 748
Step 2: Calculation of the value of M:
Formula:
M = [ N ∑XY - ∑x ∑y ] / [ N ∑X2 - (∑x)2 ]
= [ 10 * 748 – (55 * 143) ] / [10*385- (55)2 ]
= [7480 – 7865] / [3850 – 3025]
= (385) / 825
= 0.47
Step 3: Calculation of value of C:
Formula: C = {∑y - m ∑x} / N
= (143 – {0.47 * 55}) / 10
= (143 – 25.85) / 10
= 117.85 / 10
= 11.78
Step 4: Number of bill payments on 12th Month:
Formula: Y = mx + c
= 0.47 * 12 + 11.78
= 5.64 + 11.78
= 17.42
Step 5: Number of bill payments on 14th Month:
Formula: Y = mx + c
= 0.47 * 14 + 11.78
= 6.58 + 11.78
= 18.36
6
Document Page
CONCLUSION
The report suggests that data processing is too important to ascertain the particular result of
information sets compilation. This research identified different kinds of properties like mean,
mode, median, etc. Alternatively the linear equation to predict the amount of bills paid for the 12
and 14 months.
7
tabler-icon-diamond-filled.svg

Paraphrase This Document

Need a fresh take? Get an instant paraphrase of this document with our AI Paraphraser
Document Page
REFERENCES
Books & Journals
Friese, S., 2019. Qualitative data analysis with ATLAS. ti. SAGE Publications Limited.
Landtblom, K. K., 2018. Prospective Teachers’ Conceptions of the Concepts Mean, Median and
Mode. In Students' and Teachers' Values, Attitudes, Feelings and Beliefs in
Mathematics Classrooms (pp. 43-52). Springer, Cham.
Sarkar, J. and Rashid, M., 2016. Visualizing mean, median, mean deviation, and standard
deviation of a set of numbers. The American Statistician. 70(3). pp.304-312.
Wasserman, L., 2018. Topological data analysis. Annual Review of Statistics and Its
Application, 5, pp.501-532.
8
chevron_up_icon
1 out of 8
circle_padding
hide_on_mobile
zoom_out_icon
logo.png

Your All-in-One AI-Powered Toolkit for Academic Success.

Available 24*7 on WhatsApp / Email

[object Object]