Data Analysis Report: Sleep Behaviors, Regression, and Performance

Verified

Added on  2023/06/03

|5
|802
|344
Report
AI Summary
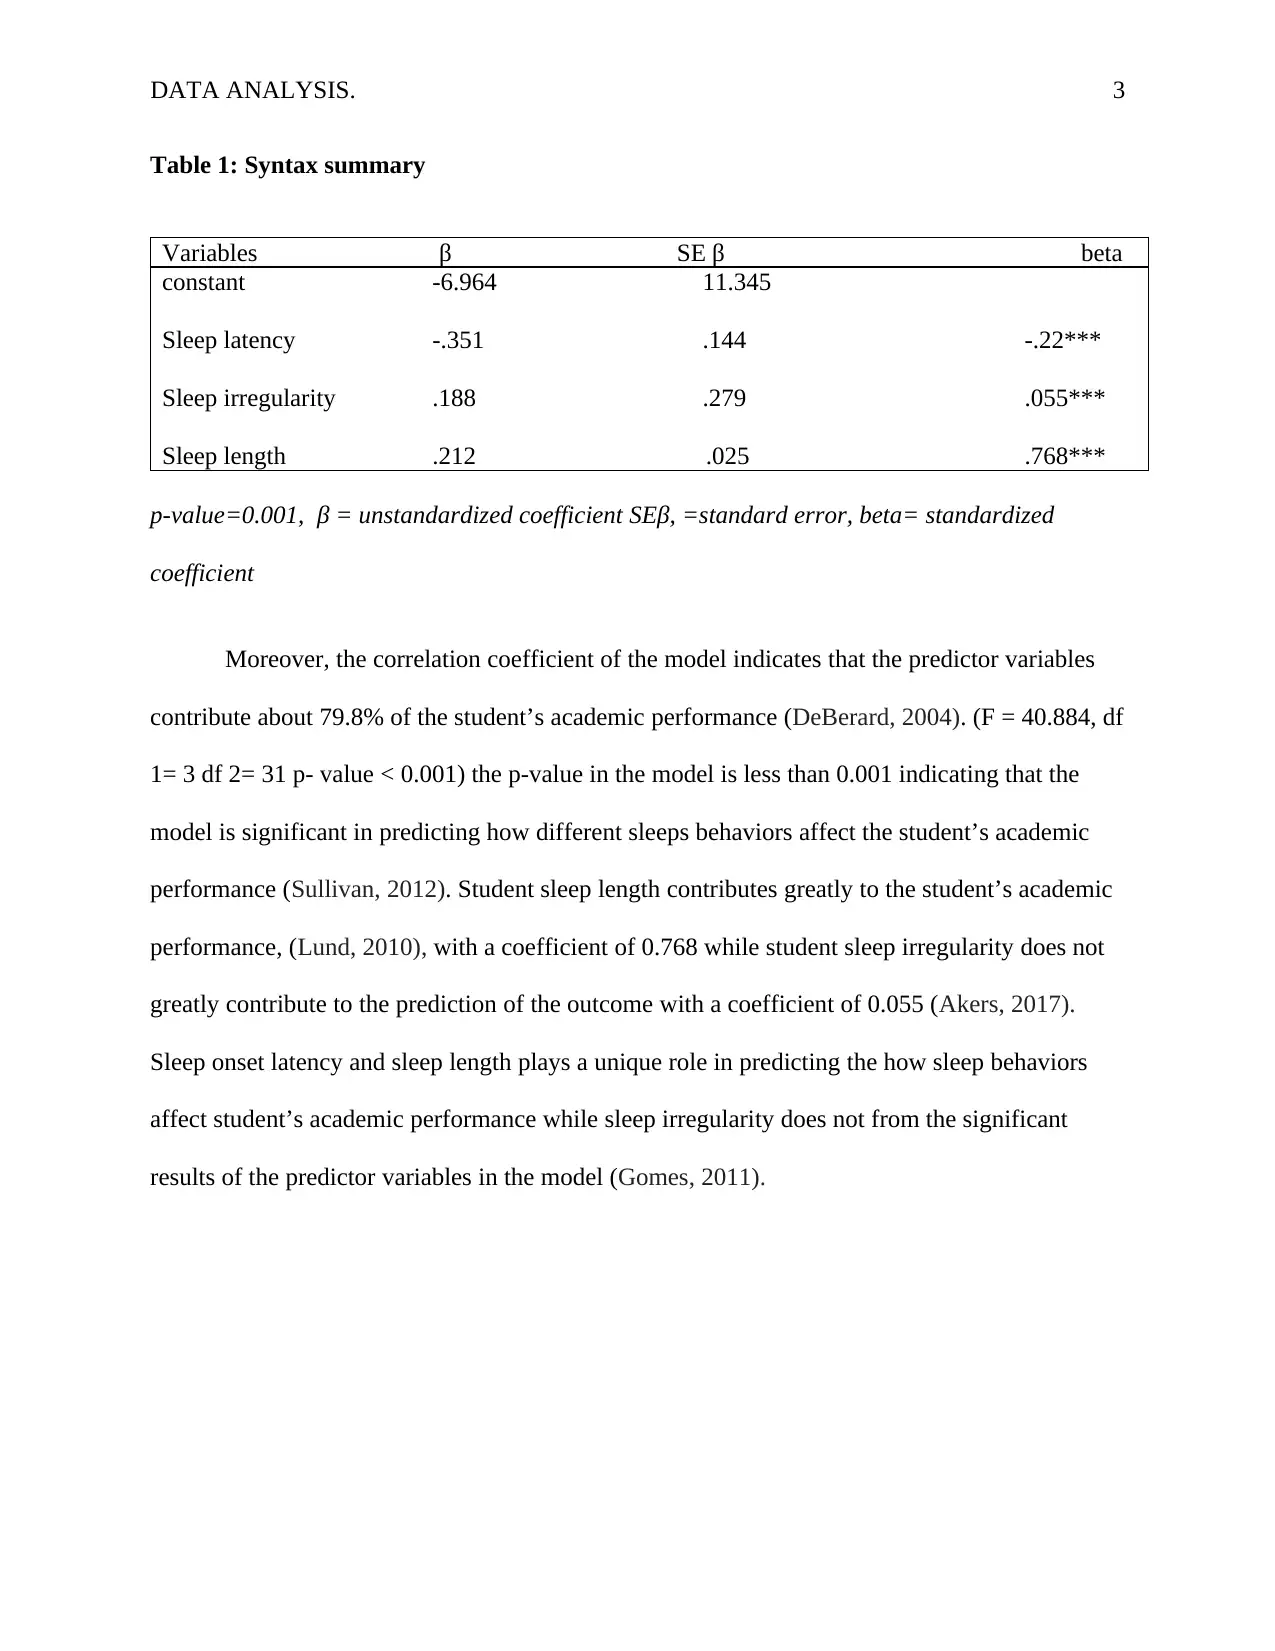
This report presents a multiple regression analysis conducted to investigate the relationship between different sleep behaviors and student academic performance. The study involved 35 students, and the analysis aimed to predict how sleep latency, irregularity, and length impact academic outcomes. The results indicate significant correlations between predictor variables and the outcome variable, with tolerance and variance inflation factor values confirming the independence of variables. The regression model explains approximately 79.8% of the variance in student academic performance. The findings highlight that sleep length significantly contributes to academic performance, while sleep irregularity has a less significant impact. The report includes a detailed syntax summary, coefficient values, and p-values to support the conclusions, along with a comprehensive list of references.
Document Page
Running head: DATA ANALYSIS. 1
Multiple regressions
Name
Course title
Course code
Word count- 340
Date
tabler-icon-diamond-filled.svg

Paraphrase This Document

Need a fresh take? Get an instant paraphrase of this document with our AI Paraphraser
Document Page
DATA ANALYSIS. 2
Multiple regression results
Assumptions
The variables have constant means.
The variables are independent of each other.
The variables are normally distributed.
Null hypothesis: β = a constant
Alternative hypothesis: β ≠ a constant
The multiple linear regression analysis was run (SPSS version 25) to predict the effects of
different sleep behaviors on student academic performance. Data was obtained from 35 different
students. The correlations established that there was a significant linear relationship between
each of the predictor variables and the outcome variable at -0.562 and 0.870 correlation values
which are greater than 3 showing strong correlation (Misawa, 2012) and 0.120 which is less than
3 indicating weak correlation.
Moreover, tolerance value is less than 1 indicating that there is no multi-co linearity
again; the variance inflation factor indicates that there is no multi-co linearity. This proves the
assumption that the variables in the model are independent of each other. The graphical
outcomes indicates that the variables distribution were normal.
Document Page
DATA ANALYSIS. 3
Table 1: Syntax summary
Variables β SE β beta
constant -6.964 11.345
Sleep latency -.351 .144 -.22***
Sleep irregularity .188 .279 .055***
Sleep length .212 .025 .768***
p-value=0.001, β = unstandardized coefficient SEβ, =standard error, beta= standardized
coefficient
Moreover, the correlation coefficient of the model indicates that the predictor variables
contribute about 79.8% of the student’s academic performance (DeBerard, 2004). (F = 40.884, df
1= 3 df 2= 31 p- value < 0.001) the p-value in the model is less than 0.001 indicating that the
model is significant in predicting how different sleeps behaviors affect the student’s academic
performance (Sullivan, 2012). Student sleep length contributes greatly to the student’s academic
performance, (Lund, 2010), with a coefficient of 0.768 while student sleep irregularity does not
greatly contribute to the prediction of the outcome with a coefficient of 0.055 (Akers, 2017).
Sleep onset latency and sleep length plays a unique role in predicting the how sleep behaviors
affect student’s academic performance while sleep irregularity does not from the significant
results of the predictor variables in the model (Gomes, 2011).
Document Page
DATA ANALYSIS. 4
References
1. Misawa, T., Nakamura, K., &Imada, M. (2012). Ab initio evidence for strong correlation
associated with Mott proximity in iron-based superconductors. Physical review
letters, 108(17), 177007
tabler-icon-diamond-filled.svg

Paraphrase This Document

Need a fresh take? Get an instant paraphrase of this document with our AI Paraphraser
Document Page
DATA ANALYSIS. 5
2. DeBerard, M. S., Spielmans, G., &Julka, D. (2004). Predictors of academic achievement
and retention among college freshmen: A longitudinal study. College student
journal, 38(1), 66-80.
3. Sullivan, G. M., &Feinn, R. (2012). Using effect size—or why the P value is not
enough. Journal of graduate medical education, 4(3), 279-282.
4. Lund, H. G., Reider, B. D., Whiting, A. B., & Prichard, J. R. (2010). Sleep patterns and
predictors of disturbed sleep in a large population of college students. Journal of
adolescent health, 46(2), 124-132.
5. Akers, R. (2017). Social learning and social structure: A general theory of crime and
deviance. Routledge.
6. Gomes, A. A., Tavares, J., & de Azevedo, M. H. P. (2011). Sleep and academic
performance in undergraduates: a multi-measure, multi-predictor
approach. Chronobiology International, 28(9), 786-801.
7. Elbadrawy, A., Studham, R. S., &Karypis, G. (2015, March). Collaborative multi-
regression models for predicting students' performance in course activities.
In Proceedings of the Fifth International Conference on Learning Analytics And
Knowledge (pp. 103-107). ACM.
8. Duan, L., Niu, D., &Gu, Z. (2008, December). Long and medium term power load
forecasting with multi-level recursive regression analysis. In Intelligent Information
Technology Application, 2008. IITA'08. Second International Symposium on (Vol. 1, pp.
514-518). IEEE.
chevron_up_icon
1 out of 5
circle_padding
hide_on_mobile
zoom_out_icon
[object Object]