Numeracy and Data Analysis Report: Temperature Analysis in UK
VerifiedAdded on 2023/06/08
|9
|1514
|169
Report
AI Summary
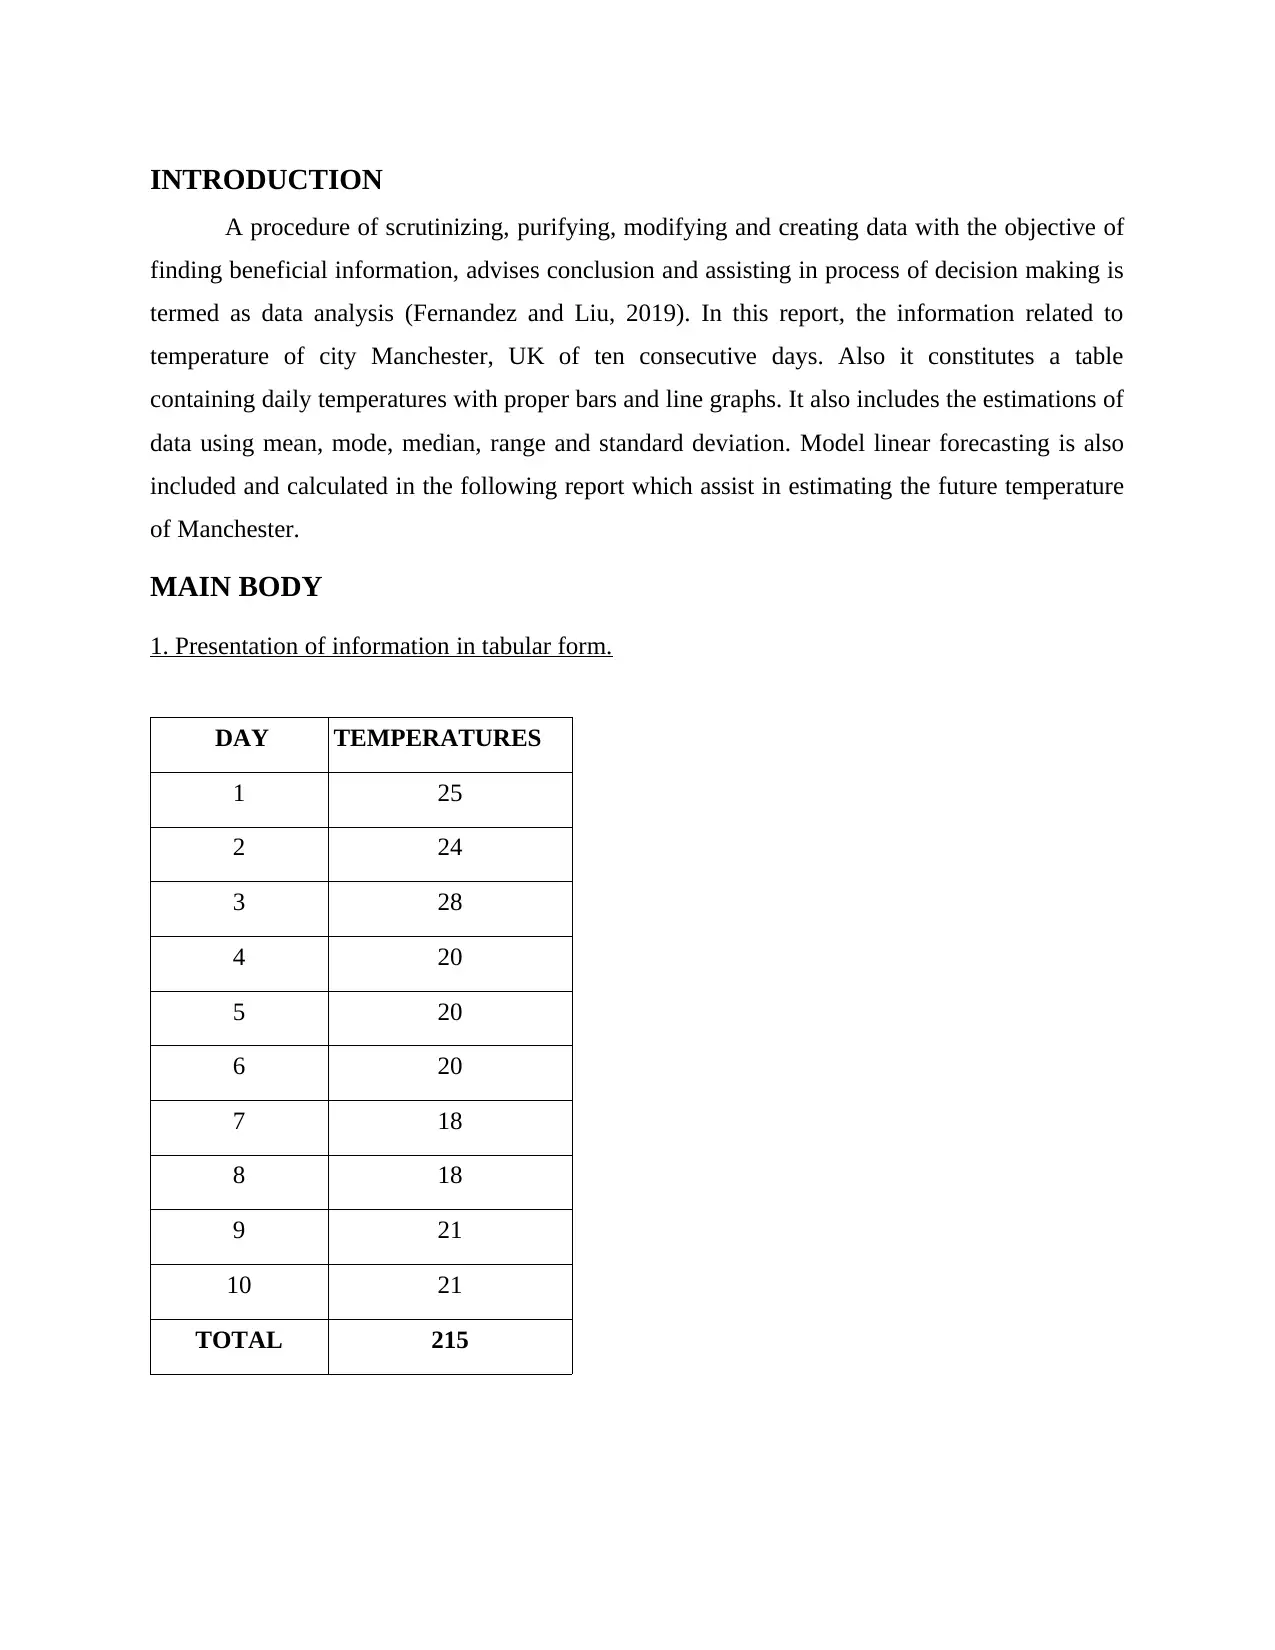
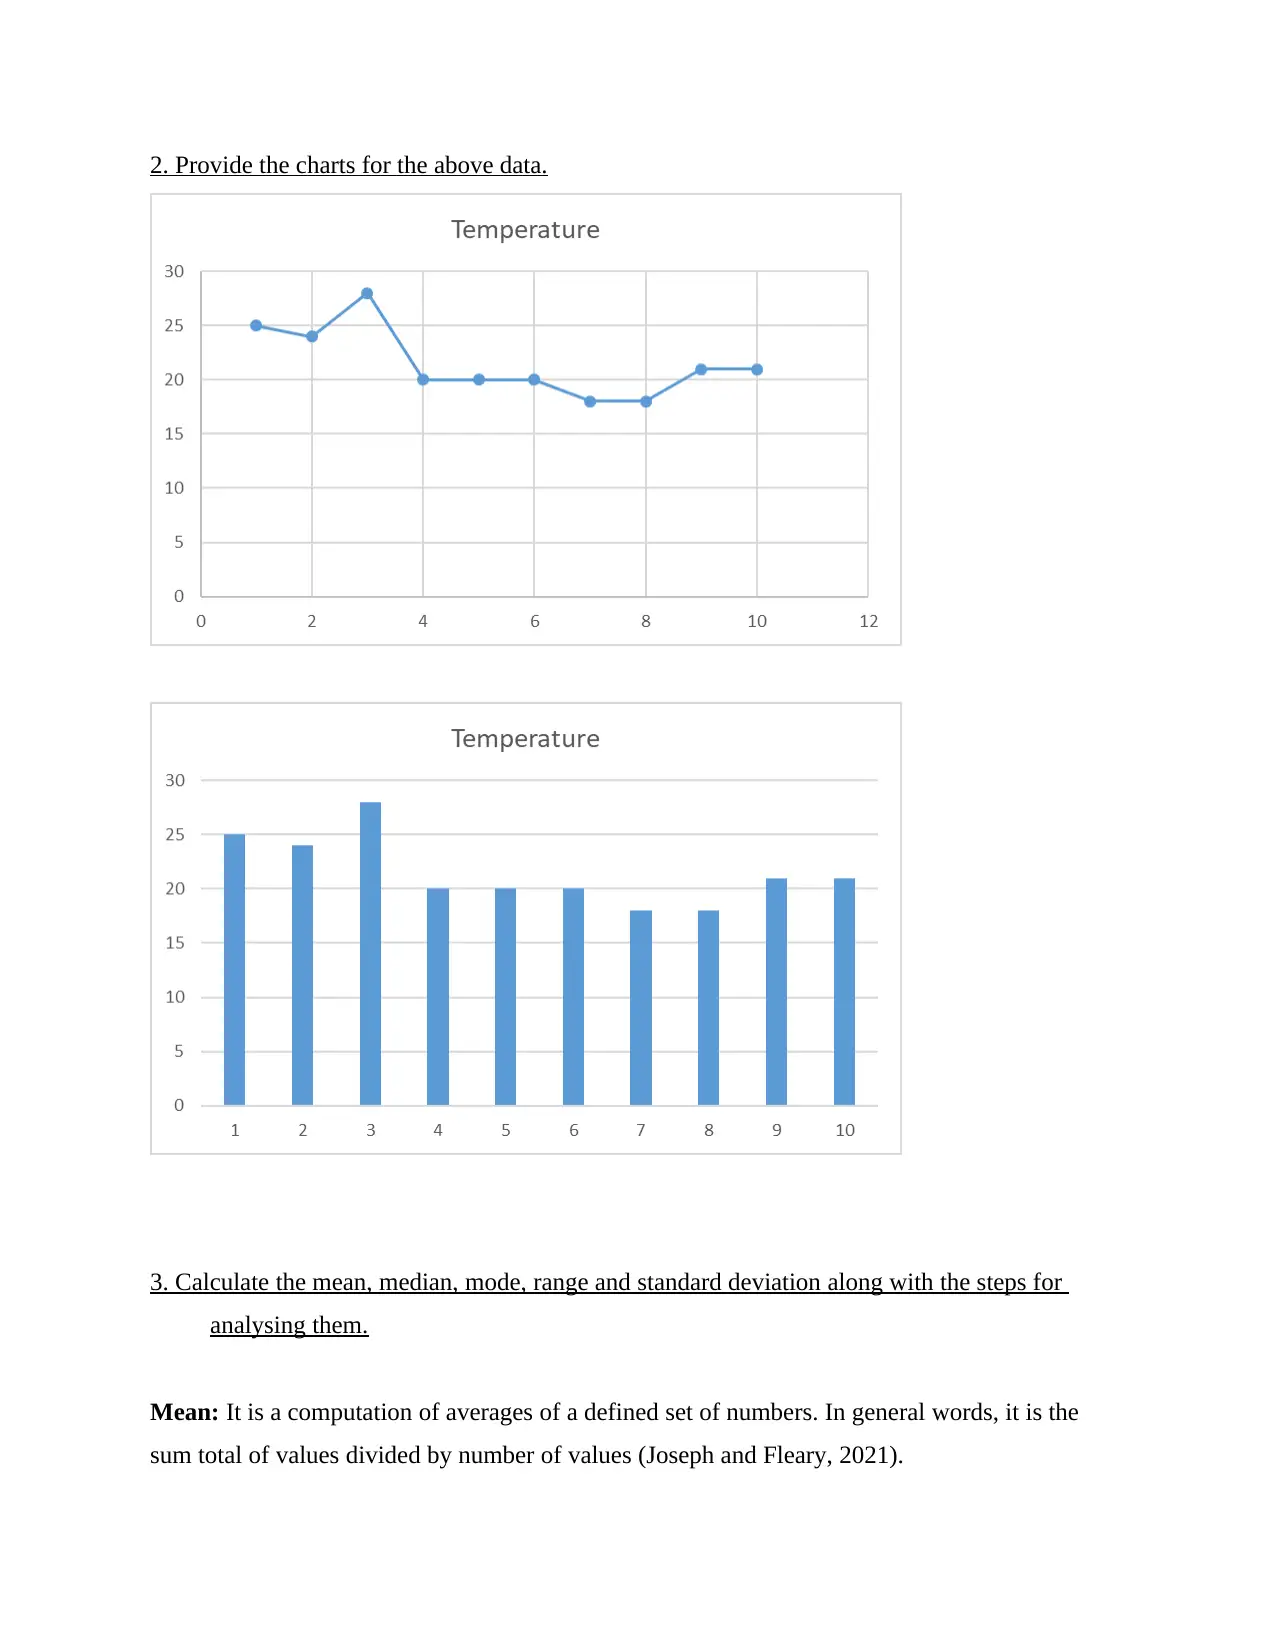
This report provides a comprehensive analysis of temperature data for Manchester, UK, over ten consecutive days. It includes a tabular presentation of the data, along with bar and line graphs for visualization. The report calculates and analyzes key statistical measures such as mean, median, mode, range, and standard deviation to understand the central tendency and dispersion of the temperature data. Furthermore, a linear forecasting model is applied to predict the temperature for day 11 and day 14, demonstrating the application of statistical techniques for future estimations. This analysis offers insights into the temperature patterns and trends in Manchester based on the provided dataset. Desklib provides a platform for students to access similar solved assignments and resources for academic support.

Numeracy and Data
Analysis
Analysis
Paraphrase This Document
Need a fresh take? Get an instant paraphrase of this document with our AI Paraphraser

Contents
INTRODUCTION...........................................................................................................................3
MAIN BODY..................................................................................................................................3
1. Presentation of information in tabular form............................................................................3
2. Provide the charts for the above data.......................................................................................4
3. Calculate the mean, median, mode, range and standard deviation along with the steps for
analysing them.............................................................................................................................4
4. Analyse the value of 'm' and 'c' and represent the steps to be followed. By the Use of 'm' and
'c' values, calculate the temperature for day 11 and day 14.........................................................6
CONCLUSION................................................................................................................................8
REFERENCES................................................................................................................................9

INTRODUCTION
A procedure of scrutinizing, purifying, modifying and creating data with the objective of
finding beneficial information, advises conclusion and assisting in process of decision making is
termed as data analysis (Fernandez and Liu, 2019). In this report, the information related to
temperature of city Manchester, UK of ten consecutive days. Also it constitutes a table
containing daily temperatures with proper bars and line graphs. It also includes the estimations of
data using mean, mode, median, range and standard deviation. Model linear forecasting is also
included and calculated in the following report which assist in estimating the future temperature
of Manchester.
MAIN BODY
1. Presentation of information in tabular form.
DAY TEMPERATURES
1 25
2 24
3 28
4 20
5 20
6 20
7 18
8 18
9 21
10 21
TOTAL 215
⊘ This is a preview!⊘
Do you want full access?
Subscribe today to unlock all pages.

Trusted by 1+ million students worldwide

2. Provide the charts for the above data.
3. Calculate the mean, median, mode, range and standard deviation along with the steps for
analysing them.
Mean: It is a computation of averages of a defined set of numbers. In general words, it is the
sum total of values divided by number of values (Joseph and Fleary, 2021).
3. Calculate the mean, median, mode, range and standard deviation along with the steps for
analysing them.
Mean: It is a computation of averages of a defined set of numbers. In general words, it is the
sum total of values divided by number of values (Joseph and Fleary, 2021).
Paraphrase This Document
Need a fresh take? Get an instant paraphrase of this document with our AI Paraphraser

Steps for calculation of Mean:
Step 1: Collect the data.
Step 2: Add up all the observations
Step 3: Calculate the total number of data
Step 4: Divide step 2 by step 3.
Mean of temperature= Sum total of terms/Total numbers of terms
=215/10
=21.5
Median: It is described as the central value in a stated set of data. The mid number is obtained
by arranging the given numbers in ascending order (O’Toole and Sellars, 2018).
Steps showing calculation of Median:
Step 1: Arrangement of data in ascending order.
Step 2: Examining all the odd and even numbers given in data.
Step 3: Calculate median for even numbers.
Median = [(n/2)th term + {(n/2)+1}th]/2
where, n= Total number of observations/2
= 10/2
= 5
= [5 th+{5+1} th]/2
= [5th+6th term]/2
= [20+20]/2
Median= 20.5
Mode: It is a mathematical term that refers to usually occurring digit found in a set of numbers.
Method of calculation of data:
Step 1: Arrangement of the data in ascending or descending format.
Step 2: Enumerating the number of repeated digits.
Step 3: Analysis of numbers.
Step 4: Selecting the highest number
Mode= 20

Range: The difference between the highest and lowest values in a given set of numbers or
observations is termed as range (Taylor, and Kervin, 2022).
Steps to calculate the ranges:
Step 1: Examine the stated data.
Step 2: Select the highest or lowest value.
Step 3: Subtract highest value from lowest value.
Estimation of range:
Range= Highest Value-Lowest Value
=28-18
=10
Standard Deviation: It is a estimation of amount of variation or dispersion of set of numbers
and observations. In other words, it is a statistical data which is used to measure the diversion of
the set of data which is interconnected to mean and can be calculated by the square root of
variation.
Steps to calculate the standard deviations:
Step1: Firstly, calculate value of mean.
Step2: Evaluate divergence from the calculated mean.
Step3: Square all deviations and find the total sum.
Step4: Diverge the square from total number of data.
Step5: Square root of the outcome for result.
Calculation of Standard Deviation:
Standard Deviation= √∑ (xi – μ) ^ 2 / N
= √92.5 / 10
= √9.5 = 3.08
4. Analyse the value of 'm' and 'c' and represent the steps to be followed. By the Use of 'm' and 'c'
values, calculate the temperature for day 11 and day 14.
Linear Forecasting Model: A statistical technique which helps in prediction of future values
with the assistance of past results (Wright, Hastings and Grindle, 2020).
Steps used in analyses of the model are:
Step 1: Enumerate the problem.
Step 2: Collection of data on the basis of survey.
⊘ This is a preview!⊘
Do you want full access?
Subscribe today to unlock all pages.

Trusted by 1+ million students worldwide

Step 3: Selection of the most acceptable model.
Step 4: Evaluation of the problem should be done with care.
Y =mx + C
where,'y' is the Dependent Factor,
'mx' is the Independent factor and
'c' is a constant factor.
Calculation of 'm':
Step 1: Multiply total number of data with the variables 'x' and 'y'.
Step 2: Calculate the sum of 'x' and 'y' and individually multiply them.
Step 3: Estimate the square of x with the total number of the data.
Step 4: Calculating the sum of 'x' and square it.
Step 5: Deducting the step 2 from step 1.
Step 6: After that, subtracting step 4 and step 3.
Step 7: In the end, Divergence of the value of Step 5 with Step 6.
=[(10*1126)-(55*215)]/(10*385)-(55)^2
=[11260-11825]/3850-110
= -565/3740
=0.151
Method of calculating 'c’:-
Step1: Add the values of 'y' variable.
Step2: Multiply the value of 'm' with the addition of the values of the 'x' variable.
Step4: Calculate the difference between Step2 and Step1.
Step5: Evaluating the number of values.
Step6: Divide the result of step3 by step5.
Paraphrase This Document
Need a fresh take? Get an instant paraphrase of this document with our AI Paraphraser

=215-0.151(55)/10
=20.6695
Temperature of Day 11:
m= 0.151, x=11, C=20.6695
y = mx + C
=0.151*11+20.6695
y=22.3305
Temperature of Day 14:
m= 0.151, x=14, C= 20.6695
y = mx + C
=0.151*14+20.6695
y = 22.7835
CONCLUSION
The above prepared report concludes the data of temperature for 10 consecutive days of
Manchester city, UK. The table is being prepared for showing the temperature of 10 days with
the help of proper maintenance of bar graph, line graph which shows the data. The above
calculation shows the analysing of statistics of mean, median, mode, range and standard
deviation of the city London which provides the information in accordance to the averaging
value of temperature and represents where the data is located. In addition to find the temperature
of day 11 and day 14, the model of linear forecasting is being used for calculating the future
temperatures of the city.

REFERENCES
Books and Journals
Fernandez, F. and Liu, H., 2019. Examining relationships between soft skills and occupational
outcomes among US adults with—and without—university degrees. Journal of
Education and Work, 32(8). pp.650-664.
Joseph, P. and Fleary, S.A., 2021. “The way you interpret health”: Adolescent definitions and
perceptions of health literacy. Journal of School Health, 91(8). pp.599-607.
O’Toole, M. and Sellars, M., 2018. Science and Numeracy. In Numeracy in Authentic
Contexts (pp. 373-403). Springer, Singapore.
Taylor, E.K. and Kervin, L., 2022. Parent/Caregiver Perspectives on Children’s Play and
Learning at a Children’s Museum: A Qualitative Descriptive Study. Journal of Museum
Education, 47(2). pp.275-285.
Wright, R.J., Hastings, R. and Grindle, C., 2020. Teaching Early Numeracy to Children with
Developmental Disabilities. Teaching Early Numeracy to Children with Developmental
Disabilities. pp.1-176.
⊘ This is a preview!⊘
Do you want full access?
Subscribe today to unlock all pages.

Trusted by 1+ million students worldwide
1 out of 9
Related Documents

Your All-in-One AI-Powered Toolkit for Academic Success.
+13062052269
info@desklib.com
Available 24*7 on WhatsApp / Email
Unlock your academic potential
Copyright © 2020–2025 A2Z Services. All Rights Reserved. Developed and managed by ZUCOL.