Temperature Analysis: A Report on Numeracy and Data Analysis

Verified

Added on  2023/06/08

|9
|1750
|75
Report
AI Summary
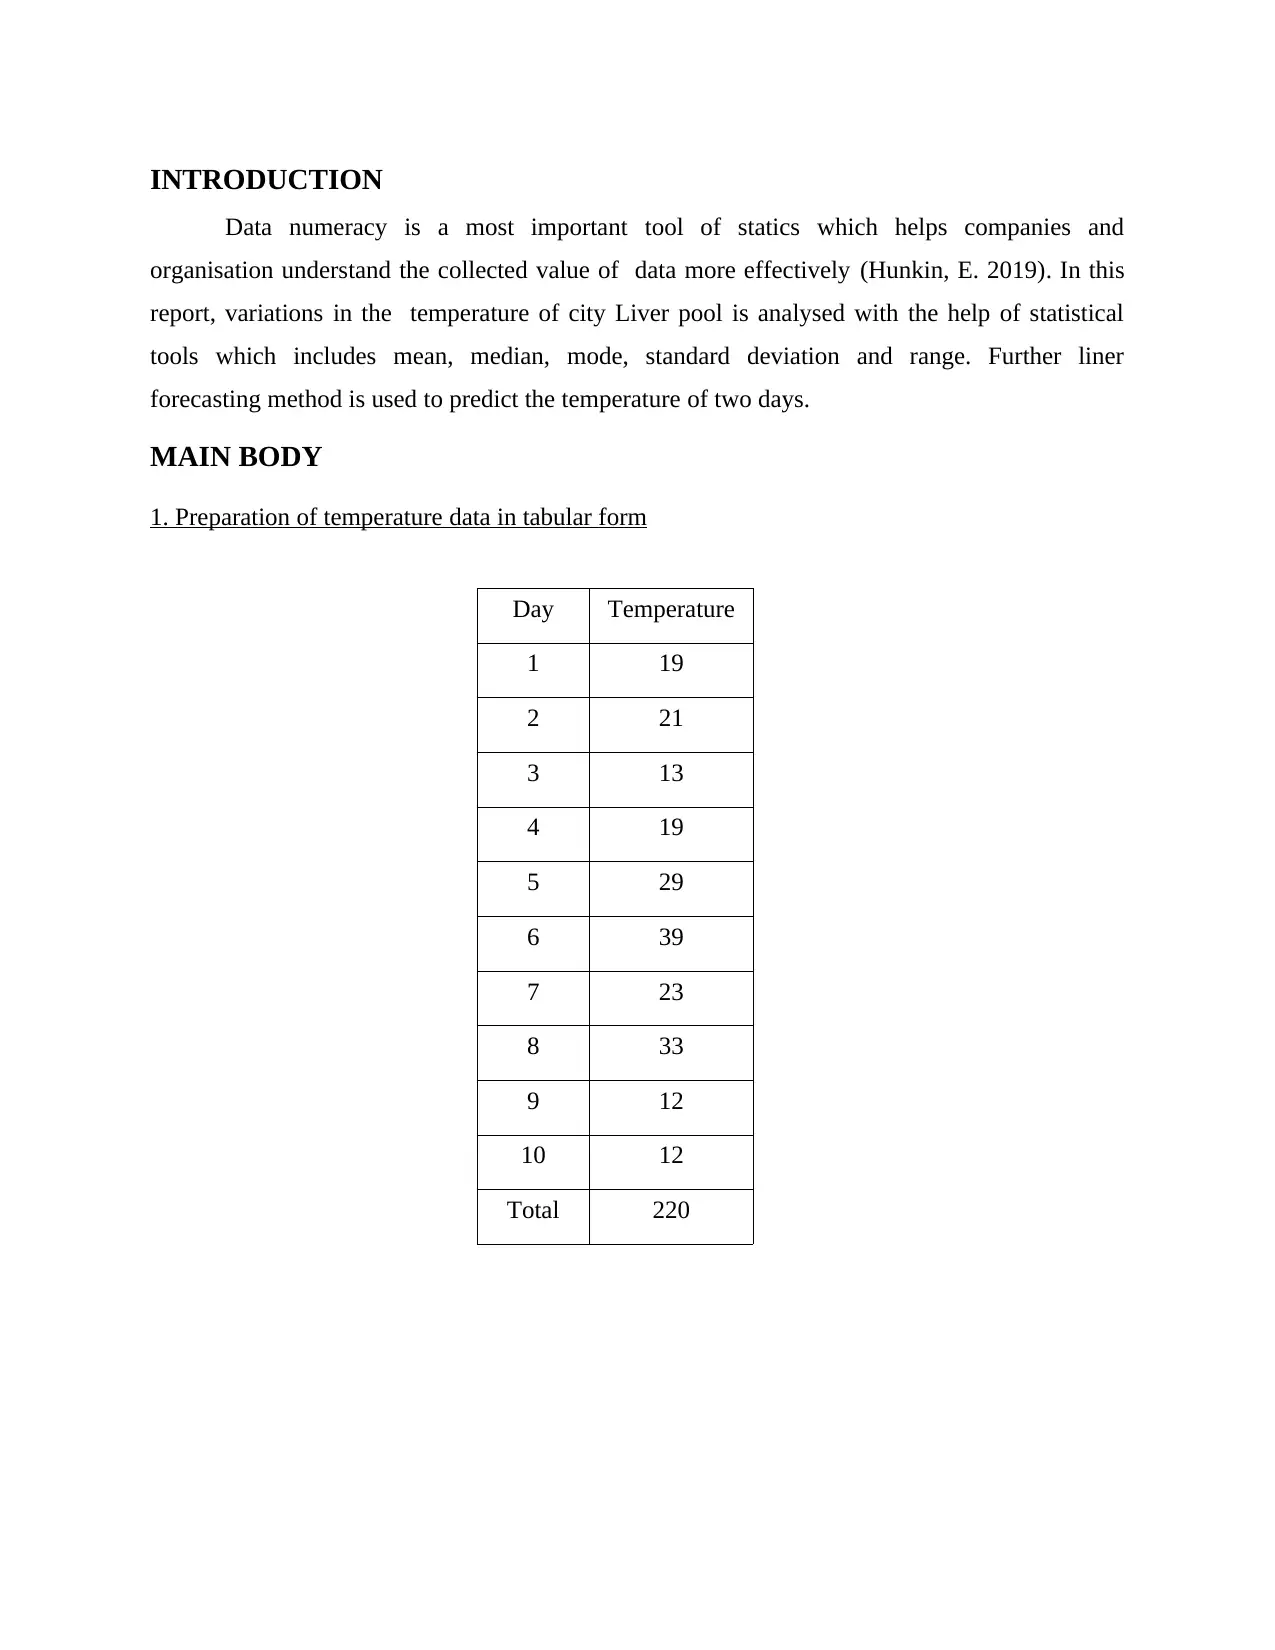
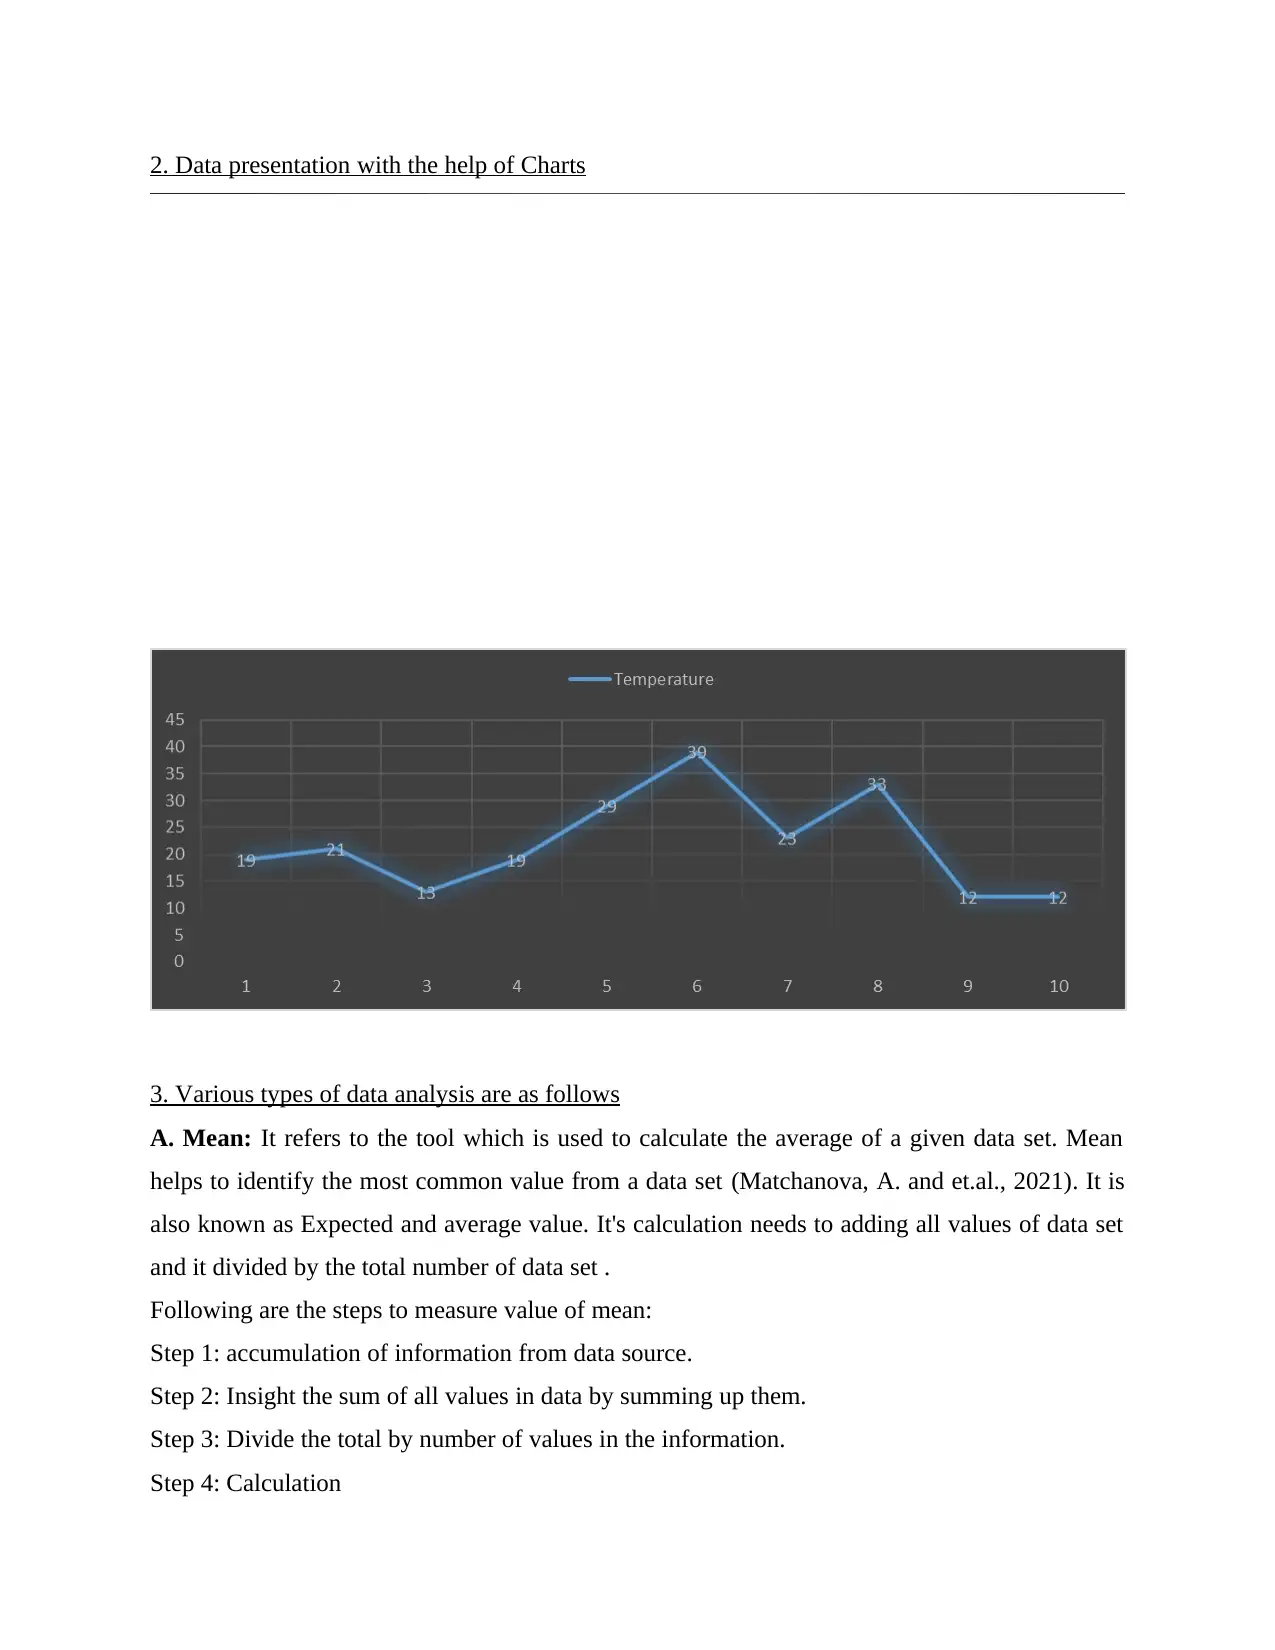
This report provides a comprehensive analysis of temperature variations in Liverpool using various statistical tools and data numeracy principles. It covers the preparation of temperature data in tabular form, data presentation with charts, and different types of data analysis including mean, median, mode, range, and standard deviation. The report further utilizes a linear forecasting model (Y = mx + c) to predict temperatures for future days, demonstrating the practical application of statistical methods in environmental analysis. The findings highlight the importance of data analysis in understanding and predicting temperature patterns.
Document Page
Numeracy and Data
Analysis
tabler-icon-diamond-filled.svg

Paraphrase This Document

Need a fresh take? Get an instant paraphrase of this document with our AI Paraphraser
Document Page
Table of Contents
INTRODUCTION ..........................................................................................................................3
MAIN BODY...................................................................................................................................3
1. Preparation of temperature data in tabular form.................................................................3
2. Data presentation with the help of Charts..........................................................................4
3. Various types of data analysis are as follows.....................................................................4
4. Computation of m, c by the help of linear forecasting model that is Y= mx + c ..............6
CONCLUSION ...............................................................................................................................8
REFERENCES................................................................................................................................9
Document Page
INTRODUCTION
Data numeracy is a most important tool of statics which helps companies and
organisation understand the collected value of data more effectively (Hunkin, E. 2019). In this
report, variations in the temperature of city Liver pool is analysed with the help of statistical
tools which includes mean, median, mode, standard deviation and range. Further liner
forecasting method is used to predict the temperature of two days.
MAIN BODY
1. Preparation of temperature data in tabular form
Day Temperature
1 19
2 21
3 13
4 19
5 29
6 39
7 23
8 33
9 12
10 12
Total 220
Document Page
2. Data presentation with the help of Charts
3. Various types of data analysis are as follows
A. Mean: It refers to the tool which is used to calculate the average of a given data set. Mean
helps to identify the most common value from a data set (Matchanova, A. and et.al., 2021). It is
also known as Expected and average value. It's calculation needs to adding all values of data set
and it divided by the total number of data set .
Following are the steps to measure value of mean:
Step 1: accumulation of information from data source.
Step 2: Insight the sum of all values in data by summing up them.
Step 3: Divide the total by number of values in the information.
Step 4: Calculation
tabler-icon-diamond-filled.svg

Paraphrase This Document

Need a fresh take? Get an instant paraphrase of this document with our AI Paraphraser
Document Page
Mean of Temperature – Sum of data set/Total number of dataset
Mean = 220/10
Mean = 22
B. Median: It refers to the tool which helps to identify the middle value of given data set. In
other words median represent the centralise value in a shorted, acceding or descending list of
values of a data set (Mellyzar, M. and et.al., 2022).
Following are the steps to measure value of median:
Step 1: Set up data set in ascending or descending order.
Step 2: Numeration of entire number of values in the data set.
Step 3: Ascertain whether the dataset is odd or even.
Step 4: For odd number of observations the formula is:
Median = N + ½
Step 5: For even number of observations the formula is:
Median = N/2
Final steps for computation of median is as follows:
19, 21, 13, 19, 29, 39, 23, 33, 12, 12
12, 12, 13, 19, 19, 21, 23, 29, 33, 39
Median = (10+1)/2
Median = 5.6
The median values are at the 5th and 6th positions.
Median = (19+21) / 2
Median = 20
C. Mode: Mode represent the value which is most repeated in a given data set. It is an important
measure of central tendency apart from mean and median (Nalawade, R.K. More and Bhola,
2019).
Following are the steps to measure value of mode:
Step 1: Collect and organise data in ascending or descending order.
Step 2: Determine all distinct values in dataset.
Step 3: Figure out the repetitions of distinct values.
Step 4: The most frequent value is the mode.3. Various types of data analysis are as follows:
Document Page
19, 21, 13, 19, 29, 39, 23, 33, 12, 12
12, 12, 13, 19, 19, 21, 23, 29, 33, 39
Mode = 12 & 19
D. Range: It refers to the difference between the highest value and the lowest value of a given
data set. It helps to analyse the data of a spreadsheet (O'Reilly, R. and et.al., 2020).
Following are the steps to measure value of mode:
Step 1: Set up the values in dataset in correct order.
Step 2: Find out the smallest and highest value.
Step 3: Deduct the last-place figure from the highest figure.
Step 4: Final computation for range
Range = Highest value – Smallest Value
Range = 39 - 12
Range = 27
E. Standard Deviation: It displays the expected amount of variability in a given data set.
It is square root of variance (Shiyanbola, O.O. and et.al., 2018).
Following are the steps to measure value of standard deviation:
Step 1: Ascertain the mean of dataset by summing up all value ascertained by total amount
of values.
Step 2: Calculate the variation of each value from the mean.
Step 3: Square up each variation from the mean.
Step 4: Calculate the total amount of squares.
Step 5: Total is divided by the number of data to discovery variance.
Step 6: Insight the square root of the variance.
Standard Deviation = √∑ (xi – μ) 2 / N
= √(760/10)
Standard Deviation = 8.717
4. Computation of m, c by the help of linear forecasting model that is Y= mx + c
Linear forecasting model: It is a statistical tool that measure and assume a value which
is related to the future with the help of liner regression (Tzur-Tseva, A. and et.al., 2022). This
tool is help to predict temperature which is depend on historical events or activities and it is the
single way to analyse this.
Document Page
Following are the steps to analyse linear forecasting model:
Step 1: Examine the given trouble in hand.
Step 2: Collect needed information.
Step 3: Start observation of the data from the beginning.
Step 4: Utilize the expression to find out the future assumptions.
y = mx + C
here, 'y' represents interdependent factor
'mx' represents interdependent factor
'C' lie to constant factor
Following are the steps to compute 'm':
Step 1: Compute the sum-up of x and y variable.
Step 2: Multiply each x and y value of data set and compute sum-up ∑xy
Step 3: After that figure out square roots of both x and y values.
Step 4: Figure out the value of 'm' in given expression
m = 10*1308 – (55*220) / 10*385 – (55)2
m = 980/825
m = 1.18
Following are the steps to compute 'c':
Step 1: Calculate the sum-up of y variable
Step 2: Take value of 'm'.
Step 3: Multiply the sum-up of x variable with 'm'.
Step 4: Subtract the above computed value from sum-up of y.
Step 5: Find out the resultant value by 'n'.
tabler-icon-diamond-filled.svg

Paraphrase This Document

Need a fresh take? Get an instant paraphrase of this document with our AI Paraphraser
Document Page
C = [220 - (1.18*55)] / 10
C = (220-64.9) / 10
C = 15.51
Temperature for day 11:
m = 1.18, C = 15.51, x = 11
y = mx + C
y = 1.18*11 + 15.51
y = 28.49
Temperature for day 14:
m = 1.18, C = 15.51, x = 14
y = mx + C
y = 1.18*14 + 15.51
y = 32.03
CONCLUSION
From the above report it can be concluded that the statistical tools and principles of data
analysis plays important role in analysis of temperature of the city Liverpool which is situated in
UK. This report consider various methods such as mean, median, mode, range, standard
deviation and finally linear forecasting theory for future predictions. These methods helps to
predict the temperature of two days.
Document Page
REFERENCES
Books and Journals
Hunkin, E. 2019. Being seen and being changed: A story of ‘quality’early childhood education
and the global education reform movement. In Challenging the Intersection of Policy
with Pedagogy. (pp. 193-209). Routledge.
Matchanova, A. and et.al., 2021. Latent structure of health literacy and its association with
health-related management and decision-making in HIV. Psychology & Health. 36(8),
pp.985-1002.
Mellyzar, M. and et.al., 2022. Hubungan Self-efficacy dan Kemampuan Literasi Numerasi
Siswa: Ditinjau Berdasarkan Gender. Lantanida Journal. 9(2).
Nalawade, R.K., More, D.K. and Bhola, S.S., 2019. Employability skills required for functional
areas of management. IUP Journal of Soft Skills. 13(1), pp.20-44.
O'Reilly, R. and et.al., 2020. Corrigendum to" First year undergraduate nursing students'
perceptions of the effectiveness of blended learning approaches for nursing
numeracy"[Nurse Educ. Pract. 45 (2020) 102800]. Nurse Education in Practice. 46,
pp.102825-102825.
Shiyanbola, O.O. and et.al., 2018. The association of health literacy with illness perceptions,
medication beliefs, and medication adherence among individuals with type 2
diabetes. Research in Social and Administrative Pharmacy. 14(9), pp.824-830.
Tzur-Tseva, A. and et.al., 2022. Thrombotic Thrombocytopenic Purpura and Pregnancy
Outcomes: A Cohort Study [A258]. Obstetrics & Gynecology. 139(1), pp.74S-75S.
von Gaudecker, H.M. and Wogrolly, A., 2021. Heterogeneity in households’ stock market
beliefs: Levels, dynamics, and epistemic uncertainty. Journal of E.
chevron_up_icon
1 out of 9
circle_padding
hide_on_mobile
zoom_out_icon
[object Object]