Business Decision Making: Data Analysis & Application of Statistics
VerifiedAdded on 2023/06/10
|19
|3184
|67
Report
AI Summary
This report focuses on business decision-making through data analysis for Ventrica Ltd, a telemarketing company in the UK. It outlines a plan for collecting primary and secondary data, including a questionnaire-based survey methodology and the use of secondary sources like financial statements. Statistical tools such as mean, median, correlation, standard deviation, and variance are applied to the collected data to aid in decision-making. The report presents findings through graphical representations and charts, drawing conclusions about Ventrica Ltd's financial performance, customer perceptions, and operational efficiency. The analysis includes insights from both primary survey responses and secondary financial data, ultimately providing recommendations for improvements in areas like customer communication and profitability.

BUSINESS
DECISION MAKING
DECISION MAKING
Paraphrase This Document
Need a fresh take? Get an instant paraphrase of this document with our AI Paraphraser

TABLE OF CONTENT
INTRODUCTION...........................................................................................................................3
MAIN BODY..................................................................................................................................3
Plan for collection of primary and secondary data-.....................................................................3
Statistical tools and techniques-...................................................................................................7
Graphical representation and findings of the report-.................................................................11
CONCLUSION..............................................................................................................................16
REFERENCES..............................................................................................................................18
⊘ This is a preview!⊘
Do you want full access?
Subscribe today to unlock all pages.
Trusted by 1+ million students worldwide
INTRODUCTION
Business decision-making refers to the process, where with respect to the organization
various key decisions are made on the basis of the various aspects such as data analysis
(McCarthy, Sheinberg, 2019) The report is aimed to collect both primary and secondary data for
a telemarketing company working in UK. The report would be presenting survey method and
sampling frame for the entity. Various statistical tools would also be applied on the data in order
to aid the business in making decision-making. At the end of the report graphs, chats will be
drafted using spreadsheet for presenting conclusion on the basis of the collected information.
MAIN BODY
Plan for collection of primary and secondary data-
Ventrica Ltd is one of the key performer in the telemarketing sector of the nation. It
operates it business in B2C form. The organization is best known for its customer management
services to other organization.
For carry out the research there will be two types of data are collected, primary and secondary.
The primary data stands for the set of information which are gathered first time by a
user, such information are used to fulfil certain research requirements of the research. The
primary data will be gathered by using appropriate method, in the report questionnaire will be
drafted in order to collect relevant information pertaining to the research. Primary data is very
much reliable since it is directly collected by the researcher so can avoid any possibility of being
bias, at the same time the data is collected keeping the main purpose of the research in mind
which also helps to align with the research requirement (Vlasák, Gerla, 2022)
The secondary data will be collected from various authentic sources such as official
website of the organization, some other financial magazine, financial statements, financial
reports etc. while collecting secondary data it would be taken into consideration that it must be
valid and from authentic sources, further with ability to fulfil the requirements of the research
Paraphrase This Document
Need a fresh take? Get an instant paraphrase of this document with our AI Paraphraser
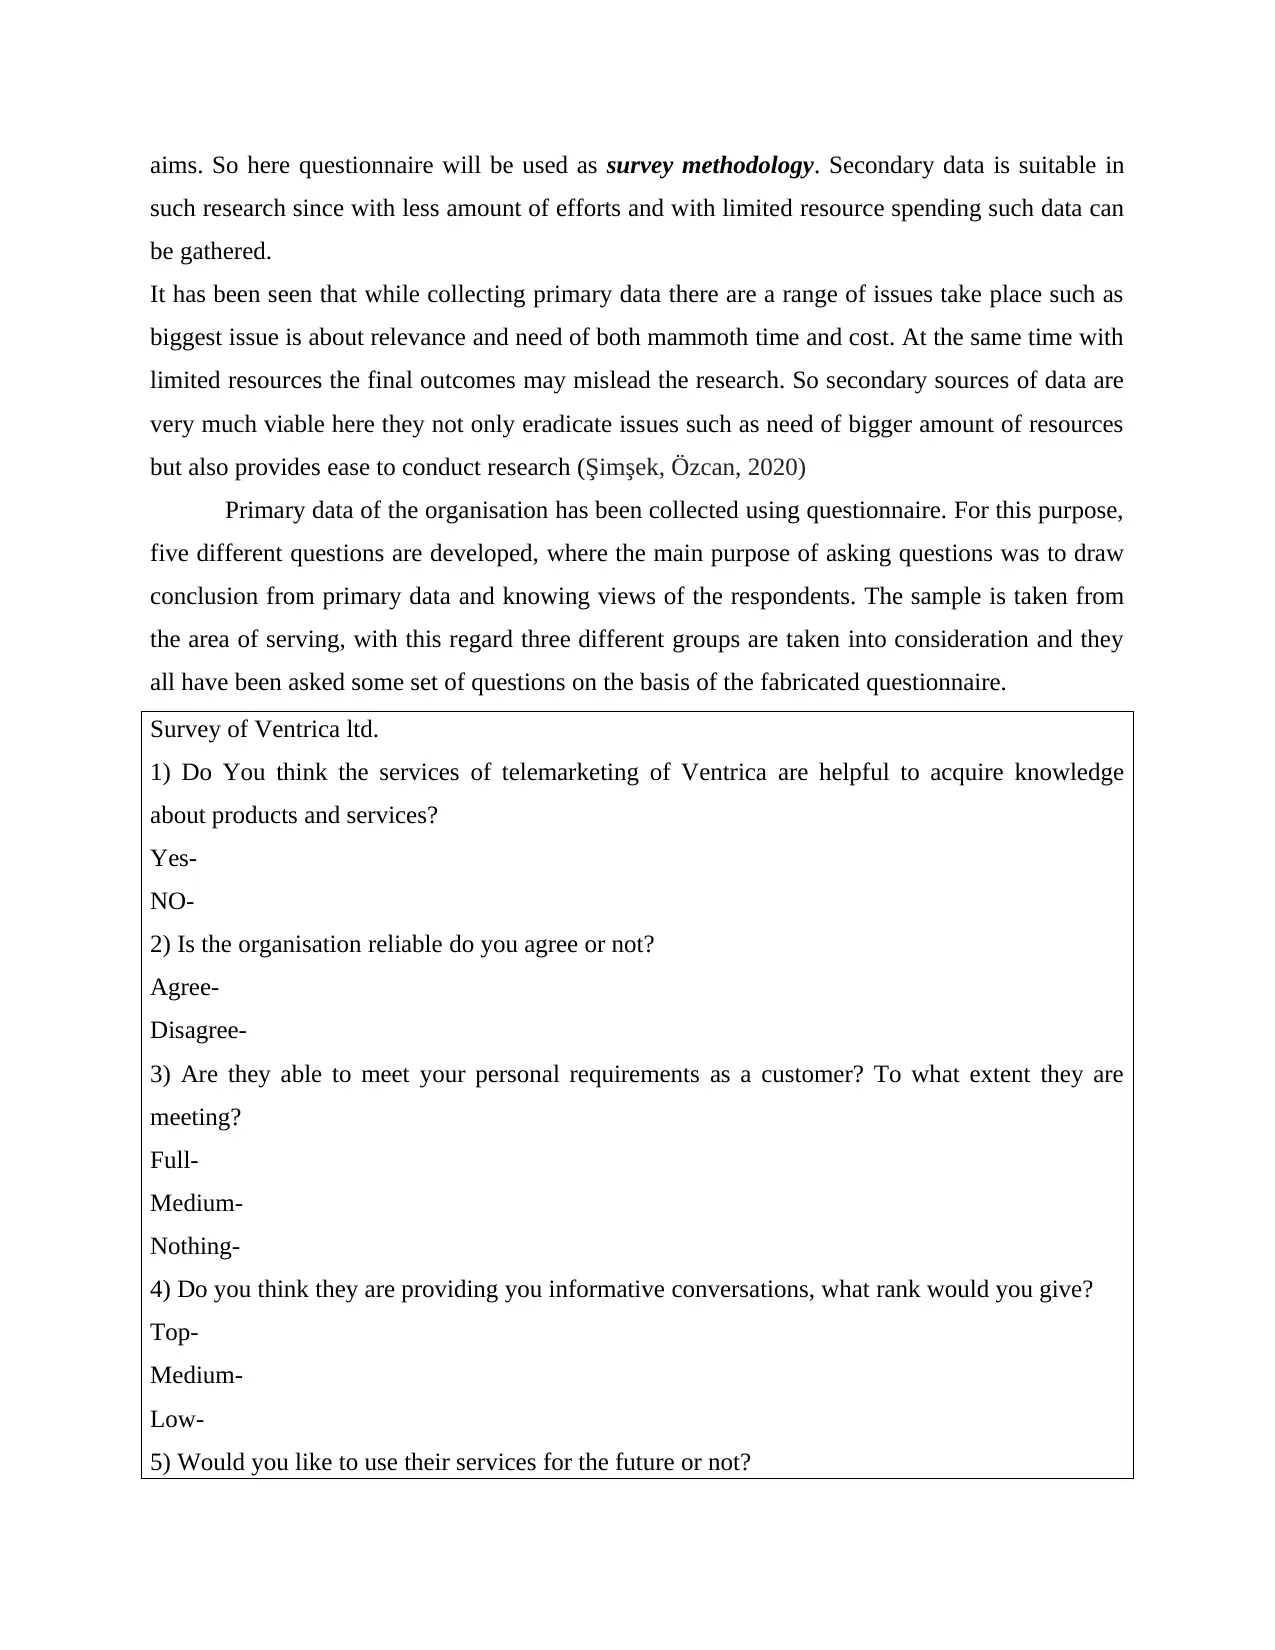
aims. So here questionnaire will be used as survey methodology. Secondary data is suitable in
such research since with less amount of efforts and with limited resource spending such data can
be gathered.
It has been seen that while collecting primary data there are a range of issues take place such as
biggest issue is about relevance and need of both mammoth time and cost. At the same time with
limited resources the final outcomes may mislead the research. So secondary sources of data are
very much viable here they not only eradicate issues such as need of bigger amount of resources
but also provides ease to conduct research (Şimşek, Özcan, 2020)
Primary data of the organisation has been collected using questionnaire. For this purpose,
five different questions are developed, where the main purpose of asking questions was to draw
conclusion from primary data and knowing views of the respondents. The sample is taken from
the area of serving, with this regard three different groups are taken into consideration and they
all have been asked some set of questions on the basis of the fabricated questionnaire.
Survey of Ventrica ltd.
1) Do You think the services of telemarketing of Ventrica are helpful to acquire knowledge
about products and services?
Yes-
NO-
2) Is the organisation reliable do you agree or not?
Agree-
Disagree-
3) Are they able to meet your personal requirements as a customer? To what extent they are
meeting?
Full-
Medium-
Nothing-
4) Do you think they are providing you informative conversations, what rank would you give?
Top-
Medium-
Low-
5) Would you like to use their services for the future or not?
Yes-
No-
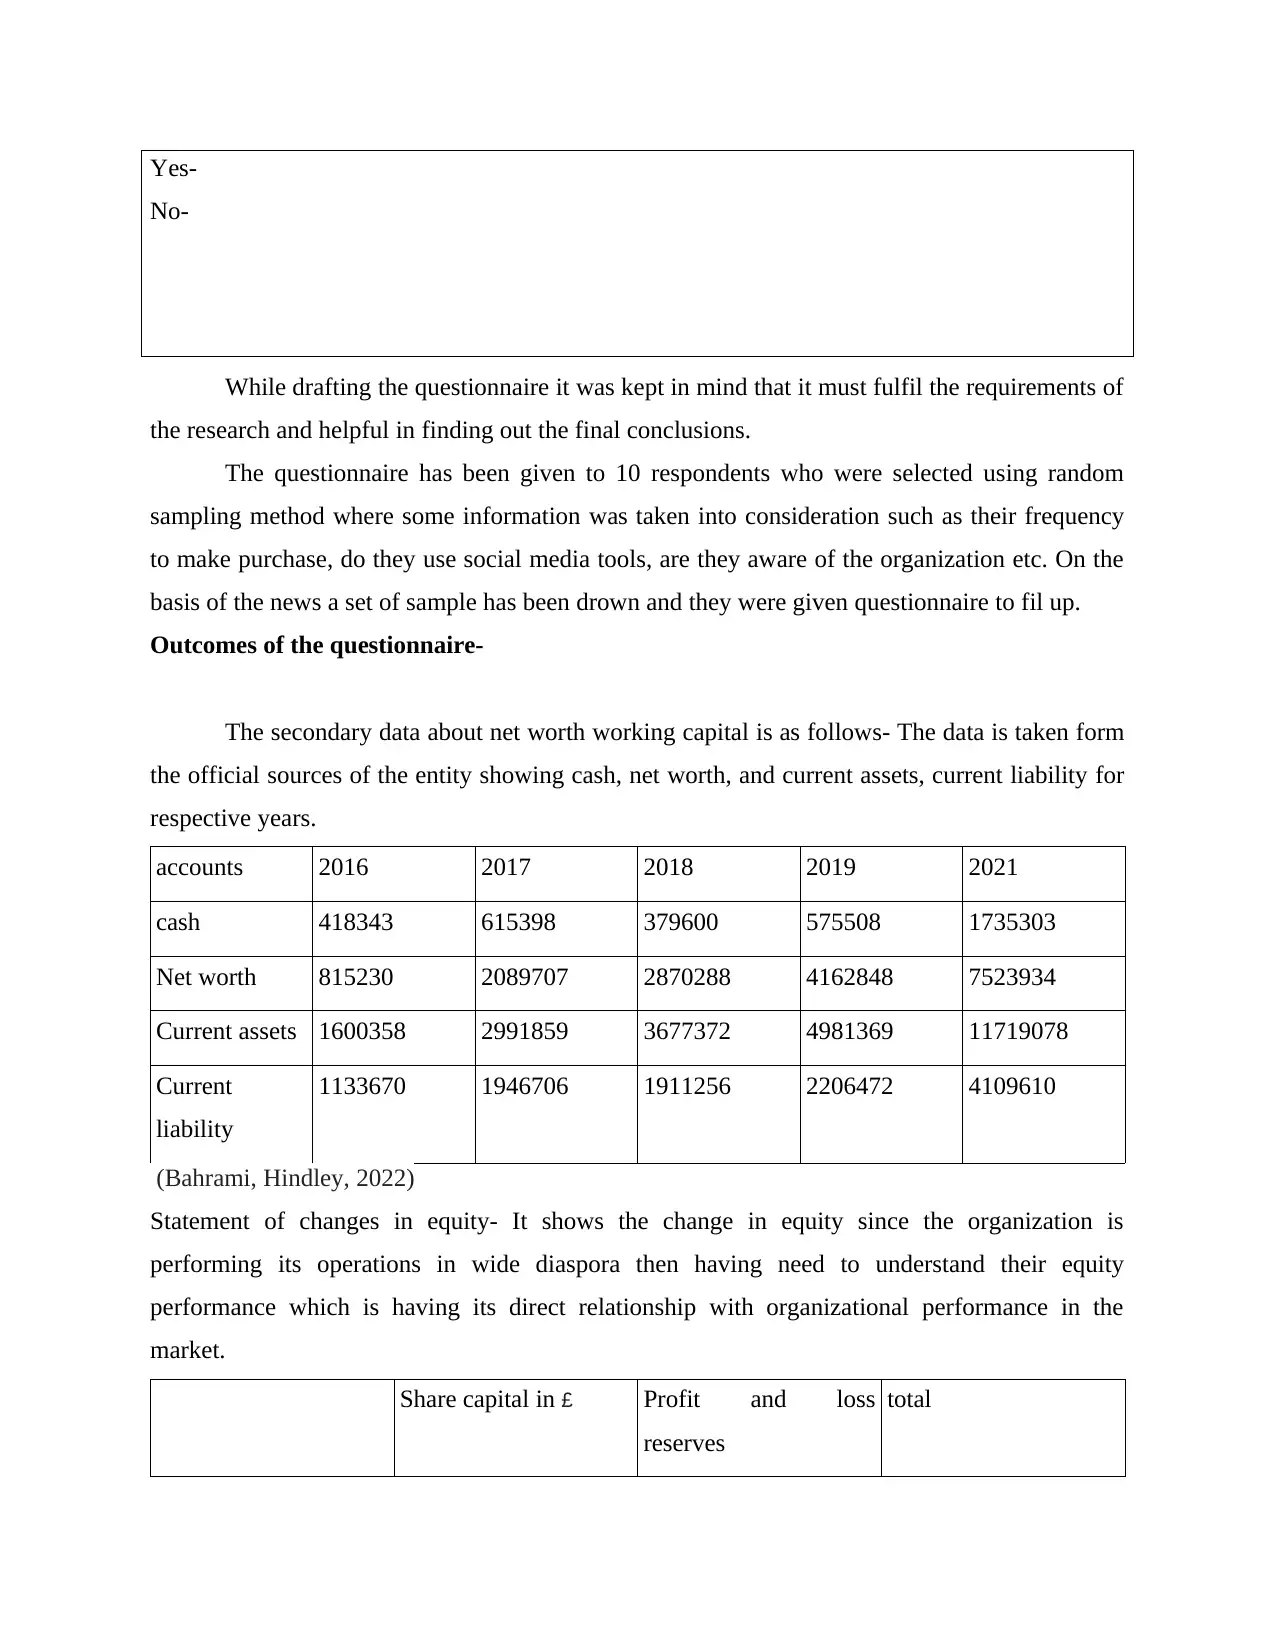
While drafting the questionnaire it was kept in mind that it must fulfil the requirements of
the research and helpful in finding out the final conclusions.
The questionnaire has been given to 10 respondents who were selected using random
sampling method where some information was taken into consideration such as their frequency
to make purchase, do they use social media tools, are they aware of the organization etc. On the
basis of the news a set of sample has been drown and they were given questionnaire to fil up.
Outcomes of the questionnaire-
The secondary data about net worth working capital is as follows- The data is taken form
the official sources of the entity showing cash, net worth, and current assets, current liability for
respective years.
accounts 2016 2017 2018 2019 2021
cash 418343 615398 379600 575508 1735303
Net worth 815230 2089707 2870288 4162848 7523934
Current assets 1600358 2991859 3677372 4981369 11719078
Current
liability
1133670 1946706 1911256 2206472 4109610
(Bahrami, Hindley, 2022)
Statement of changes in equity- It shows the change in equity since the organization is
performing its operations in wide diaspora then having need to understand their equity
performance which is having its direct relationship with organizational performance in the
market.
Share capital in £ Profit and loss
reserves
total
No-
While drafting the questionnaire it was kept in mind that it must fulfil the requirements of
the research and helpful in finding out the final conclusions.
The questionnaire has been given to 10 respondents who were selected using random
sampling method where some information was taken into consideration such as their frequency
to make purchase, do they use social media tools, are they aware of the organization etc. On the
basis of the news a set of sample has been drown and they were given questionnaire to fil up.
Outcomes of the questionnaire-
The secondary data about net worth working capital is as follows- The data is taken form
the official sources of the entity showing cash, net worth, and current assets, current liability for
respective years.
accounts 2016 2017 2018 2019 2021
cash 418343 615398 379600 575508 1735303
Net worth 815230 2089707 2870288 4162848 7523934
Current assets 1600358 2991859 3677372 4981369 11719078
Current
liability
1133670 1946706 1911256 2206472 4109610
(Bahrami, Hindley, 2022)
Statement of changes in equity- It shows the change in equity since the organization is
performing its operations in wide diaspora then having need to understand their equity
performance which is having its direct relationship with organizational performance in the
market.
Share capital in £ Profit and loss
reserves
total
⊘ This is a preview!⊘
Do you want full access?
Subscribe today to unlock all pages.
Trusted by 1+ million students worldwide
Balance at 1
November 2018
1 2972506 2972507
Period ended 31
October 2019
1410022 1410022
Balance at 31 October
2019
1 4382528 4382529
Period ended 30 April
2021
3916256 3916256
Balance at 30 April
2021
1 8298784 8298785
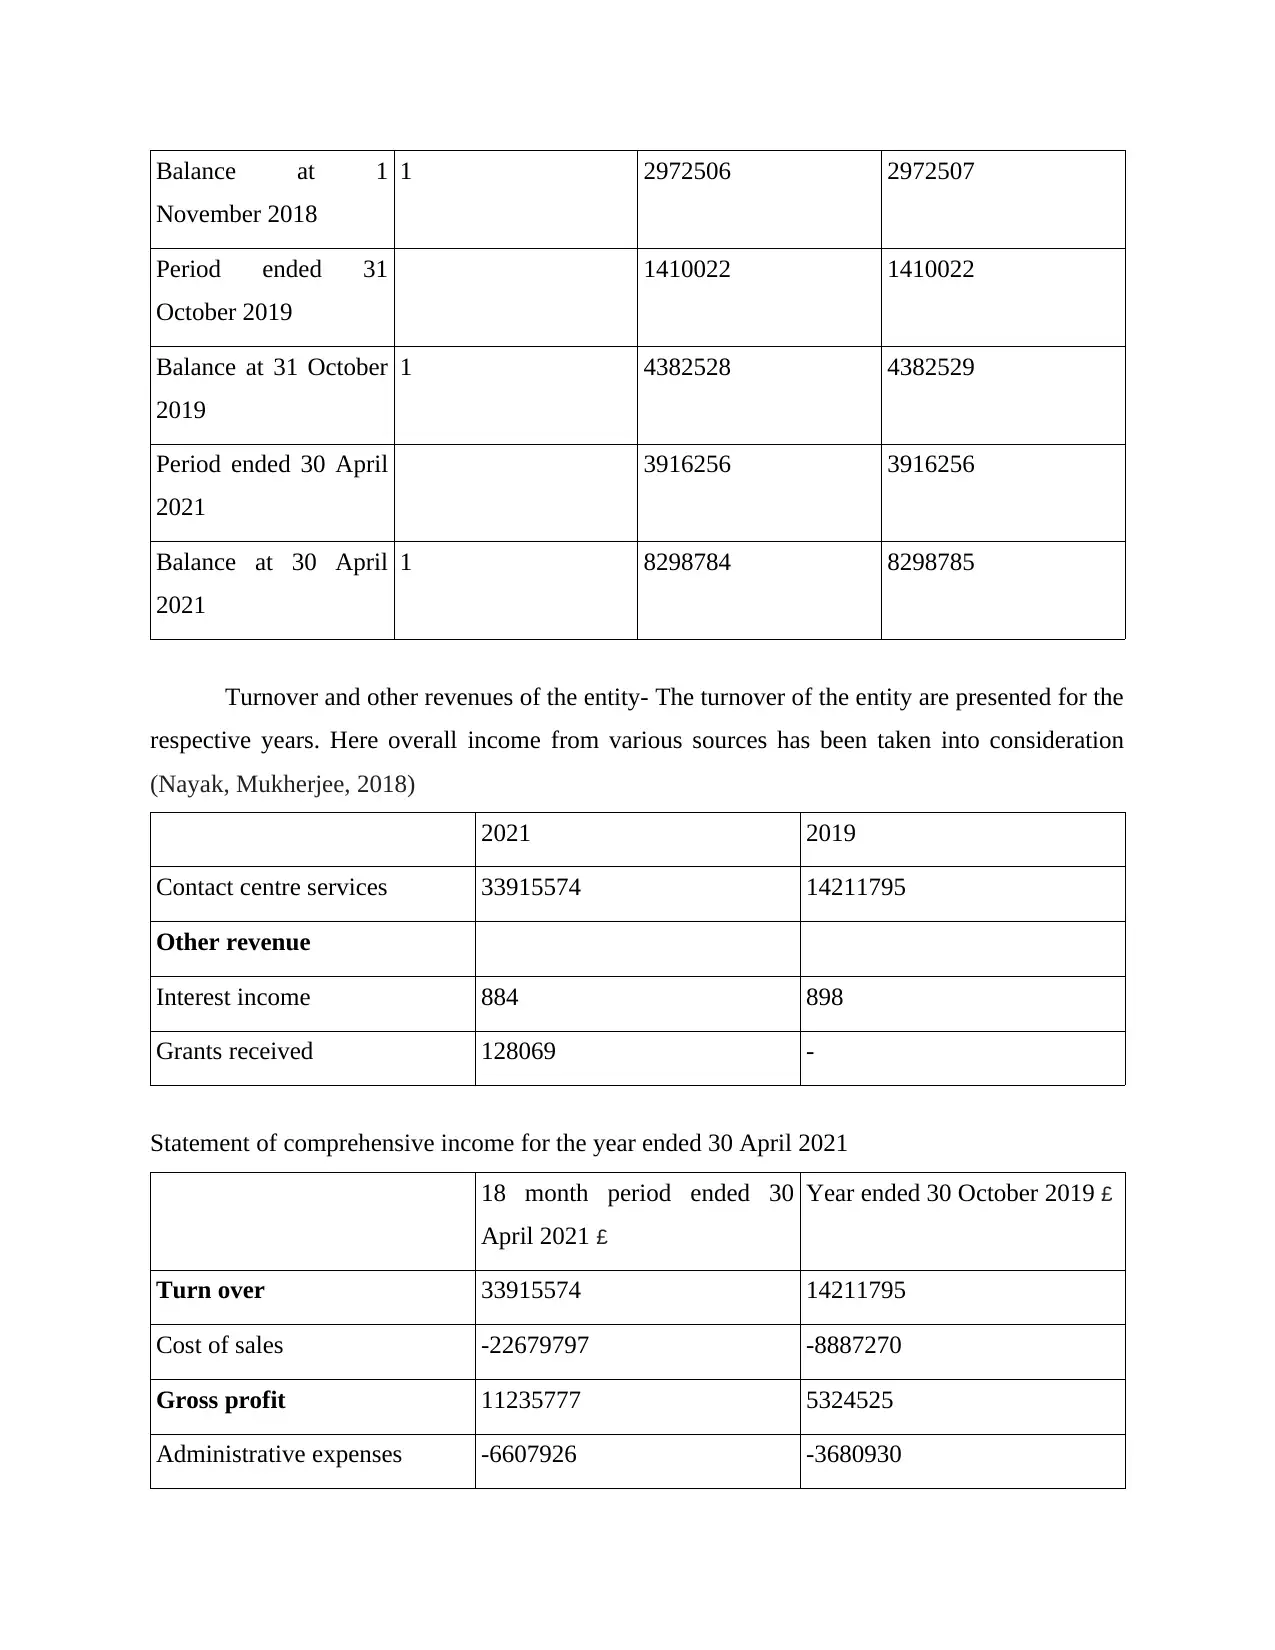
Turnover and other revenues of the entity- The turnover of the entity are presented for the
respective years. Here overall income from various sources has been taken into consideration
(Nayak, Mukherjee, 2018)
2021 2019
Contact centre services 33915574 14211795
Other revenue
Interest income 884 898
Grants received 128069 -
Statement of comprehensive income for the year ended 30 April 2021
18 month period ended 30
April 2021 £
Year ended 30 October 2019 £
Turn over 33915574 14211795
Cost of sales -22679797 -8887270
Gross profit 11235777 5324525
Administrative expenses -6607926 -3680930
November 2018
1 2972506 2972507
Period ended 31
October 2019
1410022 1410022
Balance at 31 October
2019
1 4382528 4382529
Period ended 30 April
2021
3916256 3916256
Balance at 30 April
2021
1 8298784 8298785
Turnover and other revenues of the entity- The turnover of the entity are presented for the
respective years. Here overall income from various sources has been taken into consideration
(Nayak, Mukherjee, 2018)
2021 2019
Contact centre services 33915574 14211795
Other revenue
Interest income 884 898
Grants received 128069 -
Statement of comprehensive income for the year ended 30 April 2021
18 month period ended 30
April 2021 £
Year ended 30 October 2019 £
Turn over 33915574 14211795
Cost of sales -22679797 -8887270
Gross profit 11235777 5324525
Administrative expenses -6607926 -3680930
Paraphrase This Document
Need a fresh take? Get an instant paraphrase of this document with our AI Paraphraser
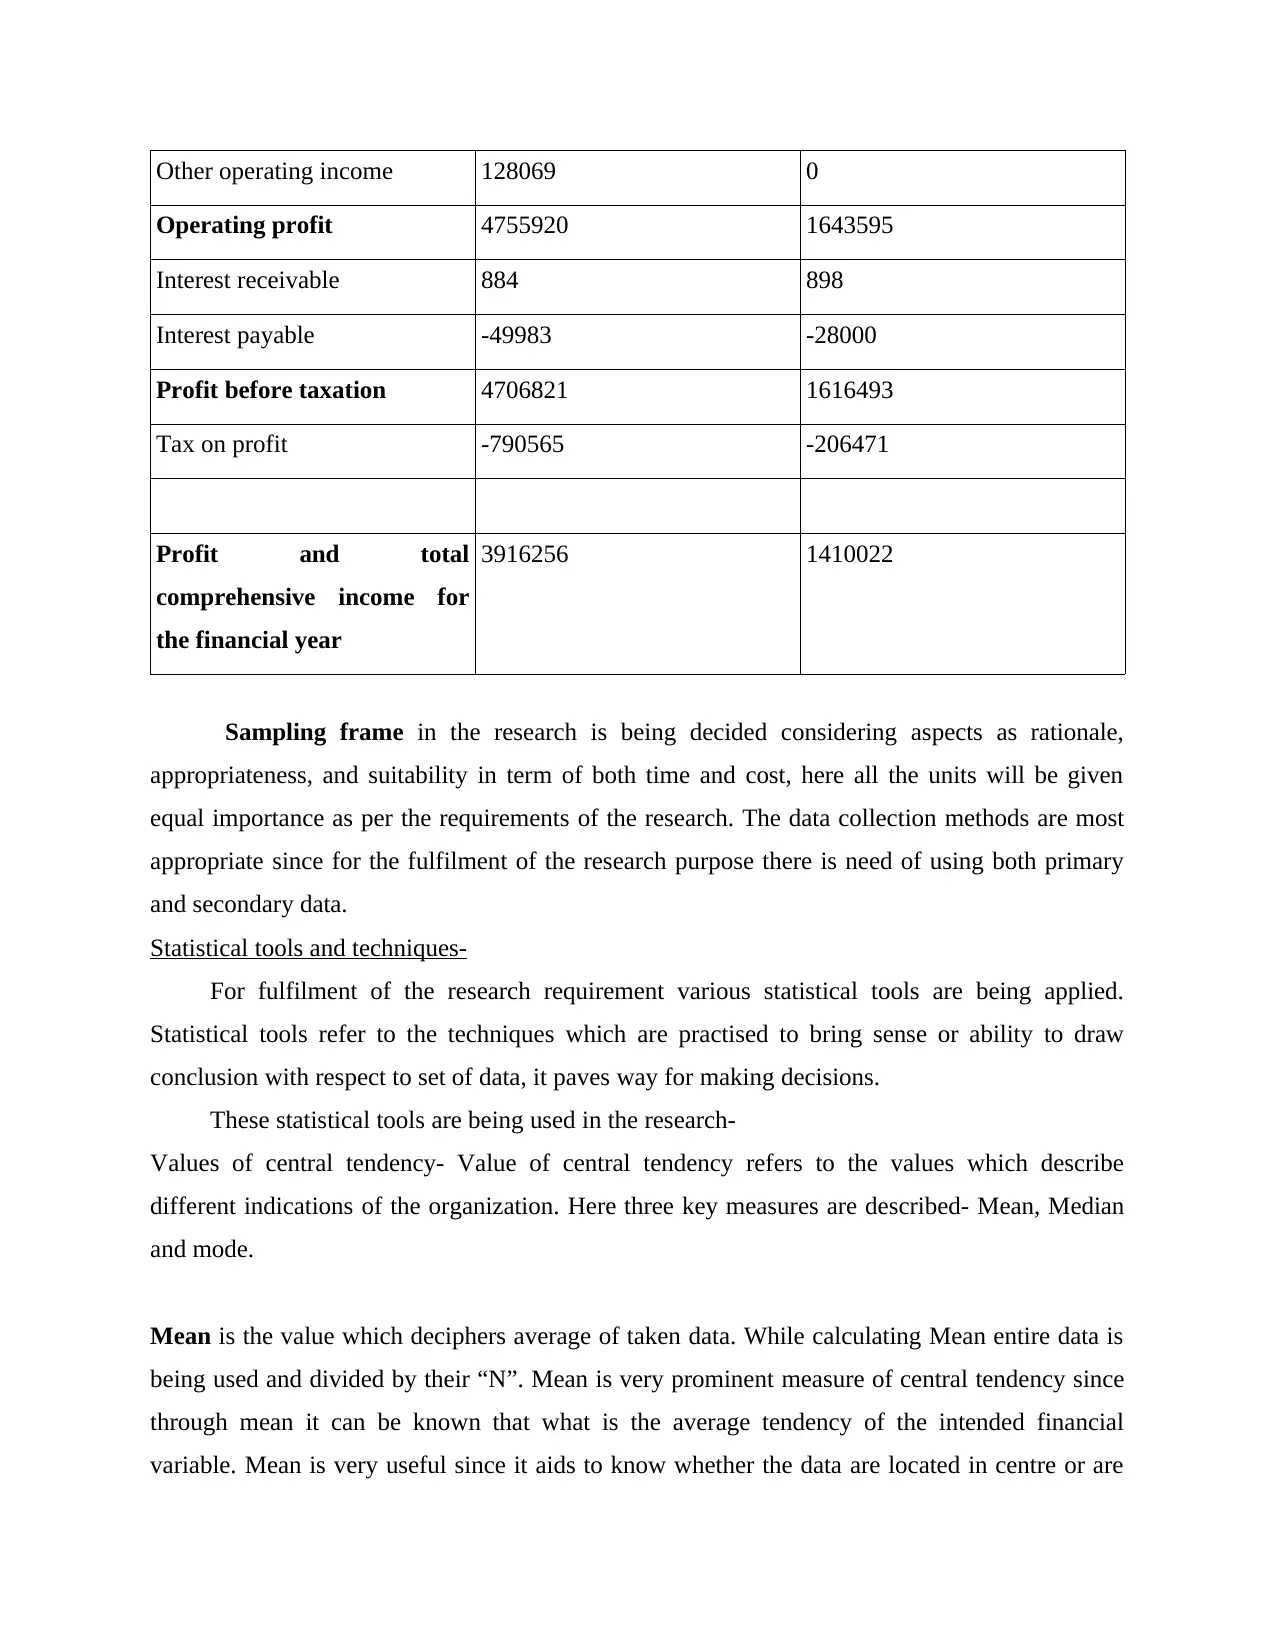
Other operating income 128069 0
Operating profit 4755920 1643595
Interest receivable 884 898
Interest payable -49983 -28000
Profit before taxation 4706821 1616493
Tax on profit -790565 -206471
Profit and total
comprehensive income for
the financial year
3916256 1410022
Sampling frame in the research is being decided considering aspects as rationale,
appropriateness, and suitability in term of both time and cost, here all the units will be given
equal importance as per the requirements of the research. The data collection methods are most
appropriate since for the fulfilment of the research purpose there is need of using both primary
and secondary data.
Statistical tools and techniques-
For fulfilment of the research requirement various statistical tools are being applied.
Statistical tools refer to the techniques which are practised to bring sense or ability to draw
conclusion with respect to set of data, it paves way for making decisions.
These statistical tools are being used in the research-
Values of central tendency- Value of central tendency refers to the values which describe
different indications of the organization. Here three key measures are described- Mean, Median
and mode.
Mean is the value which deciphers average of taken data. While calculating Mean entire data is
being used and divided by their “N”. Mean is very prominent measure of central tendency since
through mean it can be known that what is the average tendency of the intended financial
variable. Mean is very useful since it aids to know whether the data are located in centre or are
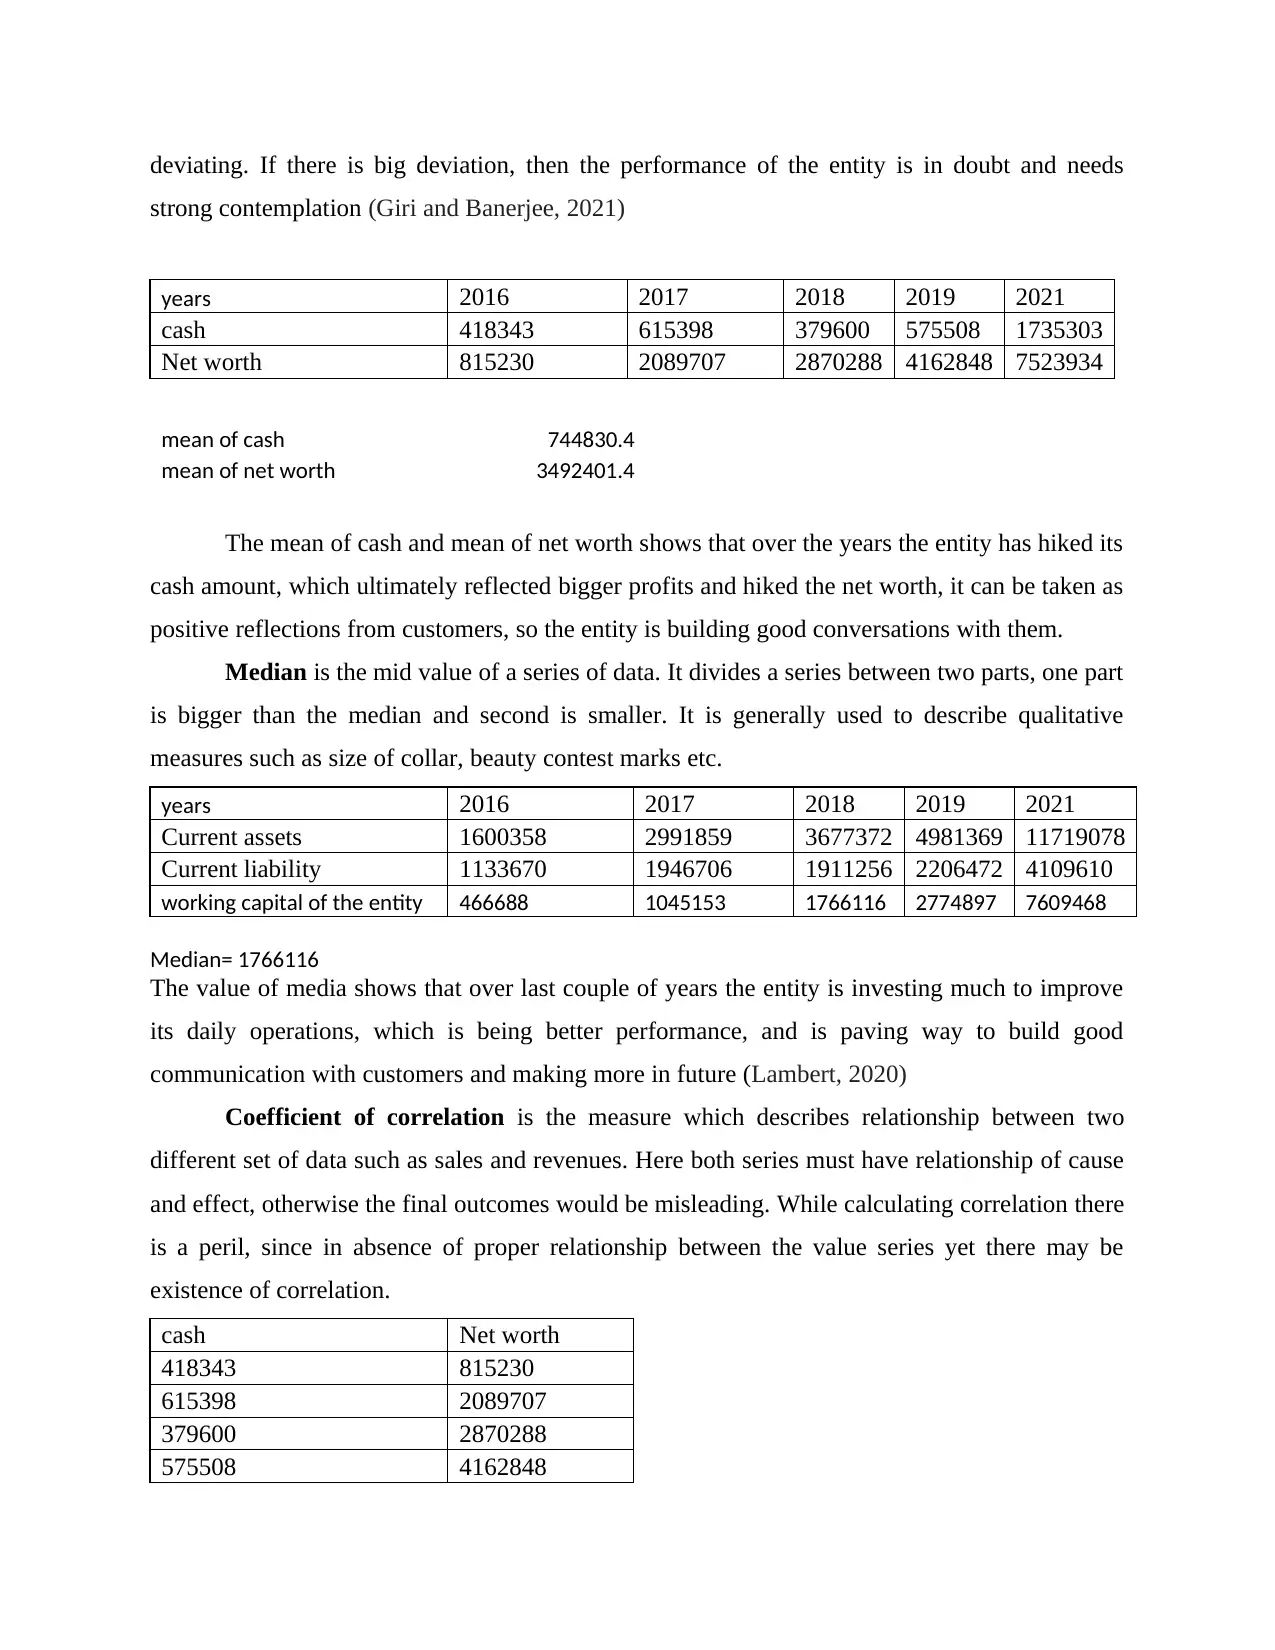
deviating. If there is big deviation, then the performance of the entity is in doubt and needs
strong contemplation (Giri and Banerjee, 2021)
years 2016 2017 2018 2019 2021
cash 418343 615398 379600 575508 1735303
Net worth 815230 2089707 2870288 4162848 7523934
mean of cash 744830.4
mean of net worth 3492401.4
The mean of cash and mean of net worth shows that over the years the entity has hiked its
cash amount, which ultimately reflected bigger profits and hiked the net worth, it can be taken as
positive reflections from customers, so the entity is building good conversations with them.
Median is the mid value of a series of data. It divides a series between two parts, one part
is bigger than the median and second is smaller. It is generally used to describe qualitative
measures such as size of collar, beauty contest marks etc.
years 2016 2017 2018 2019 2021
Current assets 1600358 2991859 3677372 4981369 11719078
Current liability 1133670 1946706 1911256 2206472 4109610
working capital of the entity 466688 1045153 1766116 2774897 7609468
Median= 1766116
The value of media shows that over last couple of years the entity is investing much to improve
its daily operations, which is being better performance, and is paving way to build good
communication with customers and making more in future (Lambert, 2020)
Coefficient of correlation is the measure which describes relationship between two
different set of data such as sales and revenues. Here both series must have relationship of cause
and effect, otherwise the final outcomes would be misleading. While calculating correlation there
is a peril, since in absence of proper relationship between the value series yet there may be
existence of correlation.
cash Net worth
418343 815230
615398 2089707
379600 2870288
575508 4162848
⊘ This is a preview!⊘
Do you want full access?
Subscribe today to unlock all pages.
Trusted by 1+ million students worldwide
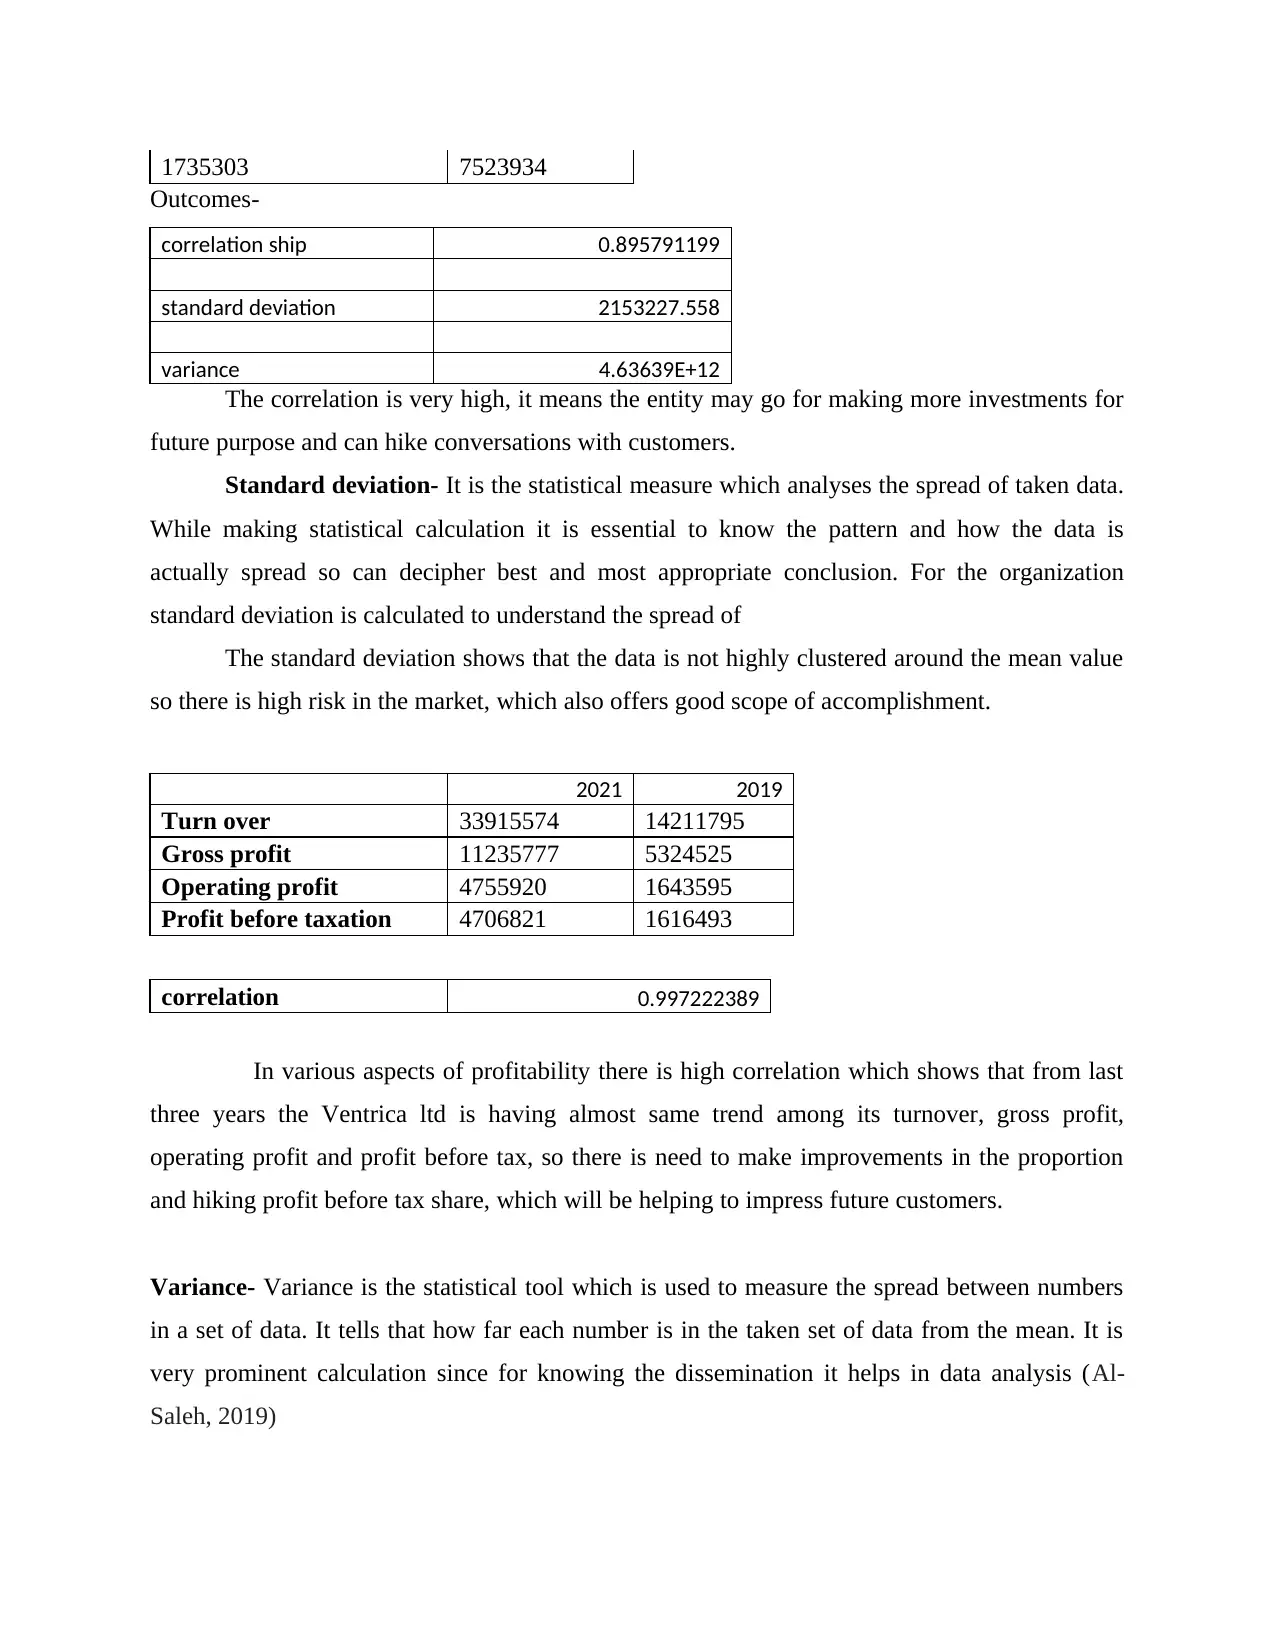
1735303 7523934
Outcomes-
correlation ship 0.895791199
standard deviation 2153227.558
variance 4.63639E+12
The correlation is very high, it means the entity may go for making more investments for
future purpose and can hike conversations with customers.
Standard deviation- It is the statistical measure which analyses the spread of taken data.
While making statistical calculation it is essential to know the pattern and how the data is
actually spread so can decipher best and most appropriate conclusion. For the organization
standard deviation is calculated to understand the spread of
The standard deviation shows that the data is not highly clustered around the mean value
so there is high risk in the market, which also offers good scope of accomplishment.
2021 2019
Turn over 33915574 14211795
Gross profit 11235777 5324525
Operating profit 4755920 1643595
Profit before taxation 4706821 1616493
correlation 0.997222389
In various aspects of profitability there is high correlation which shows that from last
three years the Ventrica ltd is having almost same trend among its turnover, gross profit,
operating profit and profit before tax, so there is need to make improvements in the proportion
and hiking profit before tax share, which will be helping to impress future customers.
Variance- Variance is the statistical tool which is used to measure the spread between numbers
in a set of data. It tells that how far each number is in the taken set of data from the mean. It is
very prominent calculation since for knowing the dissemination it helps in data analysis (Al-
Saleh, 2019)
Paraphrase This Document
Need a fresh take? Get an instant paraphrase of this document with our AI Paraphraser
Great amount of variance shows that the values are varying much, and the data is highly
spread so the organisation is having need to work on it.
Question-1 Question-2 Question-3 Question-4 Question-5
Mean 1.3 1.4 1.7 1.7 1.2
Standard
Error 0.152752523 0.163299316 0.260341656 0.260341656 0.133333333
Median 1 1 1.5 1.5 1
Mode 1 1 1 1 1
Standard
Deviation 0.483045892 0.516397779 0.823272602 0.823272602 0.421637021
Sample
Variance 0.233333333 0.266666667 0.677777778 0.677777778 0.177777778
Kurtosis
-
1.224489796
-
2.276785714 -1.043498292
-
1.043498292 1.40625
Skewness 1.035098339 0.484122918 0.686982378 0.686982378 1.778781184
Range 1 1 2 2 1
Minimum 1 1 1 1 1
Maximum 2 2 3 3 2
Sum 13 14 17 17 12
Count 10 10 10 10 10
From the questionnaire the views of respondents have been acquired and on the basis of
their views as above the final statistical calculation has been presented.
It shows that the mean is everywhere more than 1 which says that there are positive views
of the respondents about the organisation. At the same time the standard error is less than 1
which indicates that the discrepancy level is also lower.
Values of both Median and mode is either 1 or 1.5 in all five questions by all 10 respondents
which looks in the favour of Ventrica ltd. At the same time the variance has been higher about
question 3 and 4 which reveals that there is issues about information provided to the customers
that’s why they are showing diverse views (Fred Abraham, 2018)
But the most satisfactory aspect is that there is high skewness when it comes to the question 5,
where the futuristic approach of the respondents was asked and they have shown their positive
approach and they are showing willingness to get services of the organisation.
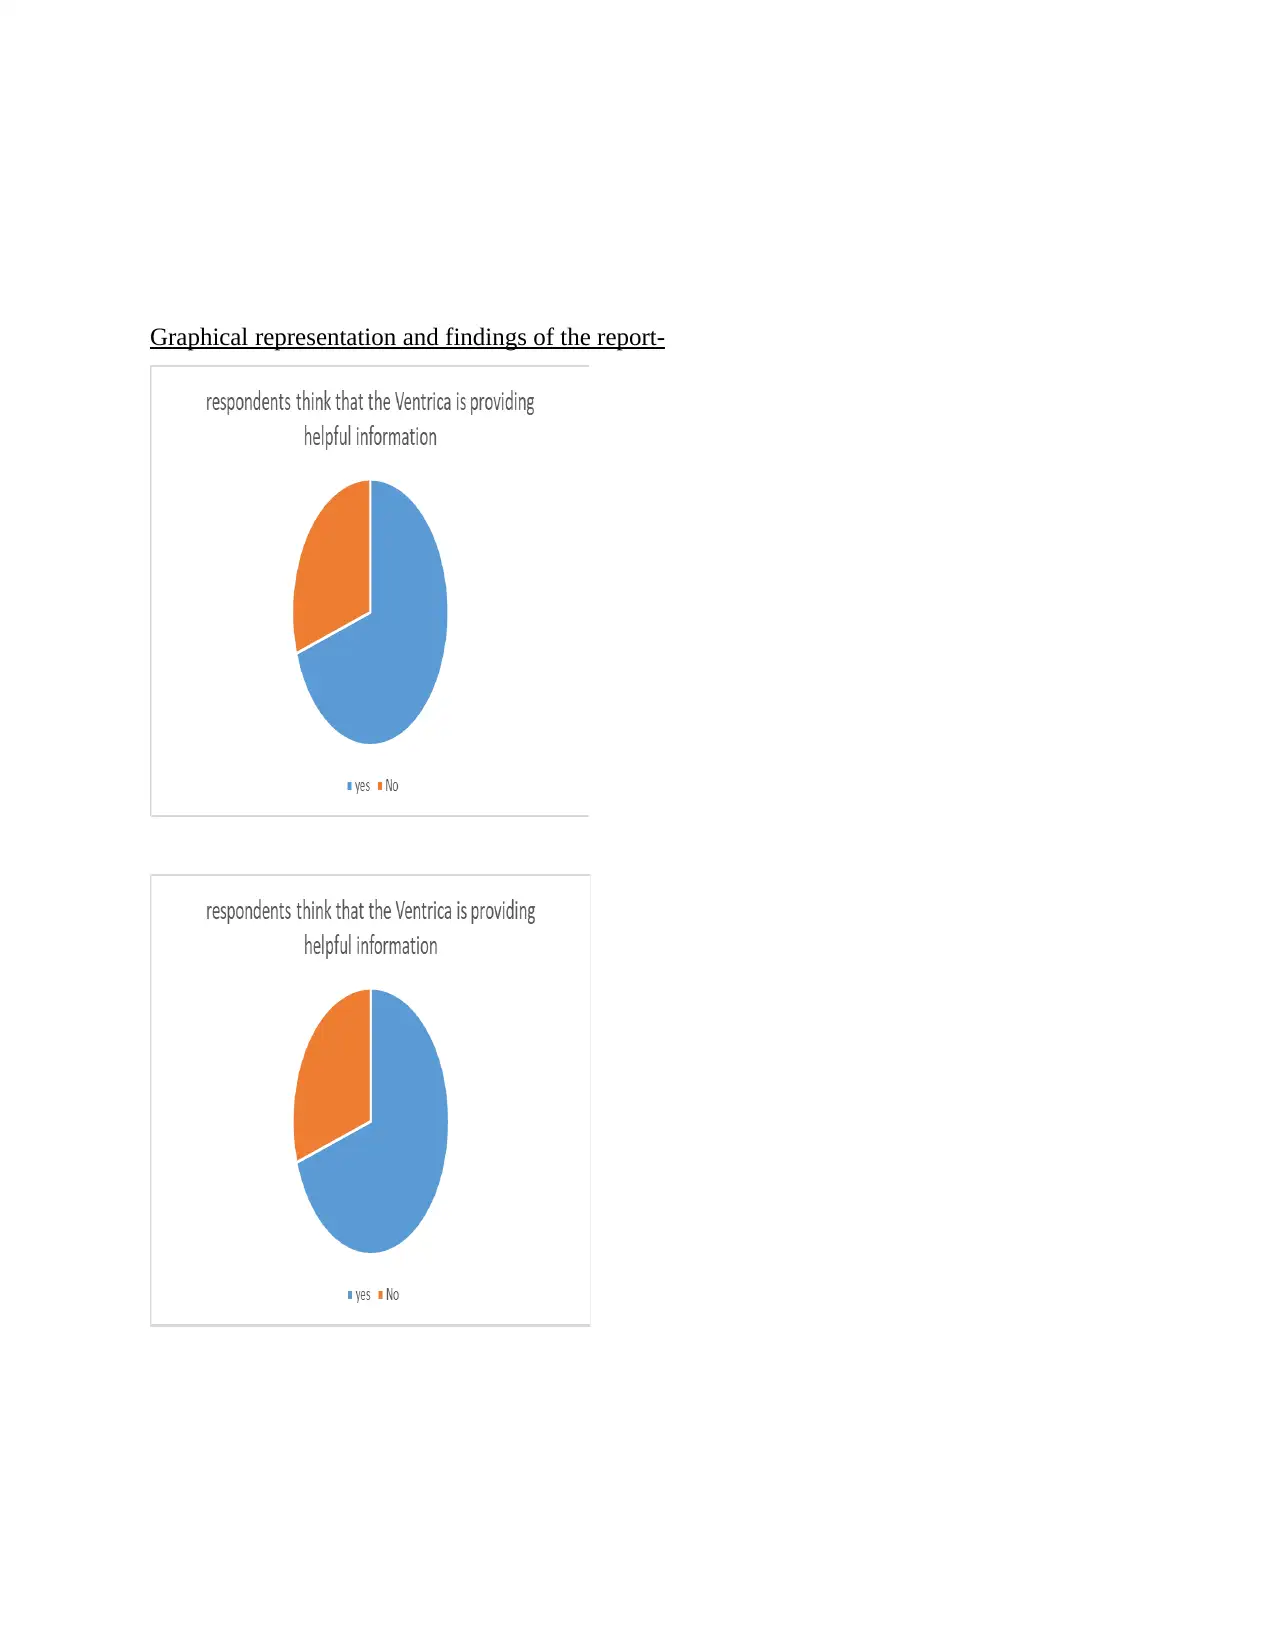
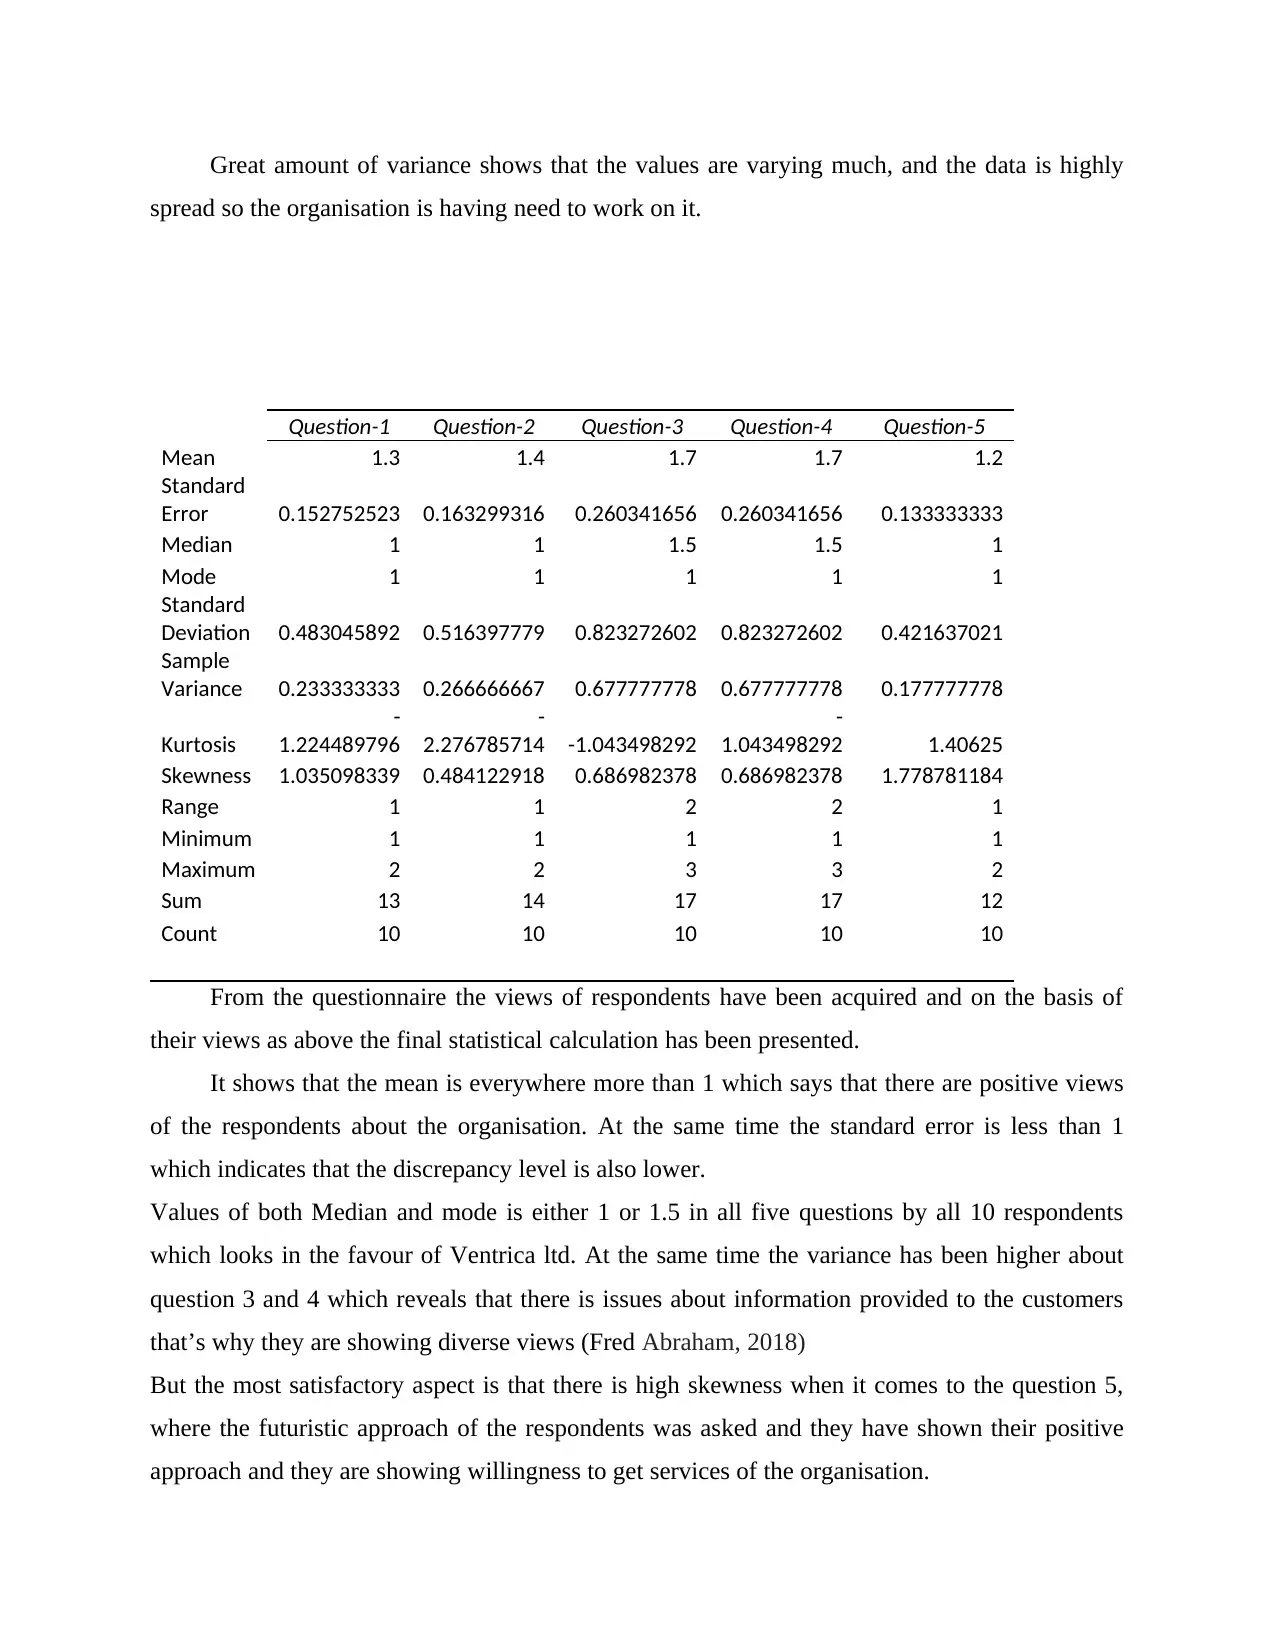
Graphical representation and findings of the report-
⊘ This is a preview!⊘
Do you want full access?
Subscribe today to unlock all pages.
Trusted by 1+ million students worldwide
1 out of 19
Related Documents


Your All-in-One AI-Powered Toolkit for Academic Success.
+13062052269
info@desklib.com
Available 24*7 on WhatsApp / Email
![[object Object]](/_next/static/media/star-bottom.7253800d.svg)
Unlock your academic potential
Copyright © 2020–2026 A2Z Services. All Rights Reserved. Developed and managed by ZUCOL.