Data Analysis of Welwyn Garden City Weather Report: Calculations
VerifiedAdded on 2020/11/12
|12
|1406
|265
Homework Assignment
AI Summary
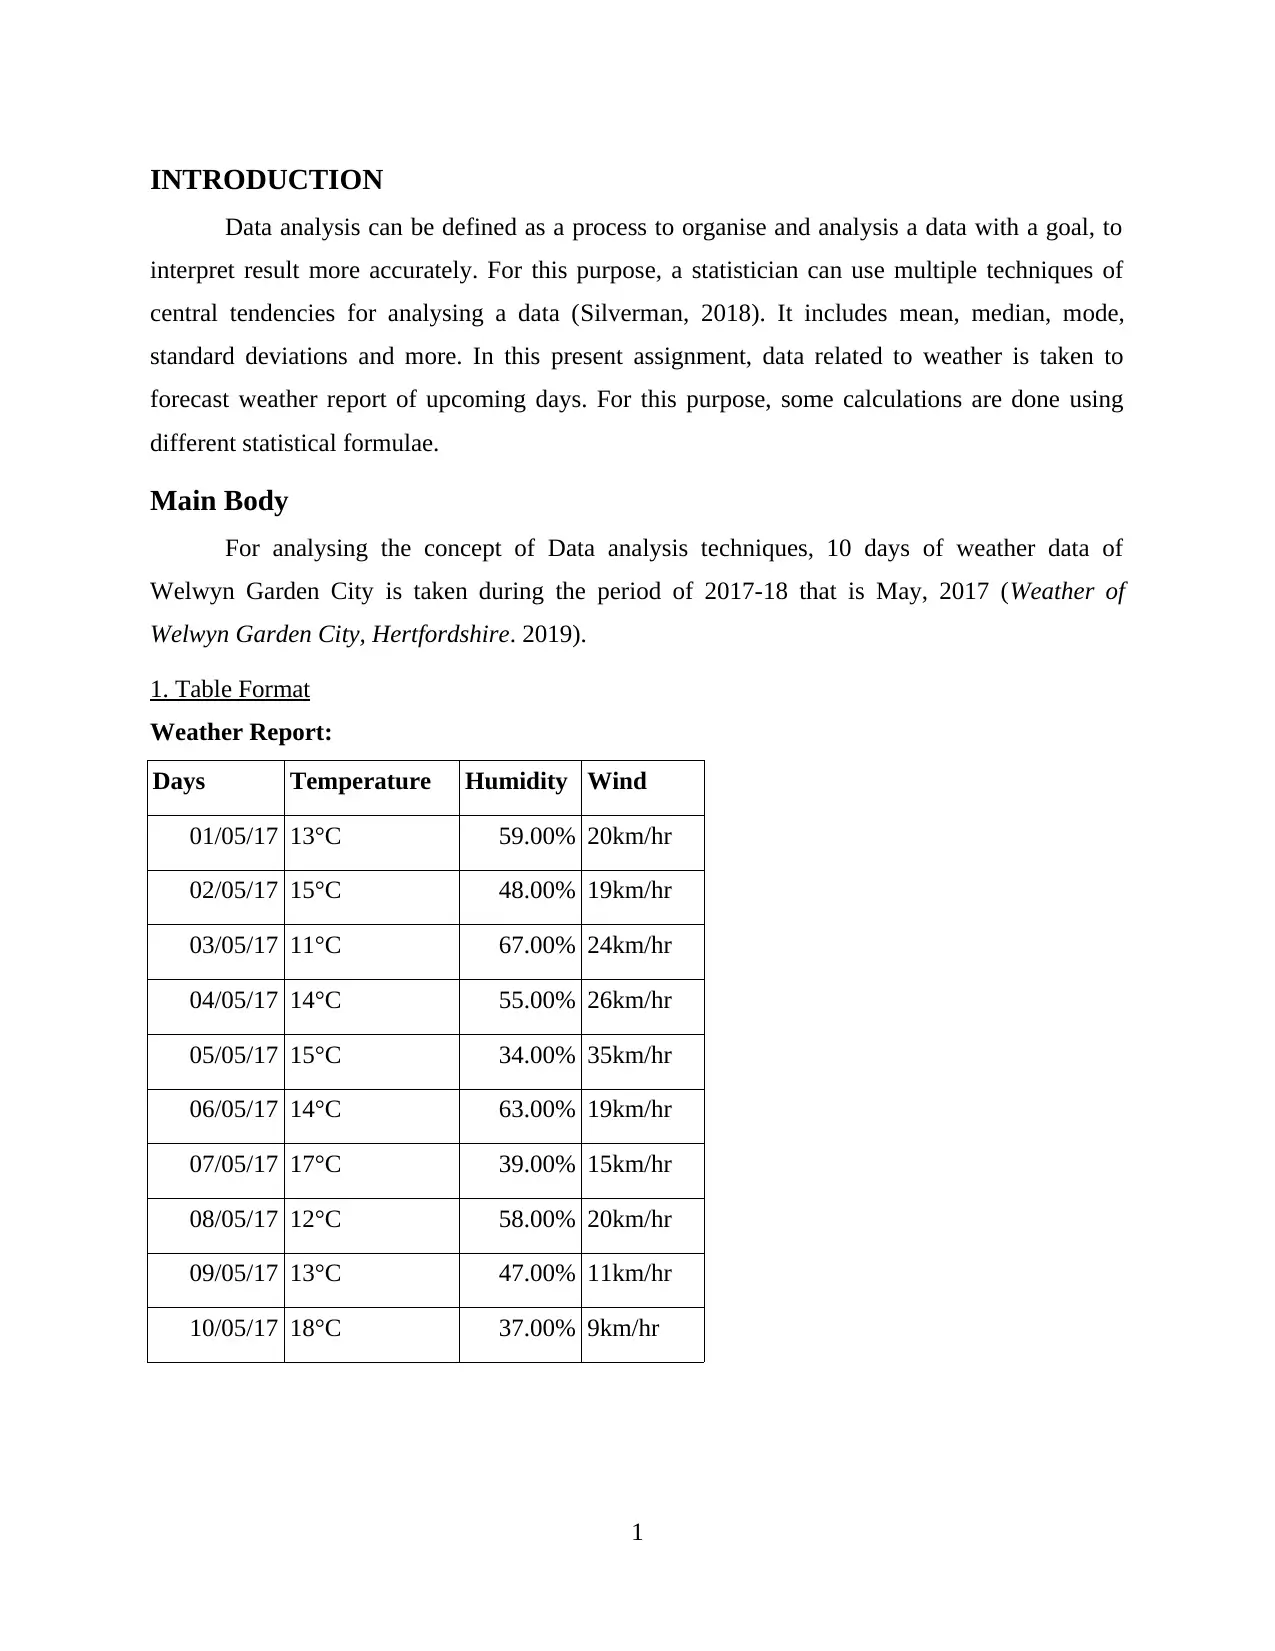
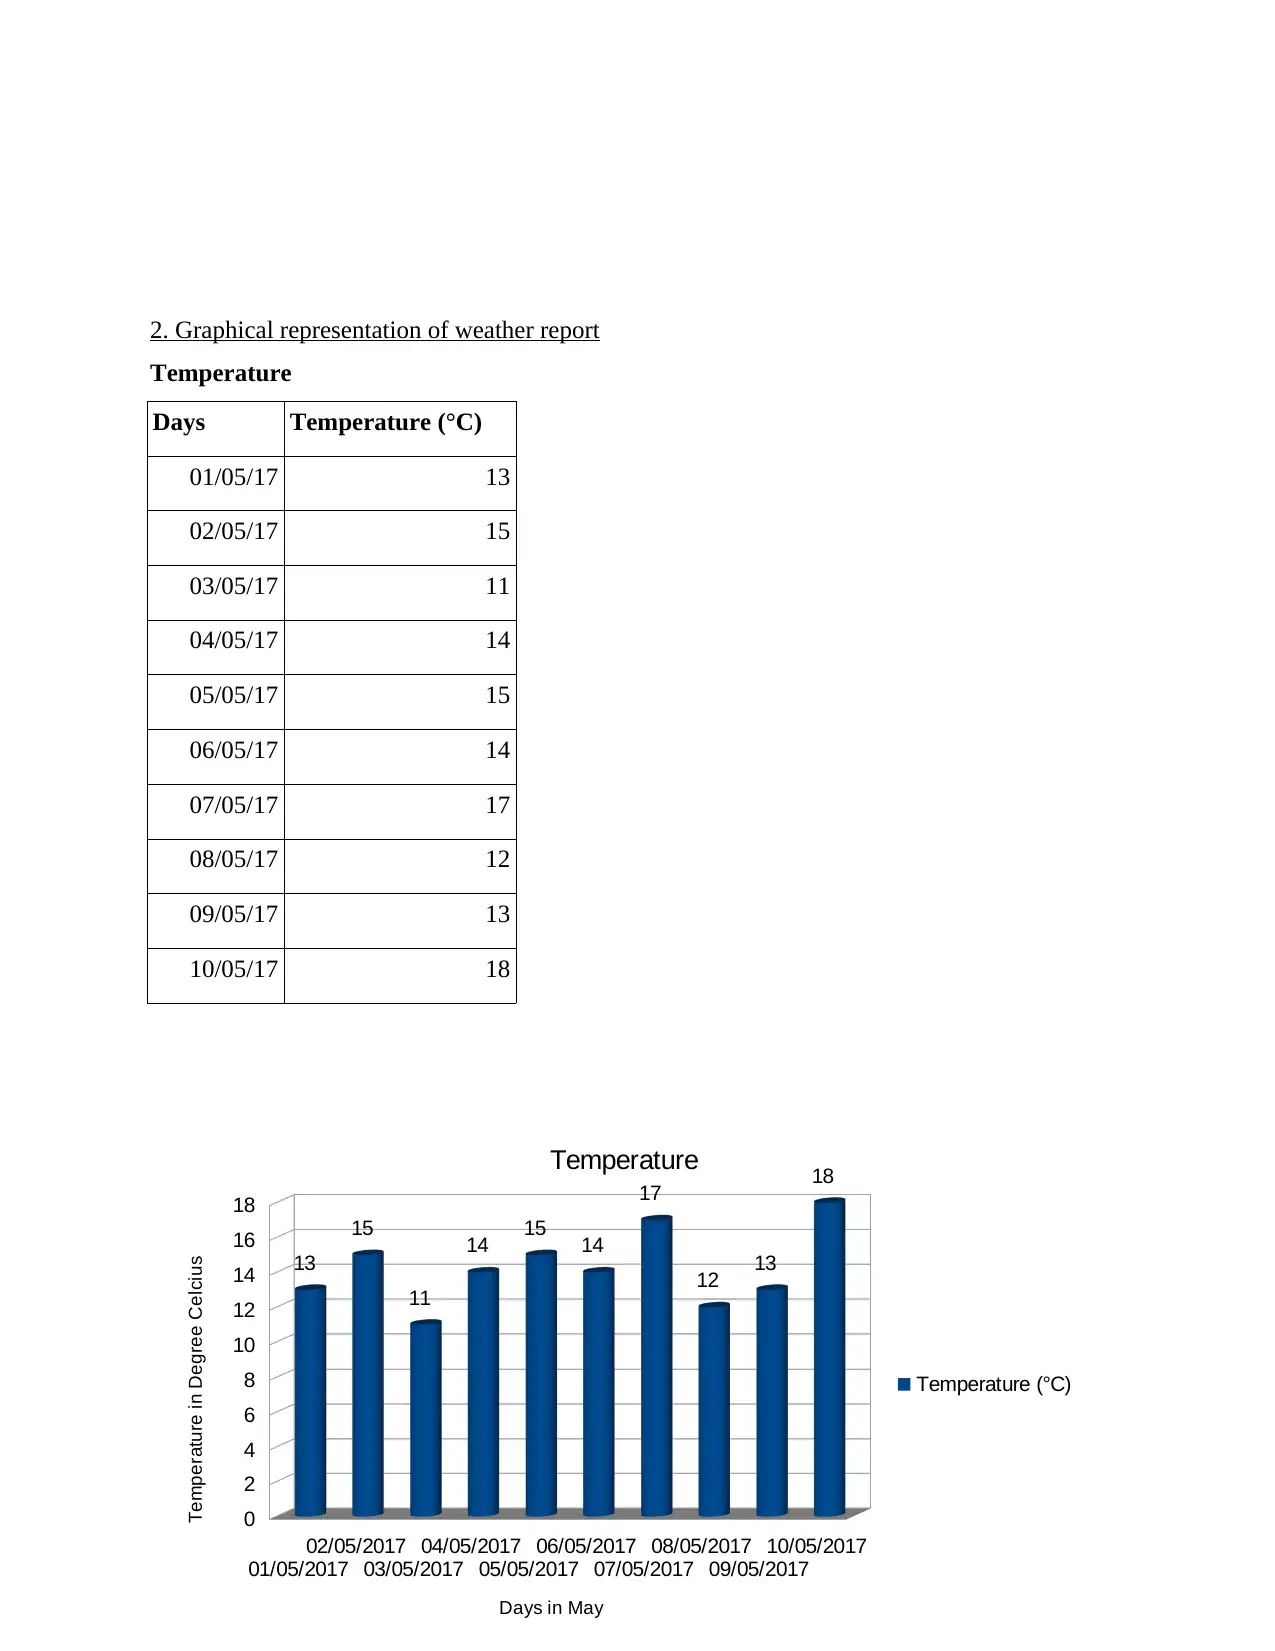
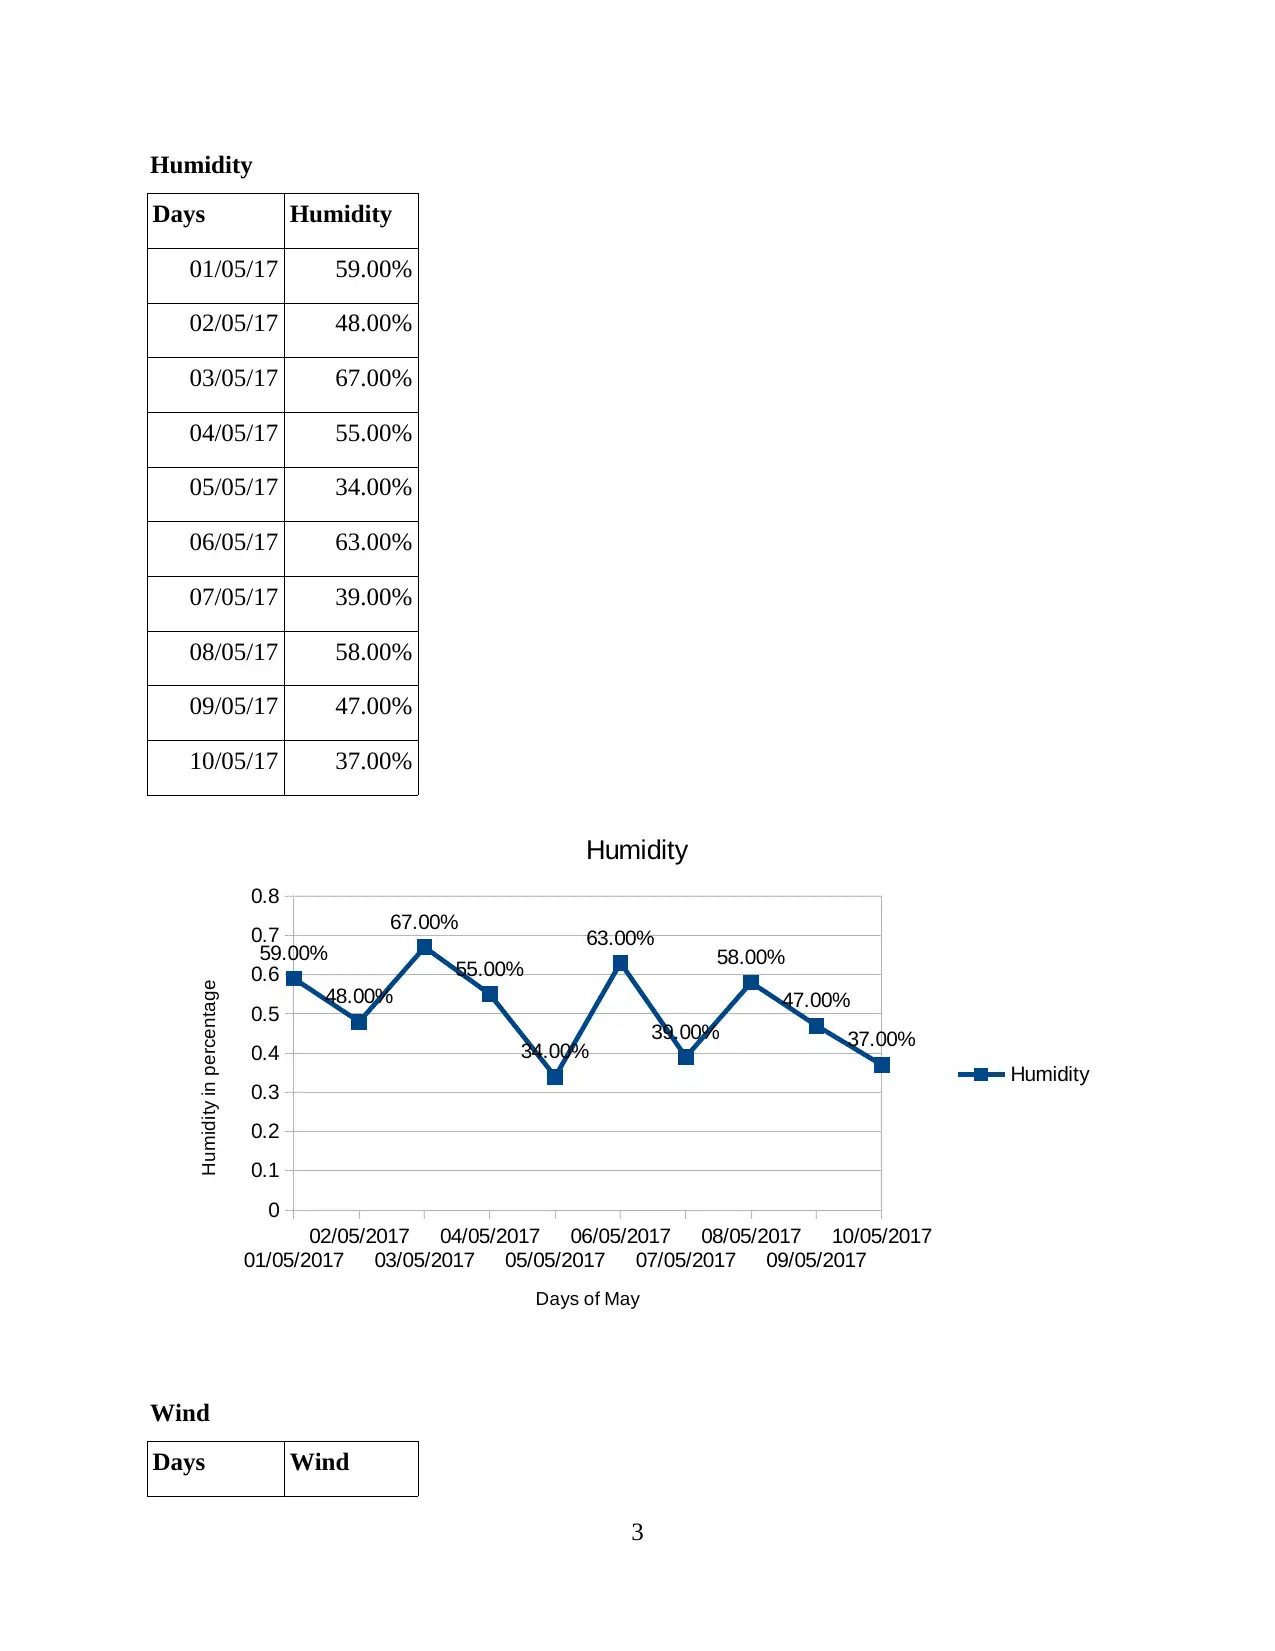
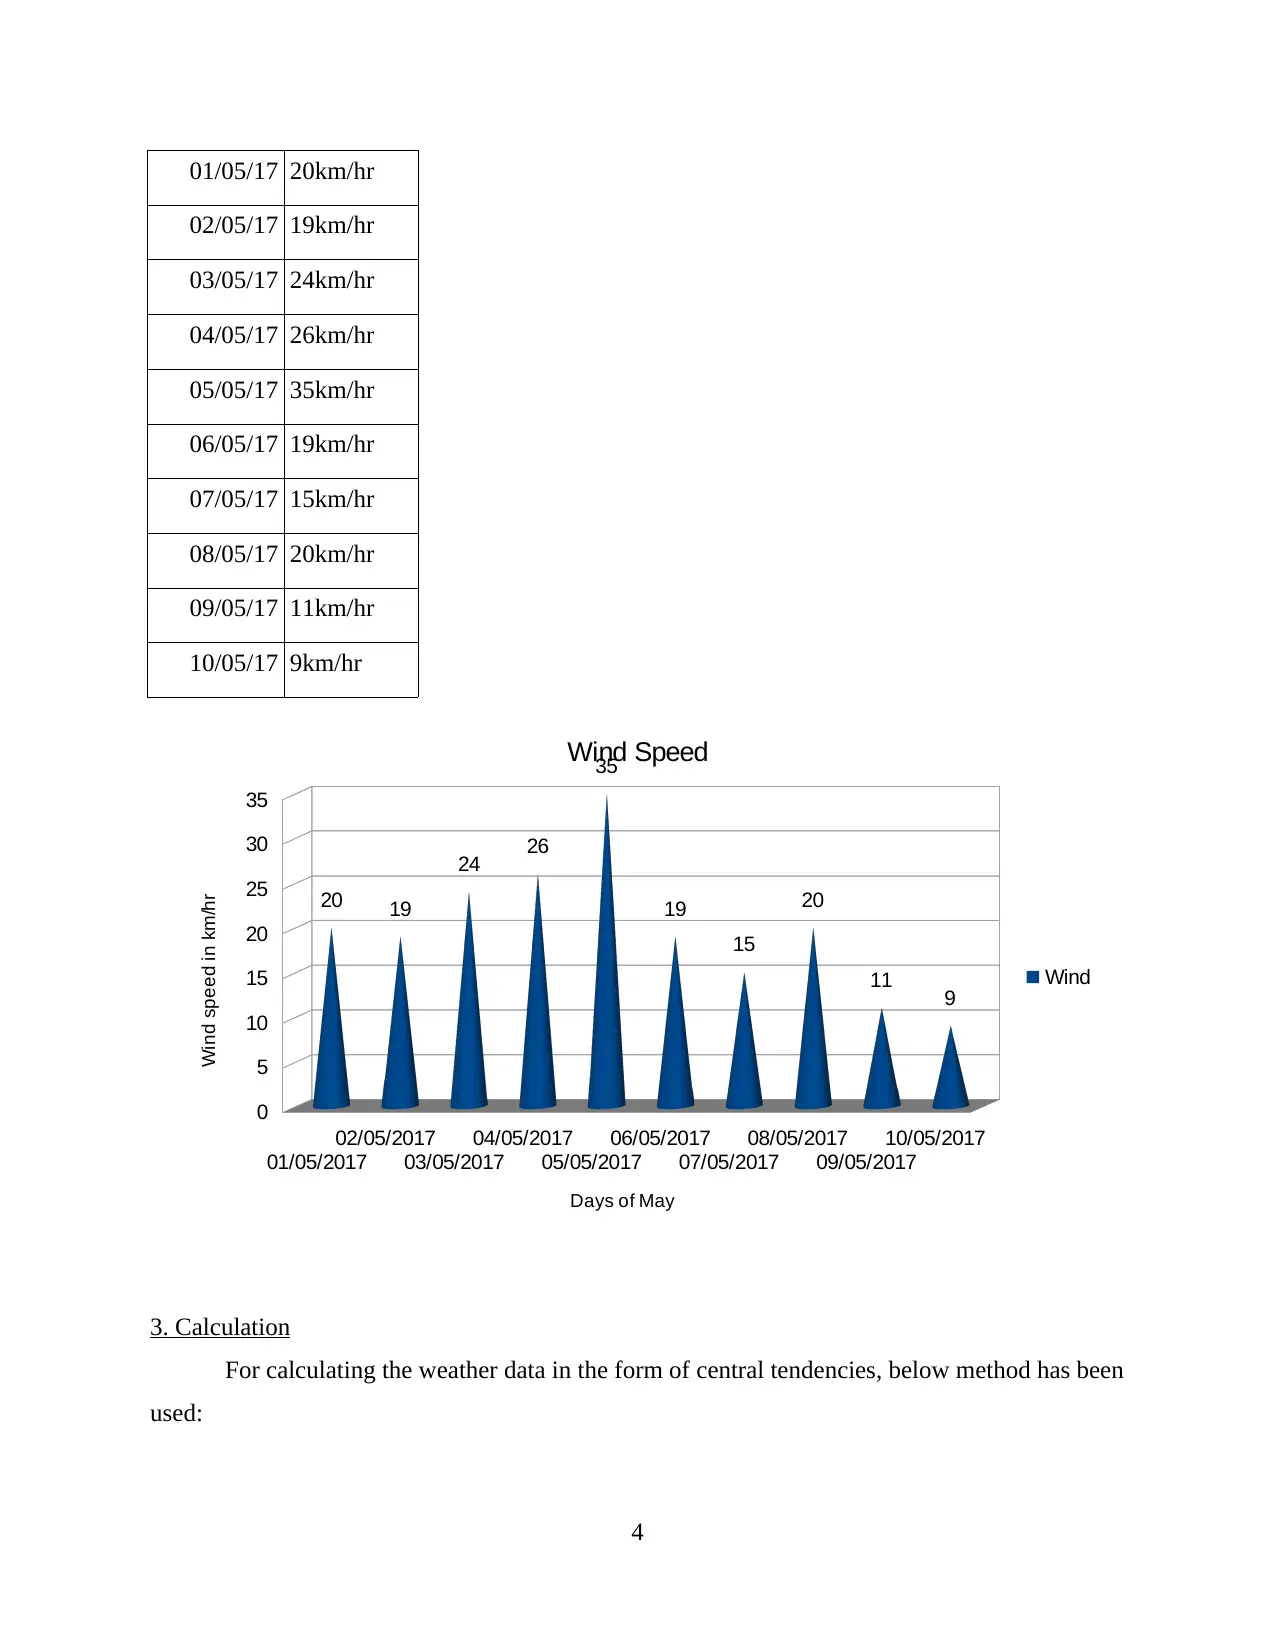
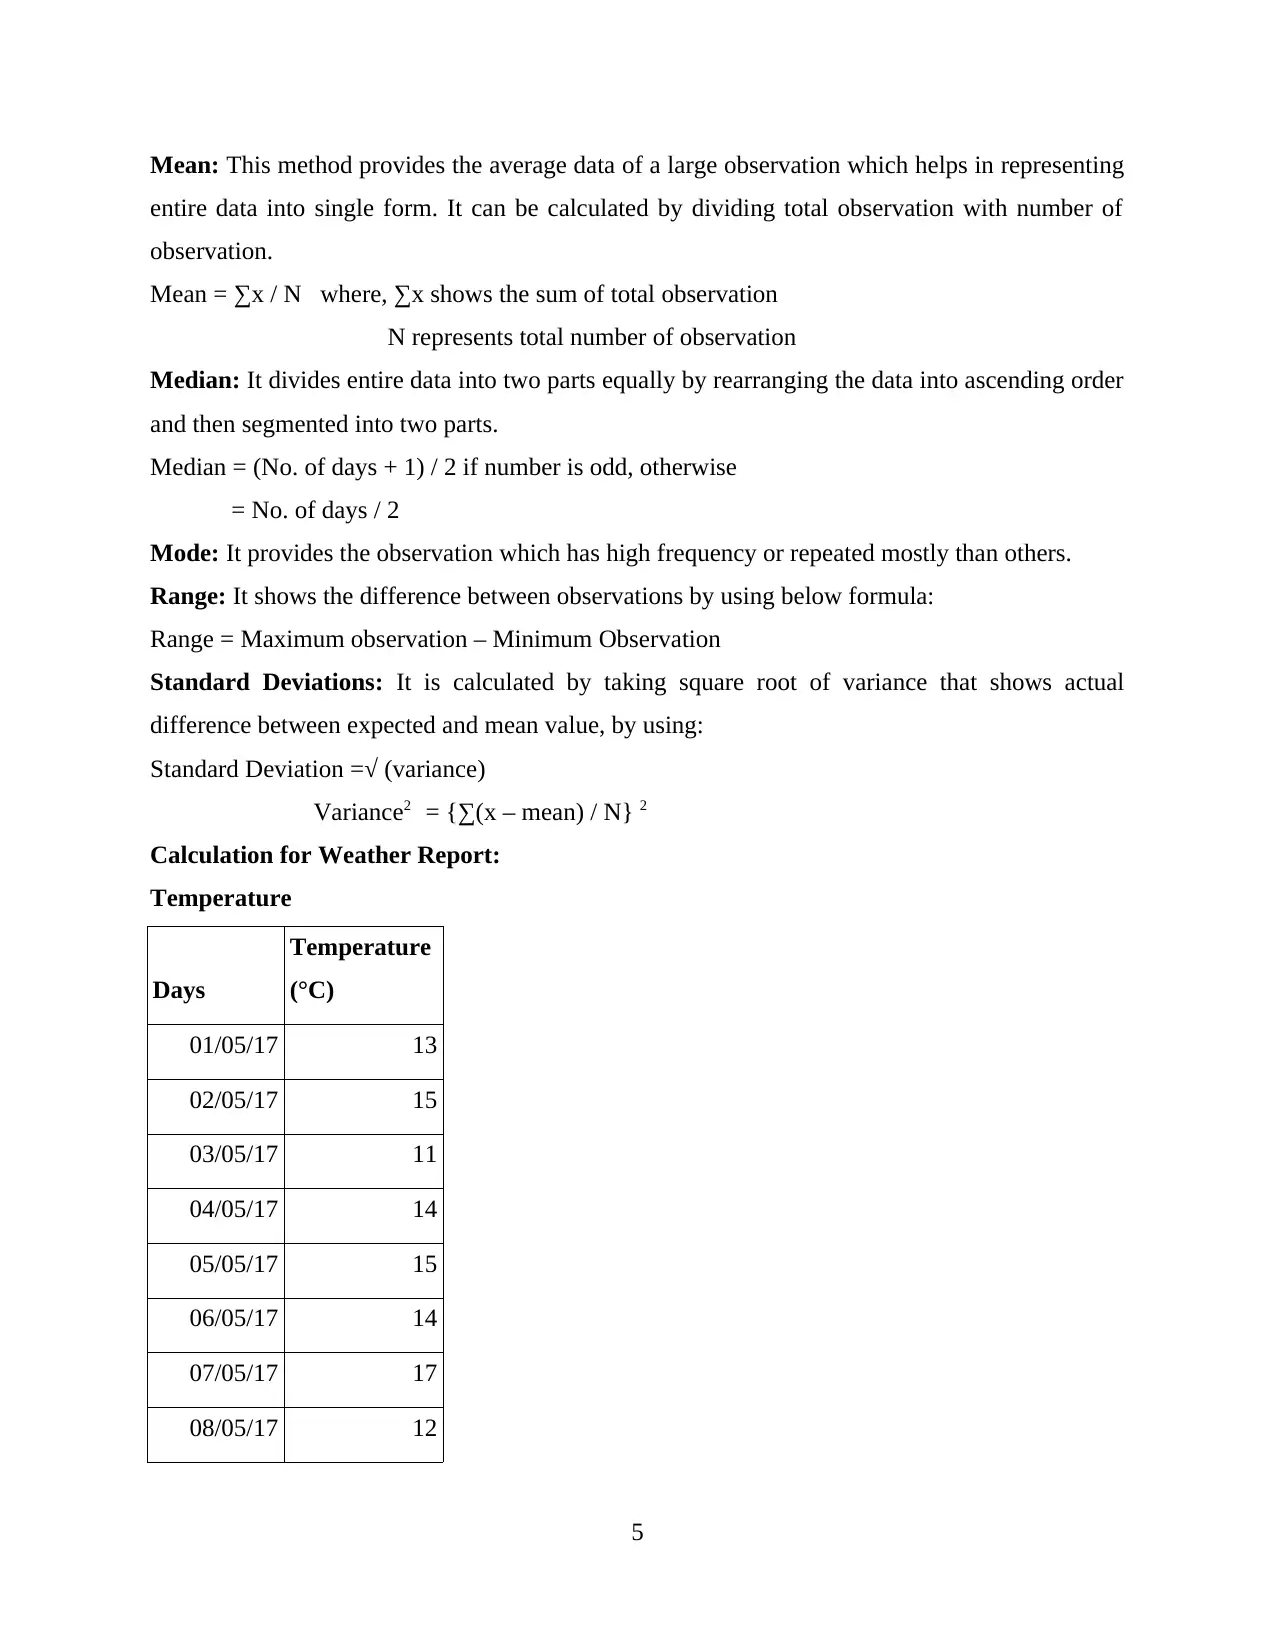
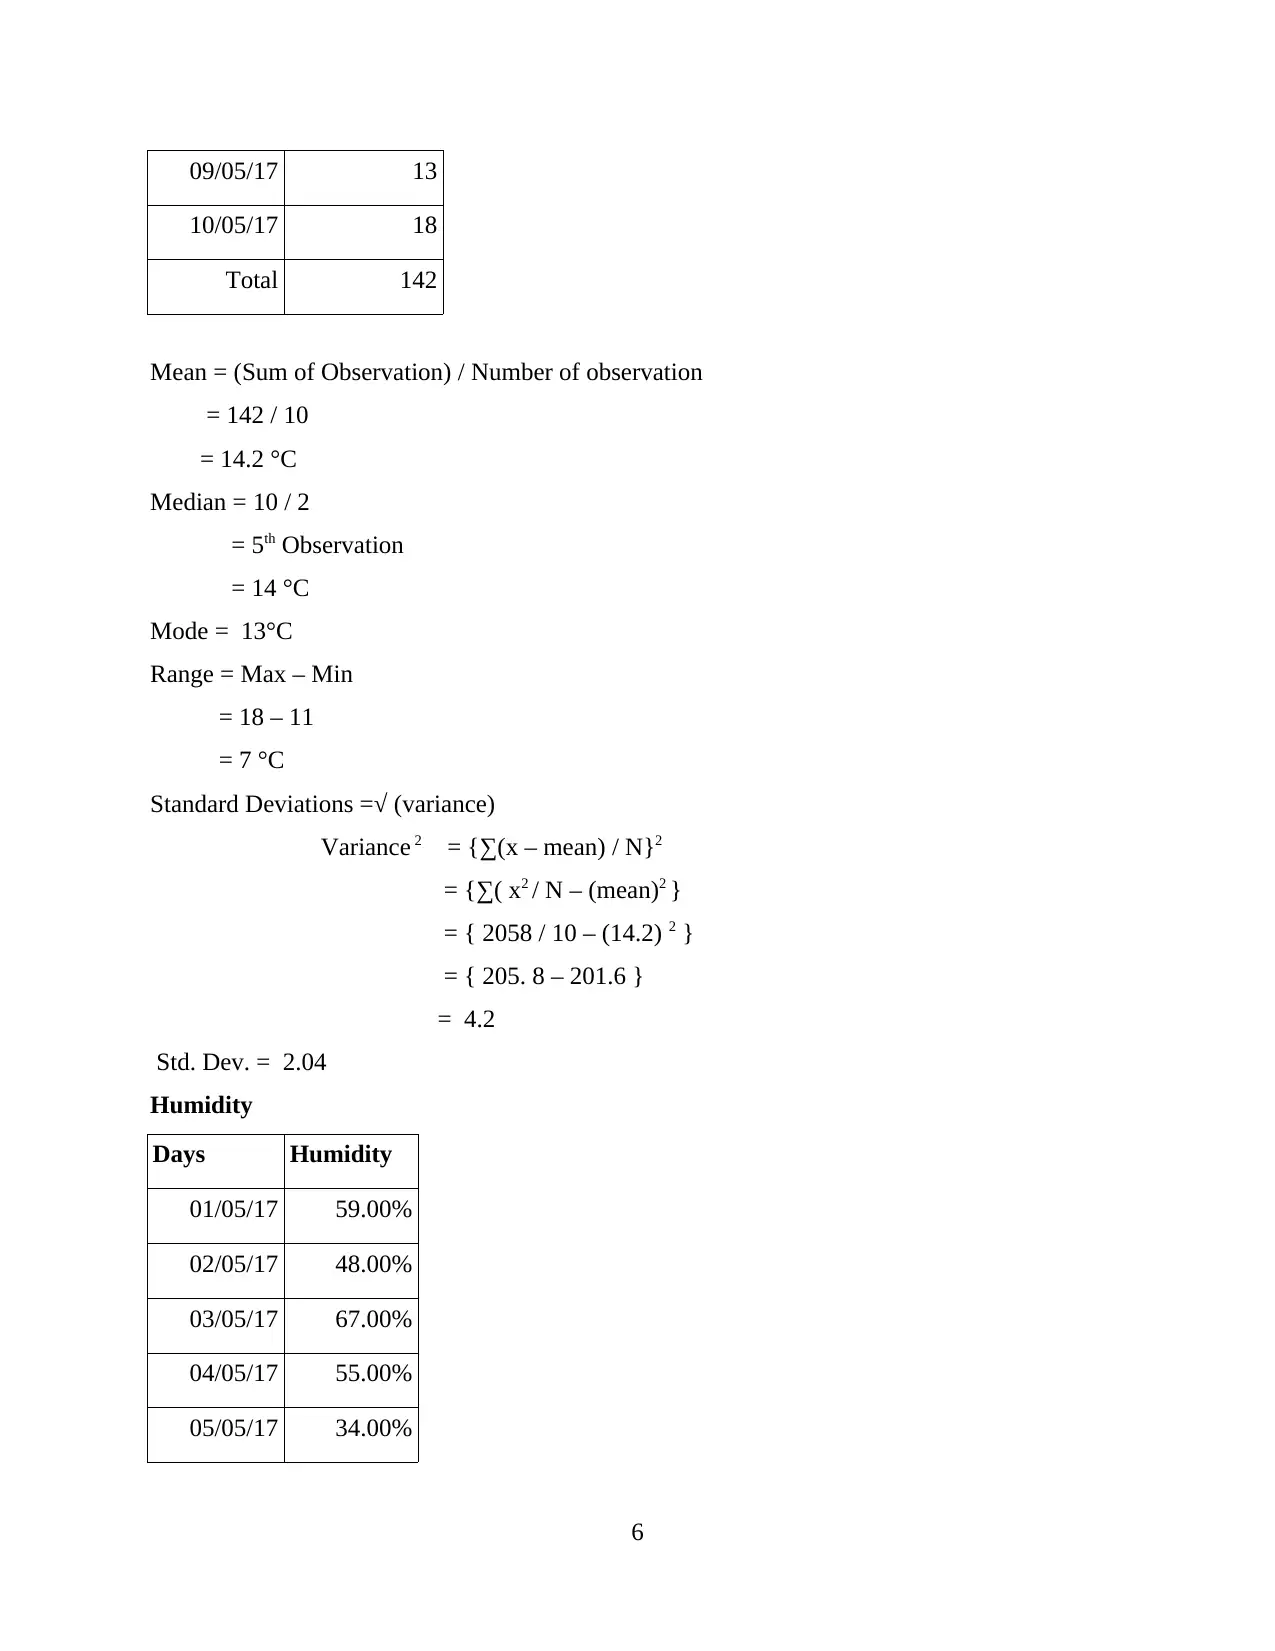
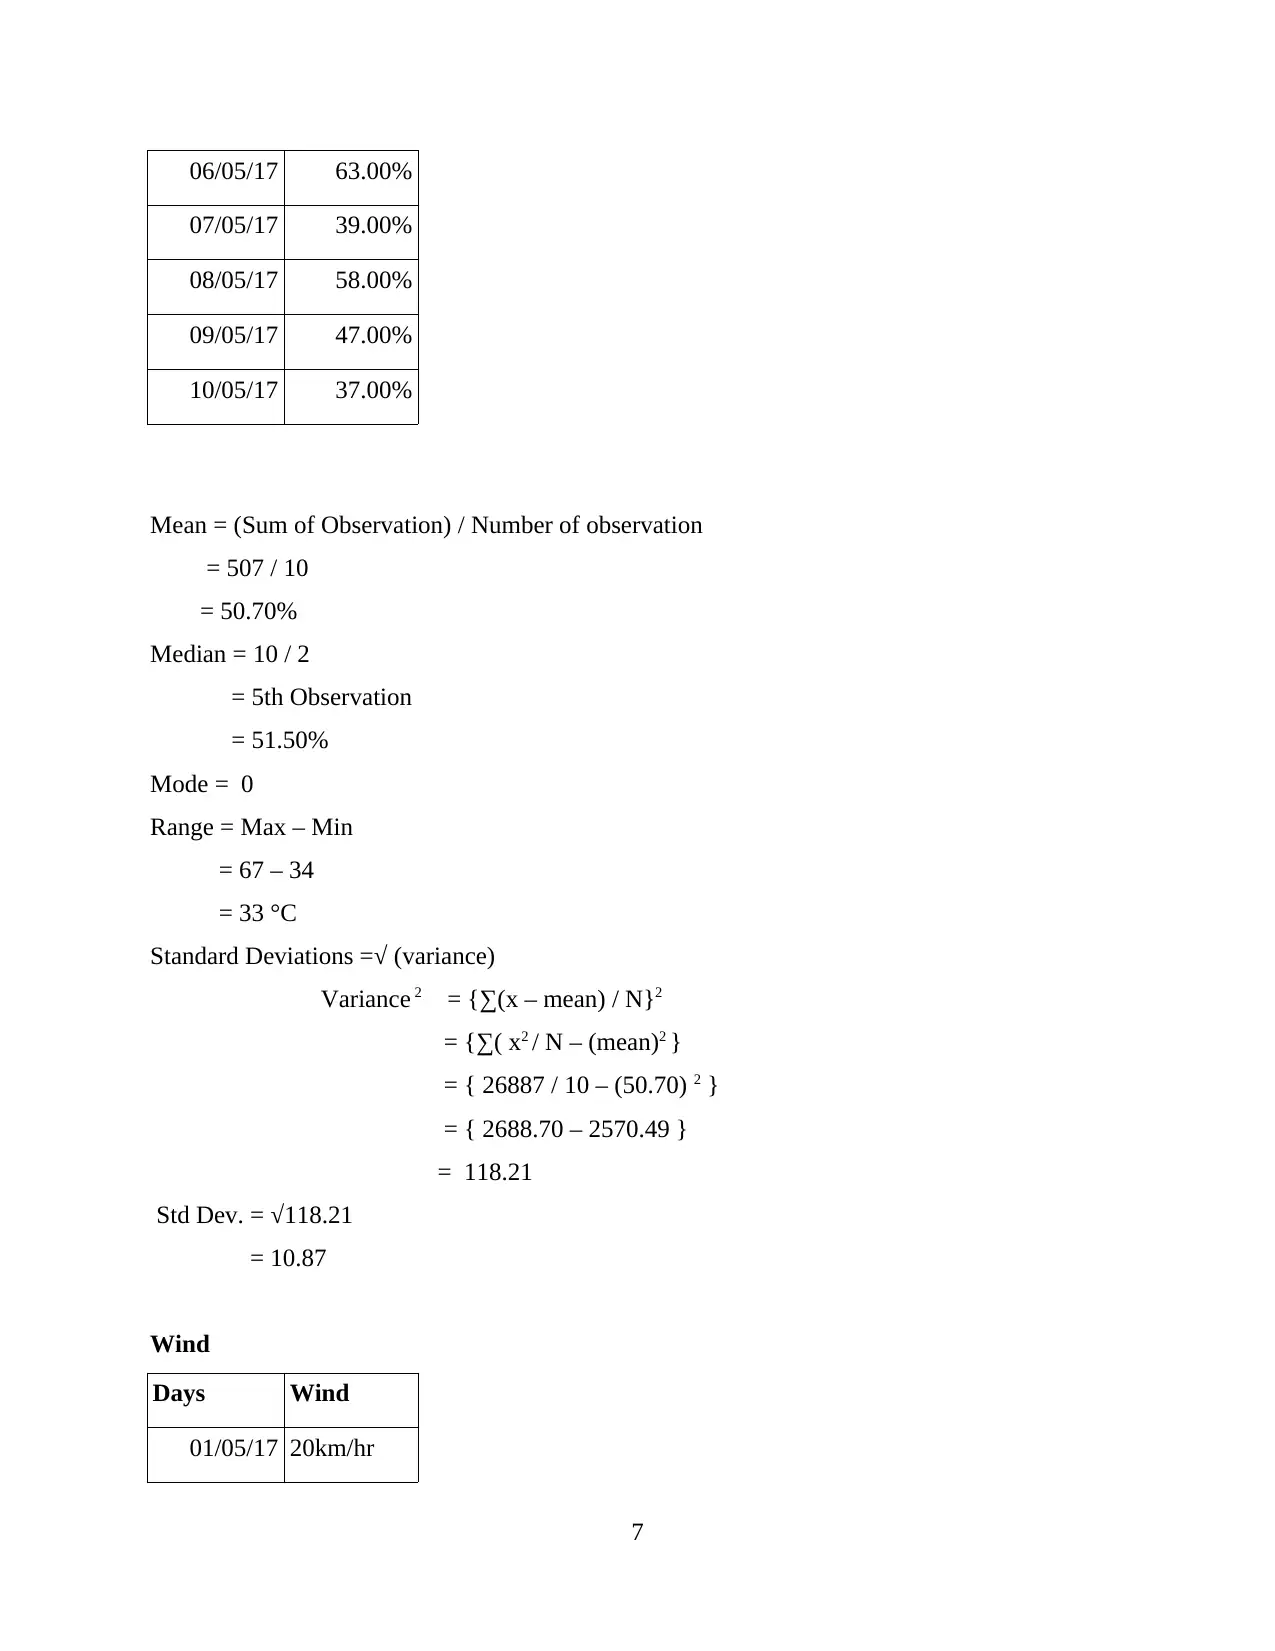
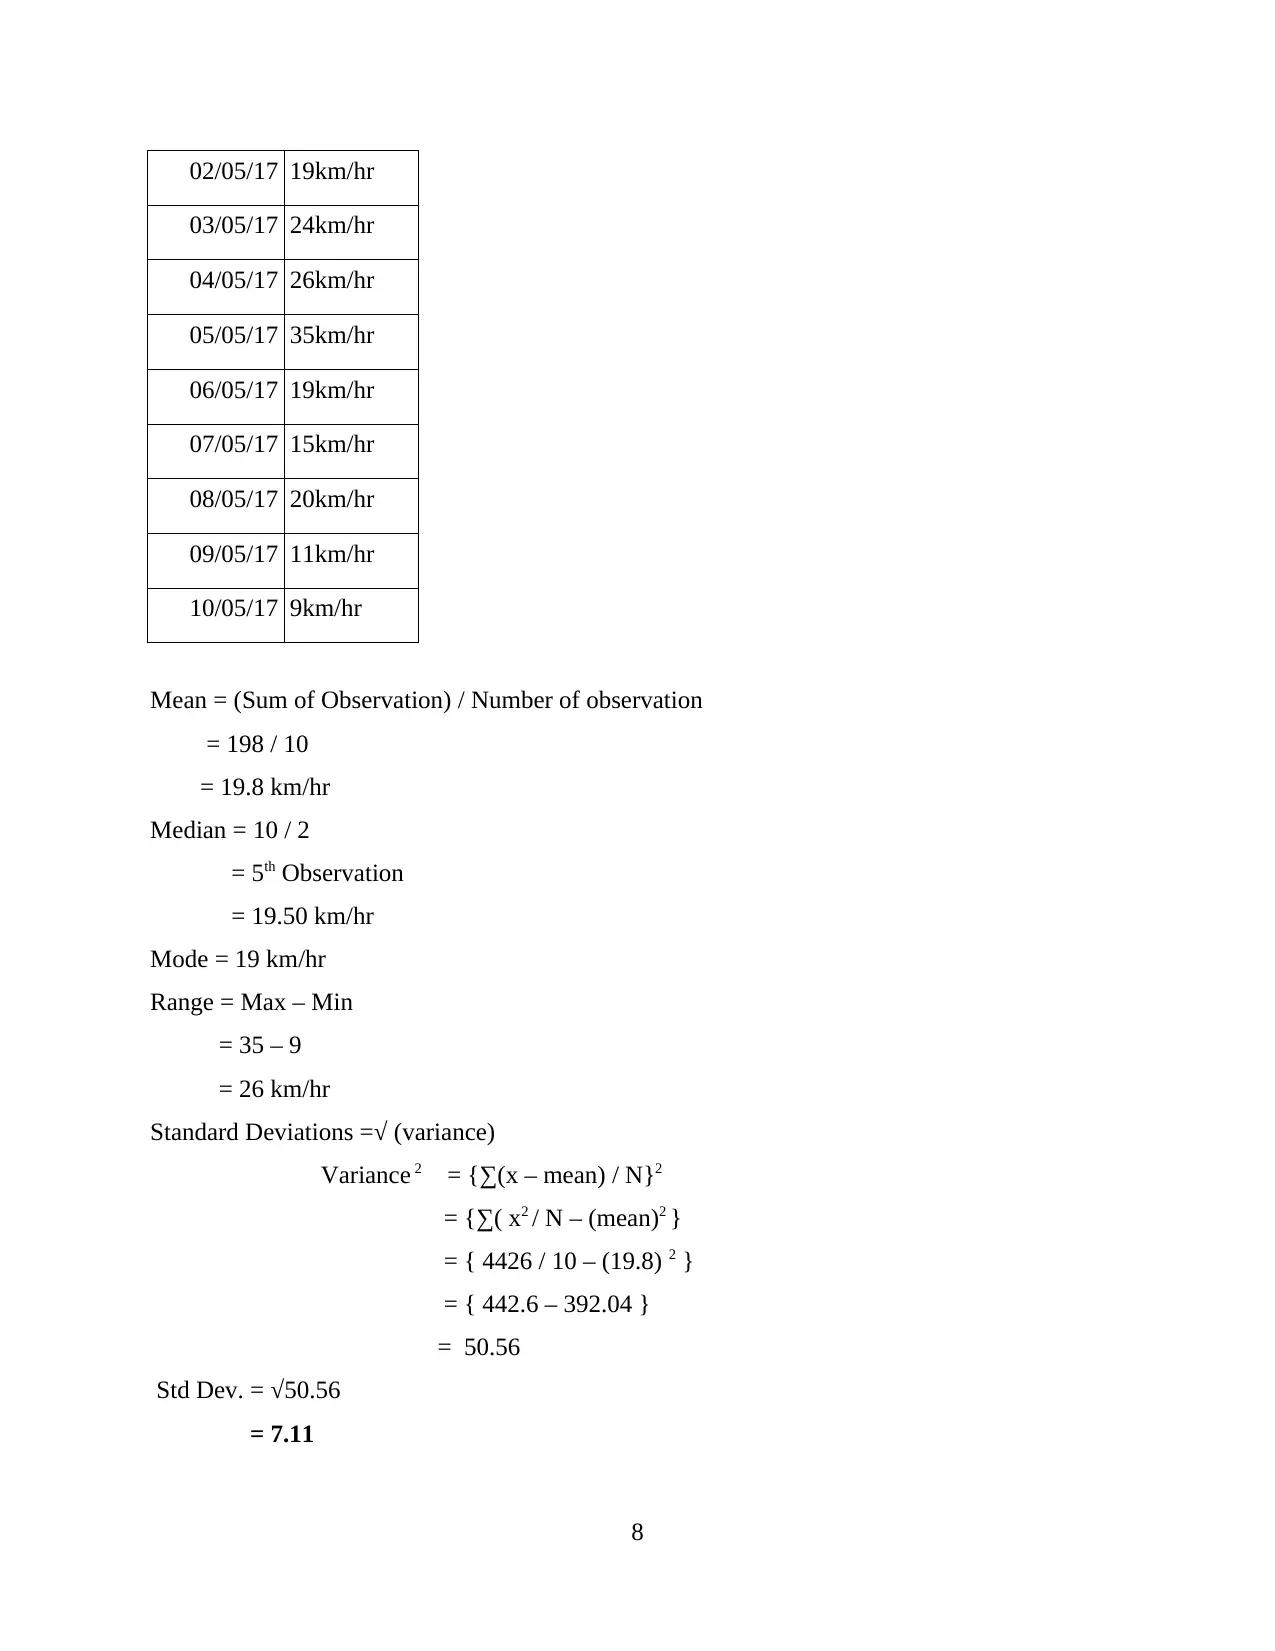
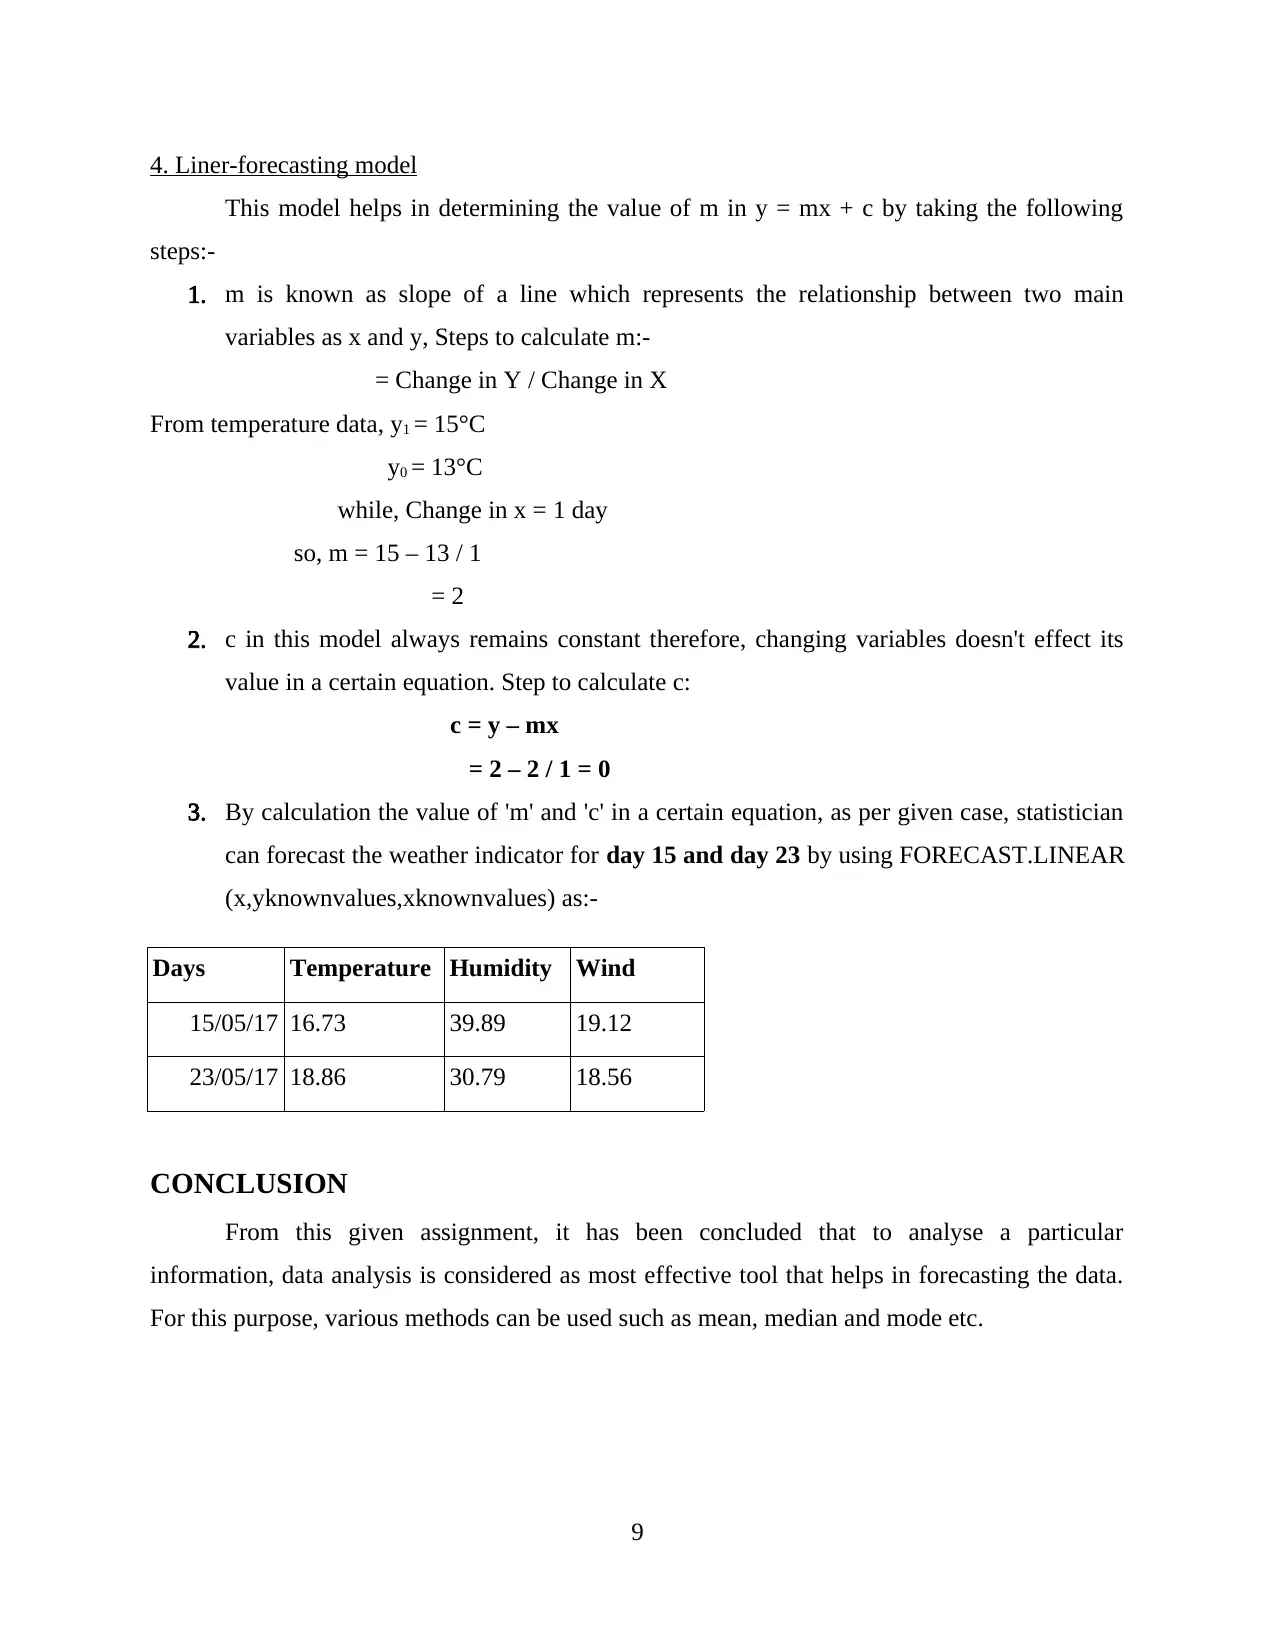
This assignment presents a comprehensive data analysis of weather reports from Welwyn Garden City. The analysis includes a table of the weather data, graphical representations of temperature, humidity, and wind speed over ten days in May 2017. The core of the assignment involves calculating various statistical measures such as mean, median, mode, range, and standard deviation for temperature, humidity, and wind speed. These calculations are performed to understand the central tendencies and variability within the weather data. Furthermore, the assignment utilizes a linear forecasting model to predict weather indicators for future dates (days 15 and 23), demonstrating the application of data analysis in predicting future weather patterns. The assignment concludes with a summary of the findings and references to supporting literature and online resources.

1 out of 12
Related Documents


Your All-in-One AI-Powered Toolkit for Academic Success.
+13062052269
info@desklib.com
Available 24*7 on WhatsApp / Email
![[object Object]](/_next/static/media/star-bottom.7253800d.svg)
Copyright © 2020–2026 A2Z Services. All Rights Reserved. Developed and managed by ZUCOL.