Foundation Skills in Data Analysis: Wesfarmers Annual Report Analysis

Verified

Added on  2023/06/08

|18
|3015
|327
Report
AI Summary
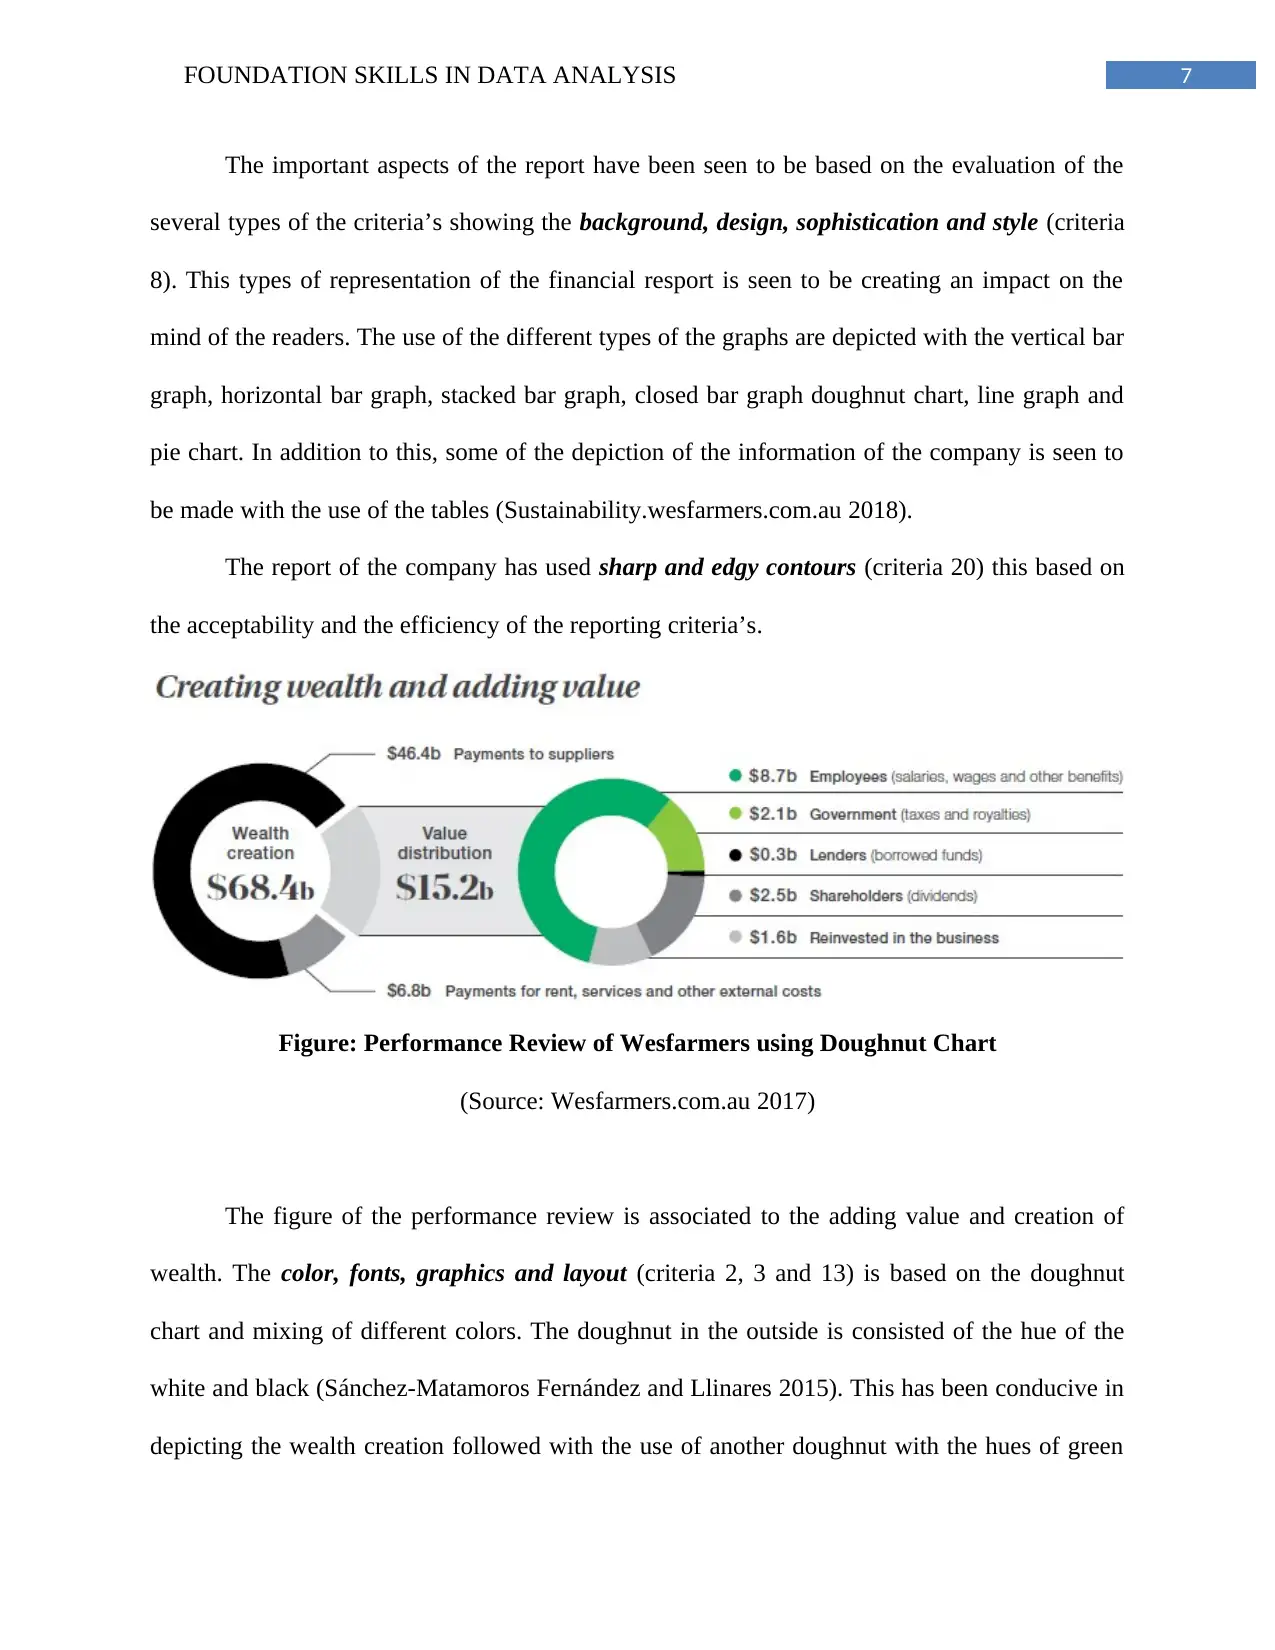
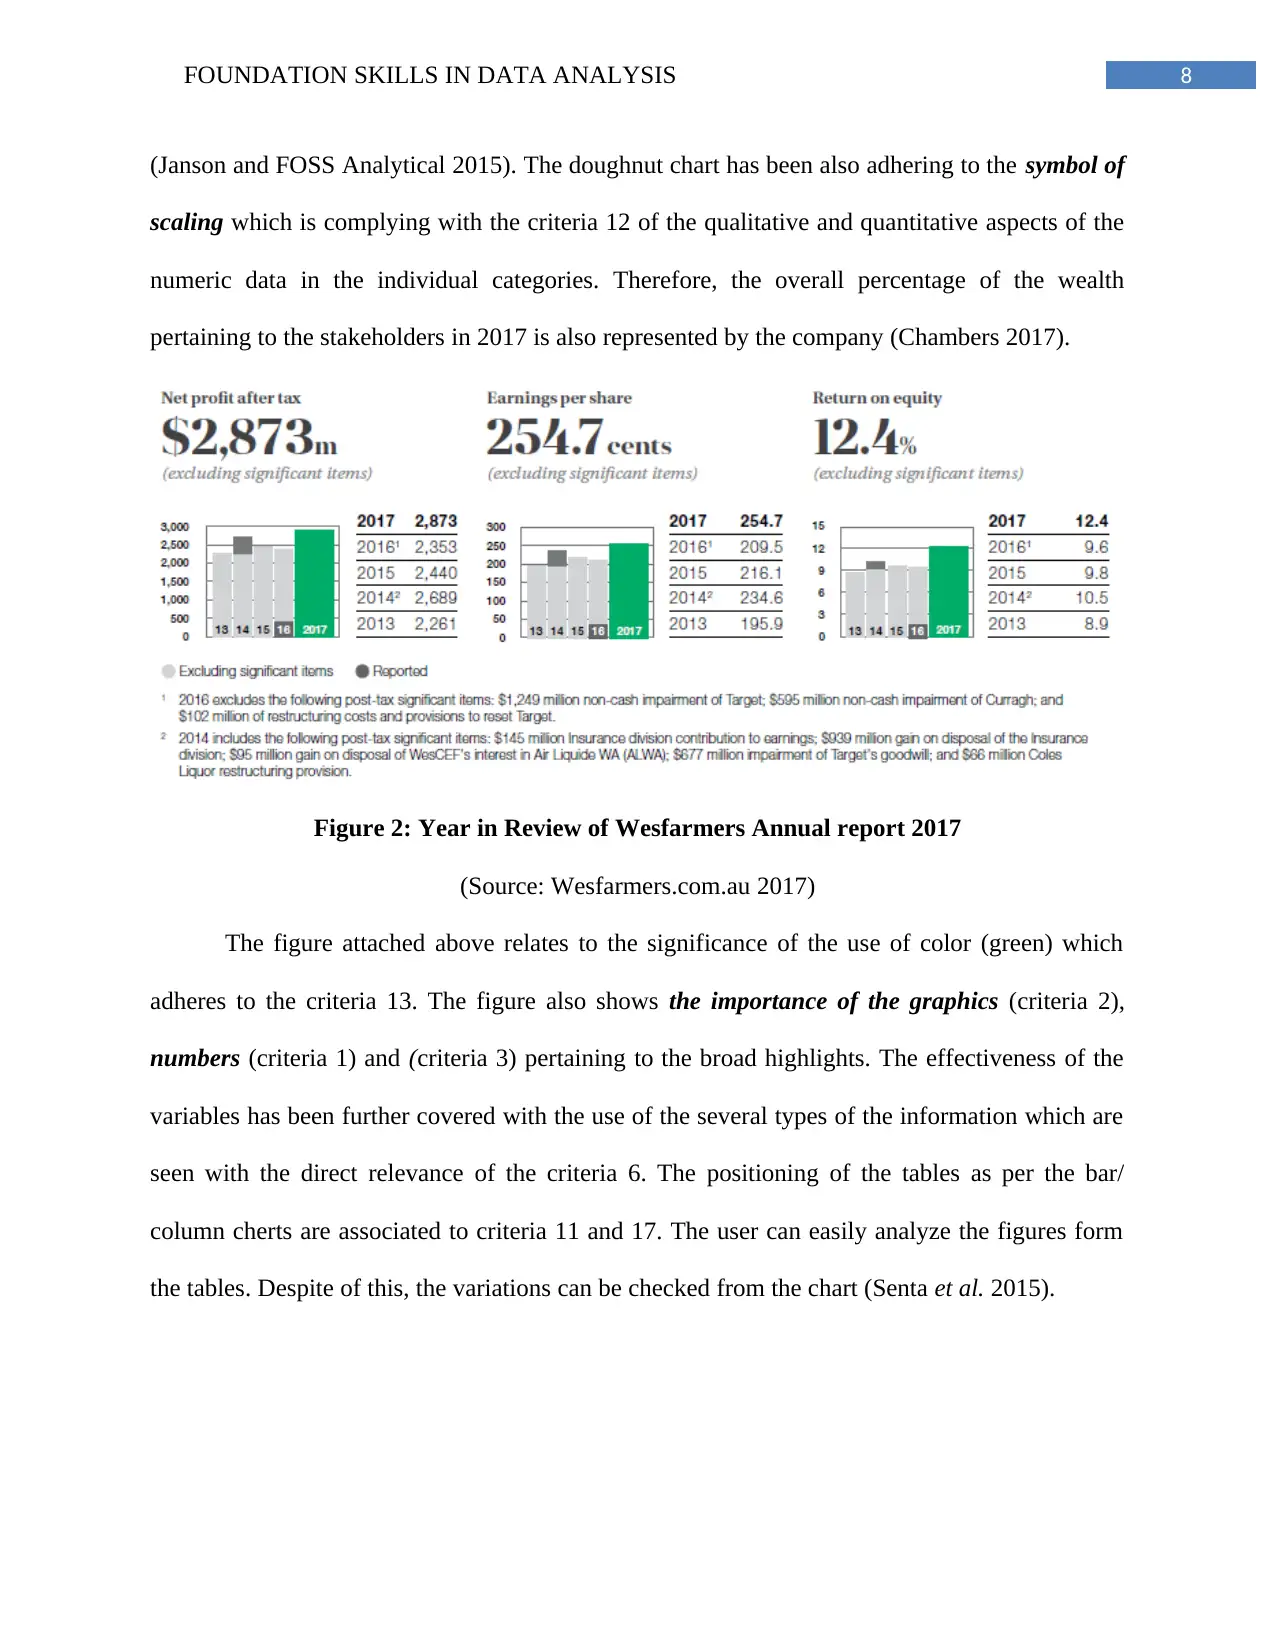
This report provides a comprehensive analysis of the visual presentation of data in Wesfarmers' 2017 annual report, focusing on the application of data analysis principles and evaluation criteria. The report begins by outlining the development of evaluation criteria for assessing the effectiveness of charts, tables, and graphs used to represent financial data, including aspects such as numbers, graphics, layout, labeling, graph references, effective use of variables, specific range information, background and design, line graphs, keys, positioning, scaling, fonts and presentation, process of encoding, customization, financial and non-financial analysis, integration of data, appropriateness of the graphical representation, information association, and geometrical determinations. The report then applies these criteria to evaluate the Wesfarmers annual report, examining the use of various visual elements such as doughnut charts, bar graphs, line graphs, and tables. It assesses how well these elements communicate financial performance, strategic precedence, and overall business operations, highlighting both strengths and weaknesses in the report's visual communication strategy. The analysis includes specific examples from the report, such as performance reviews, year-in-review summaries, and segmental data, to illustrate the application of the evaluation criteria and offer insights into the effectiveness of Wesfarmers' data visualization techniques.
Document Page
Running head: FOUNDATION SKILLS IN DATA ANALYSIS
Foundation Skills in Data Analysis
Name of the Student:
Name of the University:
Authors Note:
tabler-icon-diamond-filled.svg

Paraphrase This Document

Need a fresh take? Get an instant paraphrase of this document with our AI Paraphraser
Document Page
2FOUNDATION SKILLS IN DATA ANALYSIS
Table of Contents
Introduction:...........................................................................................................................3
Part A: Evaluation Criteria Development..............................................................................3
Part B: Evaluation of Wesfarmers Annual Report, 2017.......................................................6
Conclusion:...........................................................................................................................16
References............................................................................................................................17
Document Page
3FOUNDATION SKILLS IN DATA ANALYSIS
Introduction:
The current age technical report requires graphical representation of the information that
could lend support to the script. Nevertheless, with the rapidly growing digital world, the
presentation of reports is done in manner that lends support in understanding the difficult data
(Weissgerber et al. 2015). The presentation of the reports is generally made with the help of
charts, graphs, tables and pictures. Nonetheless, development of evaluation criteria requires
comprehensive understanding of the data. Consequently, the present report would be based on
reviewing the valid practices of creating the visual based annual report of Wesfarmers for the
financial year 2017.
Part A: Evaluation Criteria Development
To meet the needs and understanding of the readers the contents and the formats of the report
is created in a manner that it results in better understanding. Presentation of specific visualization
assists in assessing the financial conditions, strategic precedence and performance reported by
the companies (Mertler and Reinhart 2016). To demonstrate the financial situations graphical
and tabular elements are considered which comprises of graphs, charts or pictures simplifying
the data presentation. Equally, the evaluation criteria are stated below;
1. Numbers: To present the statistical data elements such as Pie Charts, line graphs and bar
charts are used.
2. Graphics: The graphical representation of the data comprises of pie charts, bar charts,
scatter charts, line graphs and histograms are some of the ways of presenting the data
(Czajka and Bowyer 2015). The purpose of graphical representation is to have vivid
Document Page
4FOUNDATION SKILLS IN DATA ANALYSIS
understanding of data. For example, a pictorial graph is helpful in communication of
different information.
3. Layout: Integrating the charts, tables, pictures, colours and other elements of the designs
forms the vital feature for demonstrating the information that is not only readable for the
users but also appealing for the readers.
4. Labelling: The criteria of labelling provides the pointers to the charts, graphs, pictures or
tables for better understanding of the audience (Rollinson 2014). This pointer includes
(chart title, x and y-axis, phases or lines of trends.
5. Graph references: It is necessary to appropriately reference the plot area of graph by
positioning the x axis and y axis, gridlines and titles for differentiating the information to
obtain accuracy.
6. Effective use of variables: The graphical representation requires variables at every axis
to assess the necessity of information which is applied in further understanding of report.
7. Specific range information: Incorporation of the data requires specific range of
information (Kosara 2016). This should include the definition of years, lower and upper
limits or cross sectional or longitudinal type of data.
8. Background and Design: The designs that is adopted must have clear format which
should be attractive and comforting their readers in holding the interest through
consistency and significance.
9. Line Graphs: The line graphs are helpful in assessing the trends at every equal interval
or for a specific time period at the time of performing comparison for numerous
categories.
tabler-icon-diamond-filled.svg

Paraphrase This Document

Need a fresh take? Get an instant paraphrase of this document with our AI Paraphraser
Document Page
5FOUNDATION SKILLS IN DATA ANALYSIS
10. Keys: The illustrations provide the information so that it can reflect the appropriate
meaning to the colours style of line or shades that is used (Bergenholtz and Theo 2015).
The illustrations should be so placed that it is in the middle of the chart for better
understanding.
11. Positioning: Use of illustrations in the report must be cross-referenced with appropriate
discussion. This requires input of graph in one side of page and text on the other side with
adequate numbering.
12. Scaling: Graphs facilitate division of data under quantitative and qualitative aspects in
practical way so that information presented does not appears disorganized (Silverman
2018). Furthermore, different set of data factors can be used for comparison.
13. Fonts and Presentation: The use of fonts and presentation forms the basic criteria in
presentation of the information. For instance, Wesfarmers provides numerous products to
its users (Chambers 2017). Therefore, it presents colour fonts with bold and presentable
data to relate with the readers of the company.
14. Process of Encoding: Prolonged financial figures and short data must be presented with
the help of numbers, responses and code for maintaining the simplicity of the graphical
representation.
15. Customization: Customization of the data must be done for the reports as this helps in
focusing on the vital data for maintaining the satisfaction.
16. Non-Financial and Financial Analysis: The analysis should be based upon the visuals
which would help in providing the readers with better understanding of the financial
report.
Document Page
6FOUNDATION SKILLS IN DATA ANALYSIS
17. Integration of Data: Integrating the data in the charts and graphs should be such that it
appeals to the audience. The integration of data provides interactive outlining of facts and
reports.
18. Appropriateness of the graphical representation: The characteristics of numbers and
complexity involved in the data must be presented differently in the report (Bergenholtz
and Theo 2015). For instances various stage of project can be illustrated through the
Gantt chart and segments of populations through the pie chart.
19. Information association: A graph or chart can have two style of chart in just one
presentation, this is because it helps in investigating the shades of data that is used. For
instance, the population age can be depicted through the bar or charts and the midpoints
range can have presented by using the frequency polygon.
20. Geometrical determinations: Studies have suggested that the observers are driven
significantly by the curving properties. This comprises of the contour framework and the
manner in which segmentation of the complex shapes is divided in the small units with
the help of visual properties namely the location, size and orientation.
Part B: Evaluation of Wesfarmers Annual Report, 2017
Wesfarmers is depicted as one of the diversified corporation which is seen to be
providing the various types of the factors for the business operations. Initiation of the various
divisions of the company is related to the supplies of the goods, office, hotels and convenience
stores. The industrial diversions are further seen with the coal, fertilizer and energy. The primary
objective of Wesfarmers is seen to be based on the several types of the tactics which are seen to
be associated to the visual analysis of the report (Morris and Springett 2014).
Document Page
7FOUNDATION SKILLS IN DATA ANALYSIS
The important aspects of the report have been seen to be based on the evaluation of the
several types of the criteria’s showing the background, design, sophistication and style (criteria
8). This types of representation of the financial resport is seen to be creating an impact on the
mind of the readers. The use of the different types of the graphs are depicted with the vertical bar
graph, horizontal bar graph, stacked bar graph, closed bar graph doughnut chart, line graph and
pie chart. In addition to this, some of the depiction of the information of the company is seen to
be made with the use of the tables (Sustainability.wesfarmers.com.au 2018).
The report of the company has used sharp and edgy contours (criteria 20) this based on
the acceptability and the efficiency of the reporting criteria’s.
Figure: Performance Review of Wesfarmers using Doughnut Chart
(Source: Wesfarmers.com.au 2017)
The figure of the performance review is associated to the adding value and creation of
wealth. The color, fonts, graphics and layout (criteria 2, 3 and 13) is based on the doughnut
chart and mixing of different colors. The doughnut in the outside is consisted of the hue of the
white and black (Sánchez-Matamoros Fernández and Llinares 2015). This has been conducive in
depicting the wealth creation followed with the use of another doughnut with the hues of green
tabler-icon-diamond-filled.svg

Paraphrase This Document

Need a fresh take? Get an instant paraphrase of this document with our AI Paraphraser
Document Page
8FOUNDATION SKILLS IN DATA ANALYSIS
(Janson and FOSS Analytical 2015). The doughnut chart has been also adhering to the symbol of
scaling which is complying with the criteria 12 of the qualitative and quantitative aspects of the
numeric data in the individual categories. Therefore, the overall percentage of the wealth
pertaining to the stakeholders in 2017 is also represented by the company (Chambers 2017).
Figure 2: Year in Review of Wesfarmers Annual report 2017
(Source: Wesfarmers.com.au 2017)
The figure attached above relates to the significance of the use of color (green) which
adheres to the criteria 13. The figure also shows the importance of the graphics (criteria 2),
numbers (criteria 1) and (criteria 3) pertaining to the broad highlights. The effectiveness of the
variables has been further covered with the use of the several types of the information which are
seen with the direct relevance of the criteria 6. The positioning of the tables as per the bar/
column cherts are associated to criteria 11 and 17. The user can easily analyze the figures form
the tables. Despite of this, the variations can be checked from the chart (Senta et al. 2015).
Document Page
9FOUNDATION SKILLS IN DATA ANALYSIS
Figure 3: Briefing Presentation Table of Goodwill and intangible of Wesfarmers in 2017
(Source: Wesfarmers.com.au 2017)
The above figure has been in conducive in depicting the numbers and the changes
(criteria 1) in terms of the goodwill and the intangibles.
Document Page
10FOUNDATION SKILLS IN DATA ANALYSIS
Figure 4: Operating and financial
(Source: Wesfarmers.com.au 2017)
The figure above shows the combination of the graphs and the numbers used in the
tables, doughnut charts, line charts and using the two ways of depiction (criteria 1 and criteria 2).
In addition to this, the labeling has been considered with the idea of the depicting the use,
however this is not labelled thereby leaving the vagueness in the mind of the users (criteria 4 not
met). The depiction of bar charts and line graphs have proper keys. This is inferred “debt
maturity profile” holding fair for the “grey color” and capital market with the “green color”. The
tabler-icon-diamond-filled.svg

Paraphrase This Document

Need a fresh take? Get an instant paraphrase of this document with our AI Paraphraser
Document Page
11FOUNDATION SKILLS IN DATA ANALYSIS
line charts have shown the market trends of the stock prices.
Figure 5: Segmental Capital Expenditure of Wesfarmers Annual report 2017
(Source: Wesfarmers.com.au 2017)
The doughnut chart in the figure is symbolic to the scaling and keys and color which is
shown with different labels (criteria 4, 10 and 12). The process of coding is applied to the
doughnut chart with the table to make the data easier for the users.
Figure 6: Changes in total revenue
(Source: Wesfarmers.com.au 2017)
The changes as per the figure 11 has highlighted the comparison of the incremental flows
of the revenues. This is seen in compliance with criteria 4,10 and 12.
Document Page
12FOUNDATION SKILLS IN DATA ANALYSIS
Figure 7: Segmental depiction of the occupational related data
(Source: Wesfarmers.com.au 2017)
The figure has been seen to be using the criteria for the colors in the stacked chart with
specific range of information for a period of one year (criteria 3 and 7). The reference pertaining
to the graphs and keys have provided the readers with the attainment of proper information. The
graphs are seen with missing x and y axis there by creating confusion in the mind of the readers
(criteria 5).
Figure 8: Aging depicted with receivables past due
(Source: Wesfarmers.com.au 2017)
The half doughnut is seen to be following the criteria of customization (criteria 15), as
the focus has been given to the data under three months, six months and over six months. This is
chevron_up_icon
1 out of 18
circle_padding
hide_on_mobile
zoom_out_icon
[object Object]