Comprehensive Data Analysis Report: Birmingham Wind Speed Forecasting

Verified

Added on  2021/02/19

|10
|1898
|791
Report
AI Summary
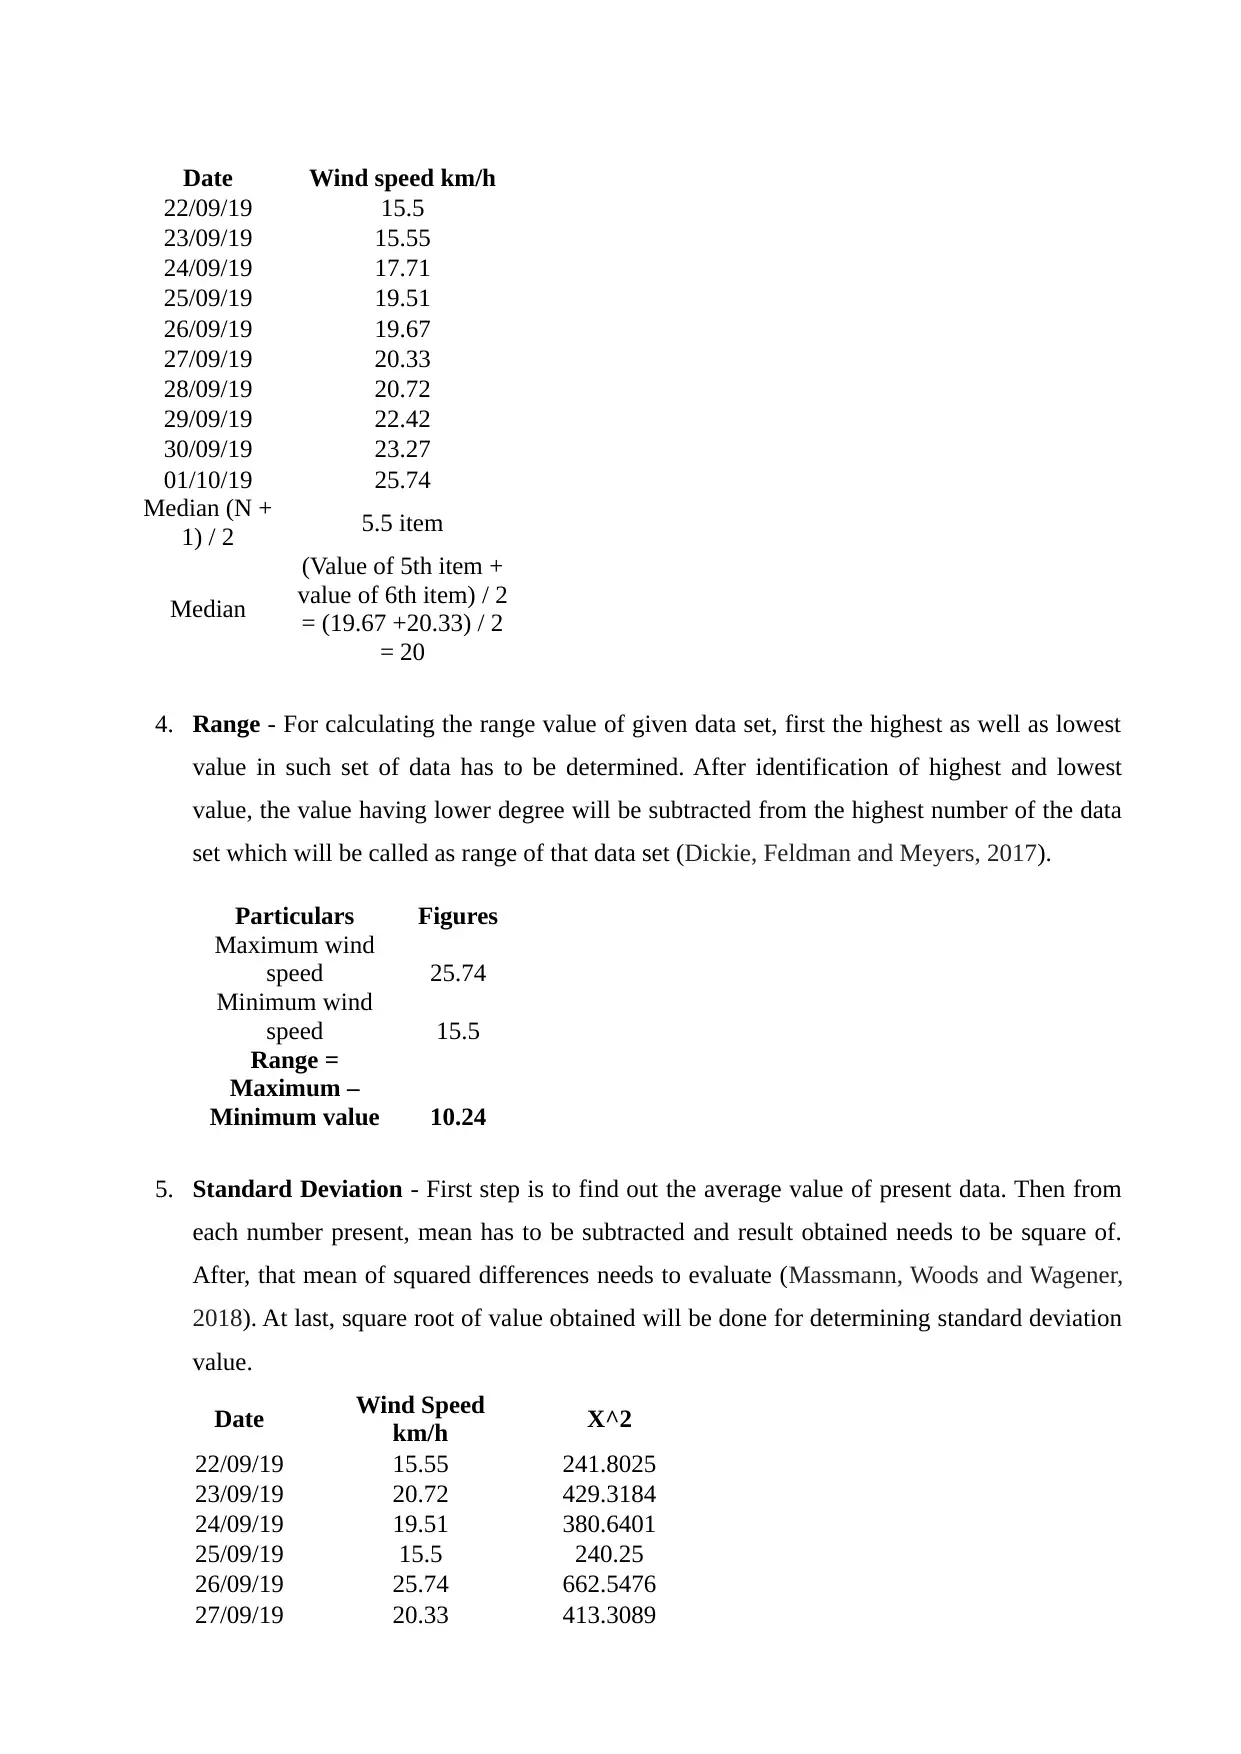
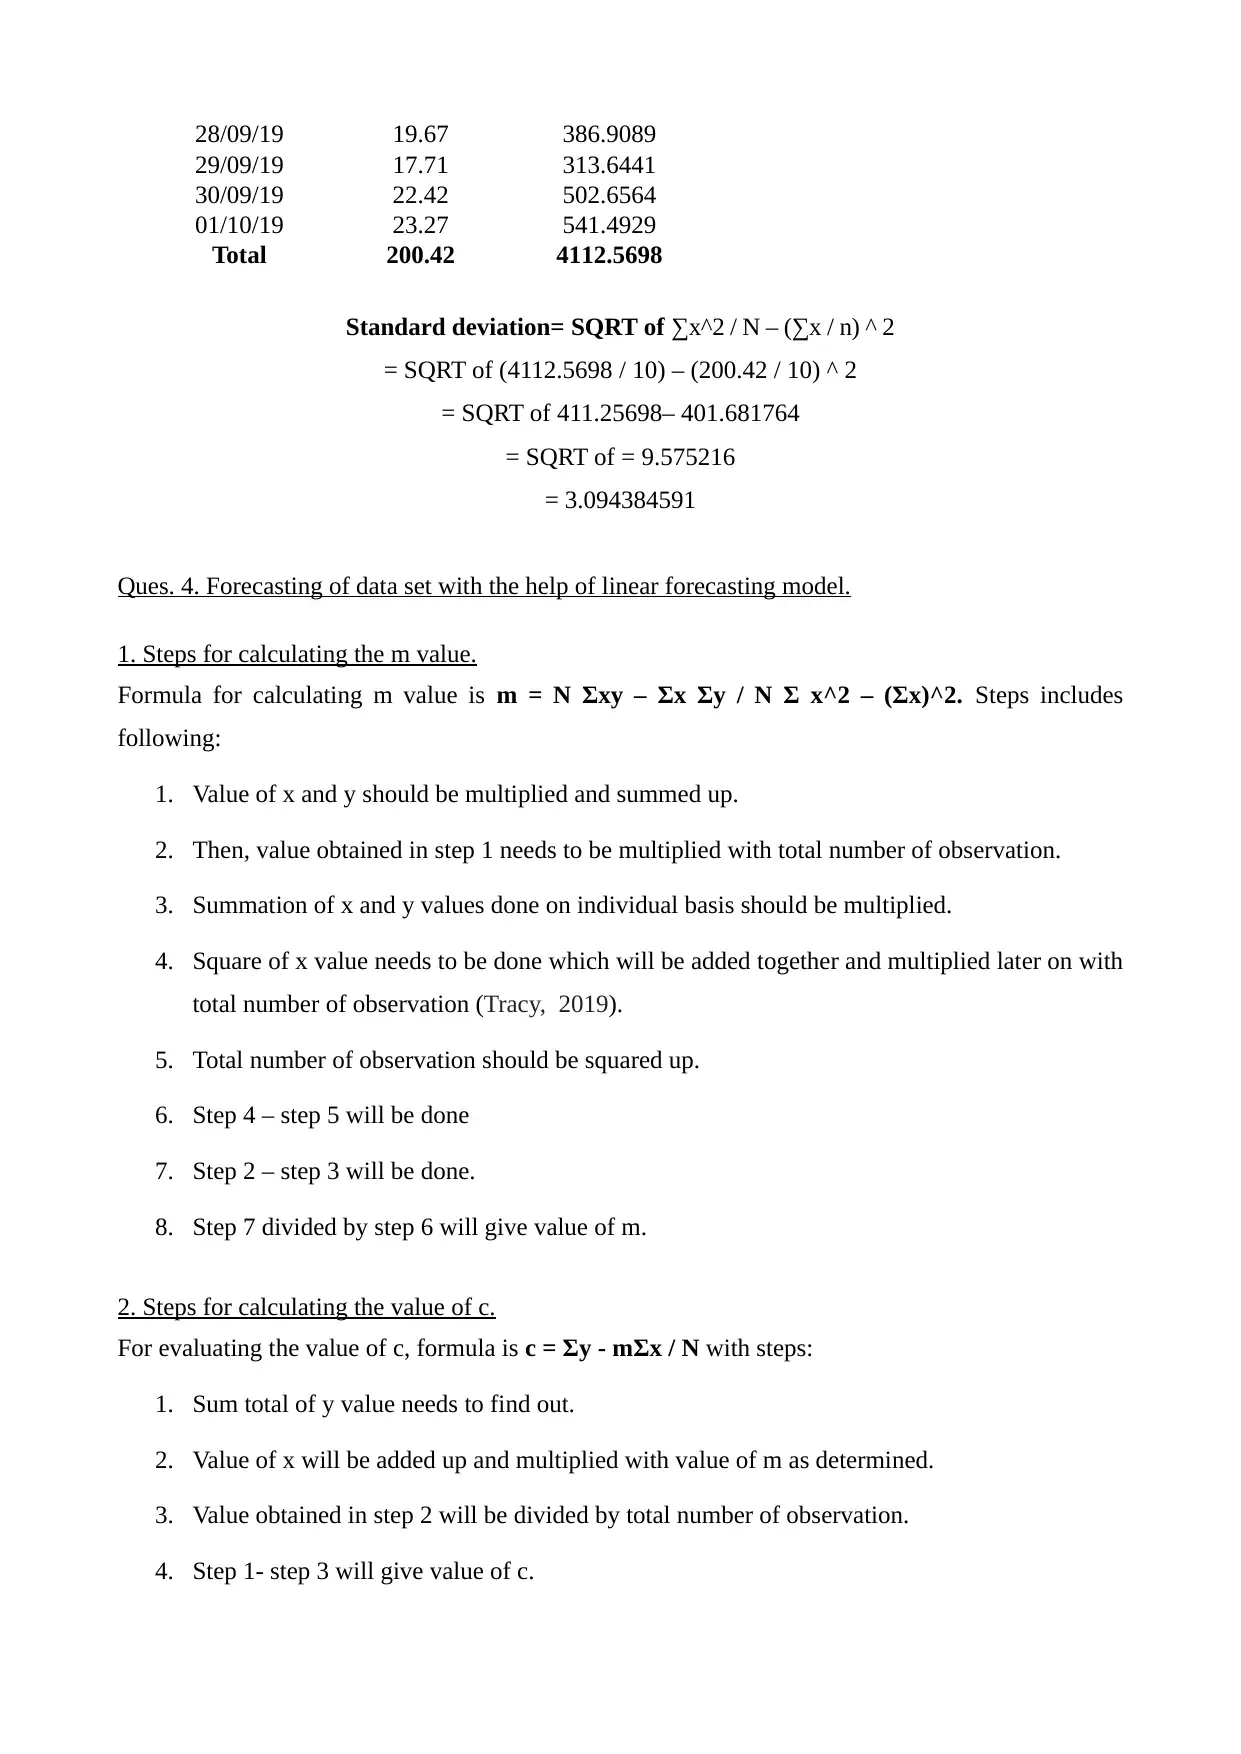
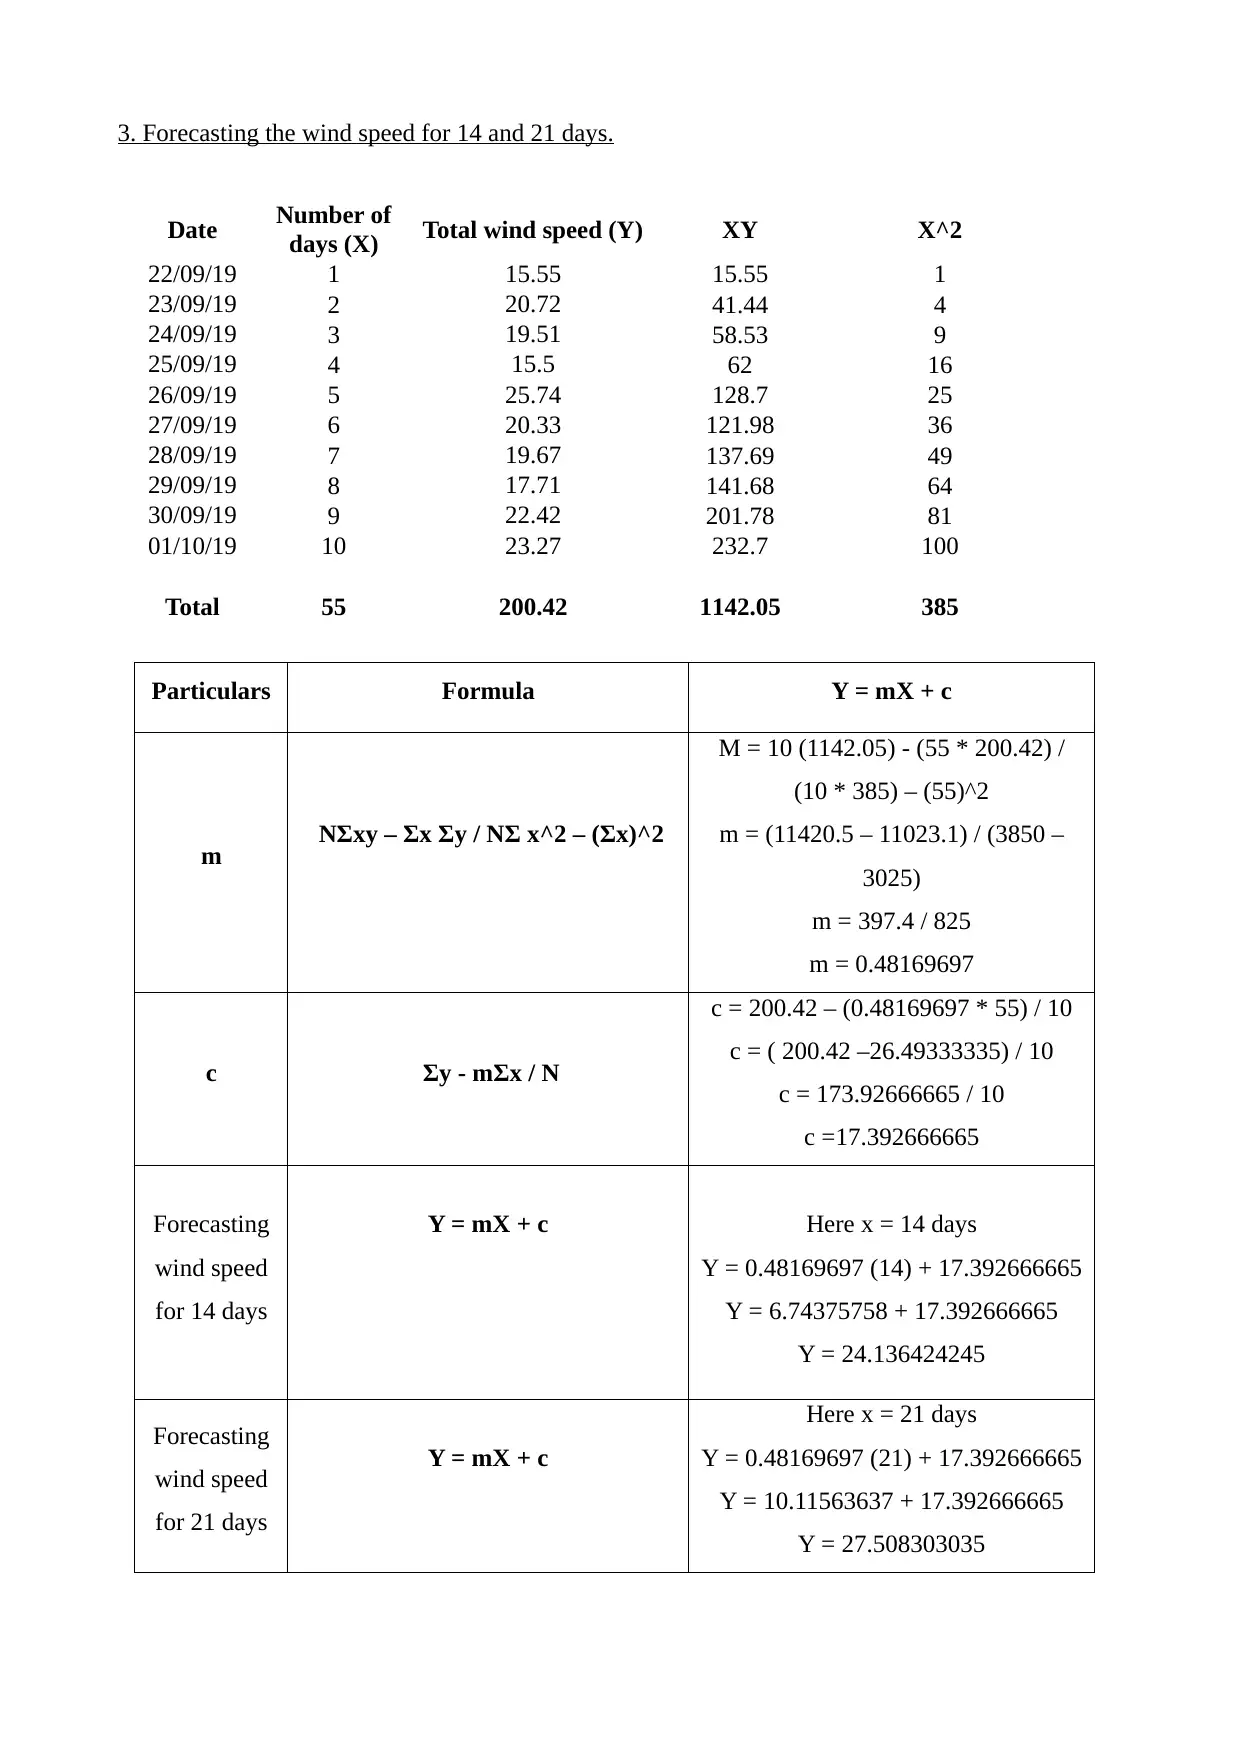
This report provides a comprehensive analysis of wind speed data in Birmingham, covering a ten-day period. It begins with data arrangement in a table format and presents the data using bar and line charts to visualize trends. The report then delves into statistical calculations, including mean, mode, median, range, and standard deviation, with detailed steps for each calculation. A linear forecasting model is then applied to predict wind speed for the 14th and 21st days, with the steps for calculating the 'm' and 'c' values explained. The report concludes by summarizing the fluctuating wind speed trend and provides the forecasted wind speeds for the specified future dates. References to the sources are included in the end.
Document Page
Numeracy and data analysis
tabler-icon-diamond-filled.svg

Paraphrase This Document

Need a fresh take? Get an instant paraphrase of this document with our AI Paraphraser
Document Page
Table of Contents
INTRODUCTION ...............................................................................................................................3
MAIN BODY .......................................................................................................................................3
Ques. 1. Arrangement of data in table form.....................................................................................3
Ques. 2. Presentation of given data set with the help of bar chart and line chart............................3
Ques. 3. Calculation.........................................................................................................................4
Ques. 4. Forecasting of data set with the help of linear forecasting model.....................................7
1. Steps for calculating the m value.................................................................................................7
2. Steps for calculating the value of c..............................................................................................7
3. Forecasting the wind speed for 14 and 21 days...........................................................................7
CONCLUSION ....................................................................................................................................9
REFERENCES...................................................................................................................................10
Document Page
INTRODUCTION
Data analysis is one of the most important process for every business organisation as it helps in
deriving meaningful information from it. By analysis data in proper form with the help of different
types of statistical as well as mathematical methods, it assists in decision making process of many
business firms. The present report is based on Birmingham city, which will analysis data about the
wind speed of past ten consecutive days. Furthermore, it will define about steps of different types of
statistical measures such as mean, range, median etc. At last, it will shed light on methods of
determining the m and c value along with use of linear forecasting model for determining wind
speed for 14 and 21 days of Birmingham city.
MAIN BODY
Ques. 1. Arrangement of data in table form.
Days Date Wind speed km/h
1 22/09/19 15.55
2 23/09/19 20.72
3 24/09/19 19.51
4 25/09/19 15.5
5 26/09/19 25.74
6 27/09/19 20.33
7 28/09/19 19.67
8 29/09/19 17.71
9 30/09/19 22.42
10 01/10/19 23.27
Ques. 2. Presentation of given data set with the help of bar chart and line chart.
1. Bar chart
Document Page
2. Line chart -
Interpretation – From the above graph it can be interpreted that in the city of Birmingham,
the wind speed in the past ten consecutive days has shown fluctuating trend. The highest speed of
wind was observed on 26 September 2019 i.e. 25.74 km/h. Whereas, the city has witnesses the
minimum speed on wind on 22 September 2019 i.e. 15.5 km/h.
22/09/2019
23/09/2019
24/09/2019
25/09/2019
26/09/2019
27/09/2019
28/09/2019
29/09/2019
30/09/2019
01/10/2019
0 5 10 15 20 25 30
Wind speed Km/Hr
22/09/2019
23/09/2019
24/09/2019
25/09/2019
26/09/2019
27/09/2019
28/09/2019
29/09/2019
30/09/2019
01/10/2019
0
5
10
15
20
25
30
Wind speed Km/Hr
tabler-icon-diamond-filled.svg

Paraphrase This Document

Need a fresh take? Get an instant paraphrase of this document with our AI Paraphraser
Document Page
Ques. 3. Calculation
Particulars Figure
Mean 20.042
Mode #VALUE!
Median 20
Standard
deviation 3.2617677552
Minimum 15.5
Maximum 25.74
Range 10.24
Steps for calculating:
1. Mean - Collect all the data values of both the small and big numbers which average has to
be determined. Add up all together so that a total can be find. After summing up, the next
step is to count the number of values as falling in the data set. Now, divide the added value
by total number of count determined so as to ascertain the mean value.
Date Wind speed km/h
22/09/19 15.55
23/09/19 20.72
24/09/19 19.51
25/09/19 15.5
26/09/19 25.74
27/09/19 20.33
28/09/19 19.67
29/09/19 17.71
30/09/19 22.42
01/10/19 23.27
N = 10
Total (∑X) 200.42
Mean 20.042
2. Mode - In order to evaluating modal value, all the numbers present in the data set needs to
be sort down in order. After, sorting of number is done the next step is related with counting
of each number present therein. The number which is repeating most is mode.
Particulars Wind speed (in
km/h)
Mode #NA
3. Median - Arrange all the numbers from least to the greatest value. In case if items in the
data set is even number, then median can be calculated by taking average of two middle
numbers of arranged data set (Bethapudi and Desai, 2017).
Document Page
Date Wind speed km/h
22/09/19 15.5
23/09/19 15.55
24/09/19 17.71
25/09/19 19.51
26/09/19 19.67
27/09/19 20.33
28/09/19 20.72
29/09/19 22.42
30/09/19 23.27
01/10/19 25.74
Median (N +
1) / 2 5.5 item
Median
(Value of 5th item +
value of 6th item) / 2
= (19.67 +20.33) / 2
= 20
4. Range - For calculating the range value of given data set, first the highest as well as lowest
value in such set of data has to be determined. After identification of highest and lowest
value, the value having lower degree will be subtracted from the highest number of the data
set which will be called as range of that data set (Dickie, Feldman and Meyers, 2017).
Particulars Figures
Maximum wind
speed 25.74
Minimum wind
speed 15.5
Range =
Maximum –
Minimum value 10.24
5. Standard Deviation - First step is to find out the average value of present data. Then from
each number present, mean has to be subtracted and result obtained needs to be square of.
After, that mean of squared differences needs to evaluate (Massmann, Woods and Wagener,
2018). At last, square root of value obtained will be done for determining standard deviation
value.
Date Wind Speed
km/h X^2
22/09/19 15.55 241.8025
23/09/19 20.72 429.3184
24/09/19 19.51 380.6401
25/09/19 15.5 240.25
26/09/19 25.74 662.5476
27/09/19 20.33 413.3089
Document Page
28/09/19 19.67 386.9089
29/09/19 17.71 313.6441
30/09/19 22.42 502.6564
01/10/19 23.27 541.4929
Total 200.42 4112.5698
Standard deviation= SQRT of ∑x^2 / N – (∑x / n) ^ 2
= SQRT of (4112.5698 / 10) – (200.42 / 10) ^ 2
= SQRT of 411.25698– 401.681764
= SQRT of = 9.575216
= 3.094384591
Ques. 4. Forecasting of data set with the help of linear forecasting model.
1. Steps for calculating the m value.
Formula for calculating m value is m = N Σxy – Σx Σy / N Σ x^2 – (Σx)^2. Steps includes
following:
1. Value of x and y should be multiplied and summed up.
2. Then, value obtained in step 1 needs to be multiplied with total number of observation.
3. Summation of x and y values done on individual basis should be multiplied.
4. Square of x value needs to be done which will be added together and multiplied later on with
total number of observation (Tracy, 2019).
5. Total number of observation should be squared up.
6. Step 4 – step 5 will be done
7. Step 2 – step 3 will be done.
8. Step 7 divided by step 6 will give value of m.
2. Steps for calculating the value of c.
For evaluating the value of c, formula is c = Σy - mΣx / N with steps:
1. Sum total of y value needs to find out.
2. Value of x will be added up and multiplied with value of m as determined.
3. Value obtained in step 2 will be divided by total number of observation.
4. Step 1- step 3 will give value of c.
tabler-icon-diamond-filled.svg

Paraphrase This Document

Need a fresh take? Get an instant paraphrase of this document with our AI Paraphraser
Document Page
3. Forecasting the wind speed for 14 and 21 days.
Date Number of
days (X) Total wind speed (Y) XY X^2
22/09/19 1 15.55 15.55 1
23/09/19 2 20.72 41.44 4
24/09/19 3 19.51 58.53 9
25/09/19 4 15.5 62 16
26/09/19 5 25.74 128.7 25
27/09/19 6 20.33 121.98 36
28/09/19 7 19.67 137.69 49
29/09/19 8 17.71 141.68 64
30/09/19 9 22.42 201.78 81
01/10/19 10 23.27 232.7 100
Total 55 200.42 1142.05 385
Particulars Formula Y = mX + c
m NΣxy – Σx Σy / NΣ x^2 – (Σx)^2
M = 10 (1142.05) - (55 * 200.42) /
(10 * 385) – (55)^2
m = (11420.5 – 11023.1) / (3850 –
3025)
m = 397.4 / 825
m = 0.48169697
c Σy - mΣx / N
c = 200.42 – (0.48169697 * 55) / 10
c = ( 200.42 –26.49333335) / 10
c = 173.92666665 / 10
c =17.392666665
Forecasting
wind speed
for 14 days
Y = mX + c Here x = 14 days
Y = 0.48169697 (14) + 17.392666665
Y = 6.74375758 + 17.392666665
Y = 24.136424245
Forecasting
wind speed
for 21 days
Y = mX + c
Here x = 21 days
Y = 0.48169697 (21) + 17.392666665
Y = 10.11563637 + 17.392666665
Y = 27.508303035
Document Page
CONCLUSION
From the above report it can be concluded that the wind speed of Birmingham city was
showing fluctuating trend with the highest speed on 26 September 2019 i.e. 25.74 km/h and lowest
on 22 September 2019 i.e. 15.5 km/h . Also, as per forecasting done for 14 and 21 days, speed of
wind can be 24.136424245 km/h and 27.508303035 km/h respectively.
Document Page
REFERENCES
Books and Journals
Bethapudi, S. and Desai, S., 2017. Median statistics estimates of Hubble and Newton's
constants. The European Physical Journal Plus. 132(2). p.78.
Dickie, G. A., Feldman, D. J. and Meyers, D. L., International Business Machines Corp,
2017. Merging metadata for database storage regions based on overlapping range values. U.S.
Patent 9,588,978.
Iooss, B. and Lemaître, P., 2015. A review on global sensitivity analysis methods. In Uncertainty
management in simulation-optimization of complex systems (pp. 101-122). Springer, Boston,
MA.
Massmann, C., Woods, R. and Wagener, T., 2018, April. Reducing equifinality by carrying out a
multi-objective evaluation based on the bias, correlation and standard deviation errors. In EGU
General Assembly Conference Abstracts (Vol. 20, p. 11457).
Schabenberger, O. and Gotway, C. A., 2017. Statistical methods for spatial data analysis. Chapman
and Hall/CRC.
Tracy, S. J., 2019. Qualitative research methods: Collecting evidence, crafting analysis,
communicating impact. John Wiley & Sons.
Online
Steps for calculating standard deviation. 2019. [Online]. Available through:
<https://www.thoughtco.com/calculate-a-sample-standard-deviation-3126345>.
chevron_up_icon
1 out of 10
circle_padding
hide_on_mobile
zoom_out_icon
[object Object]