Data Analysis and Forecasting: Wind Speed Report, Calculations
VerifiedAdded on 2021/02/20
|10
|1554
|41
Report
AI Summary
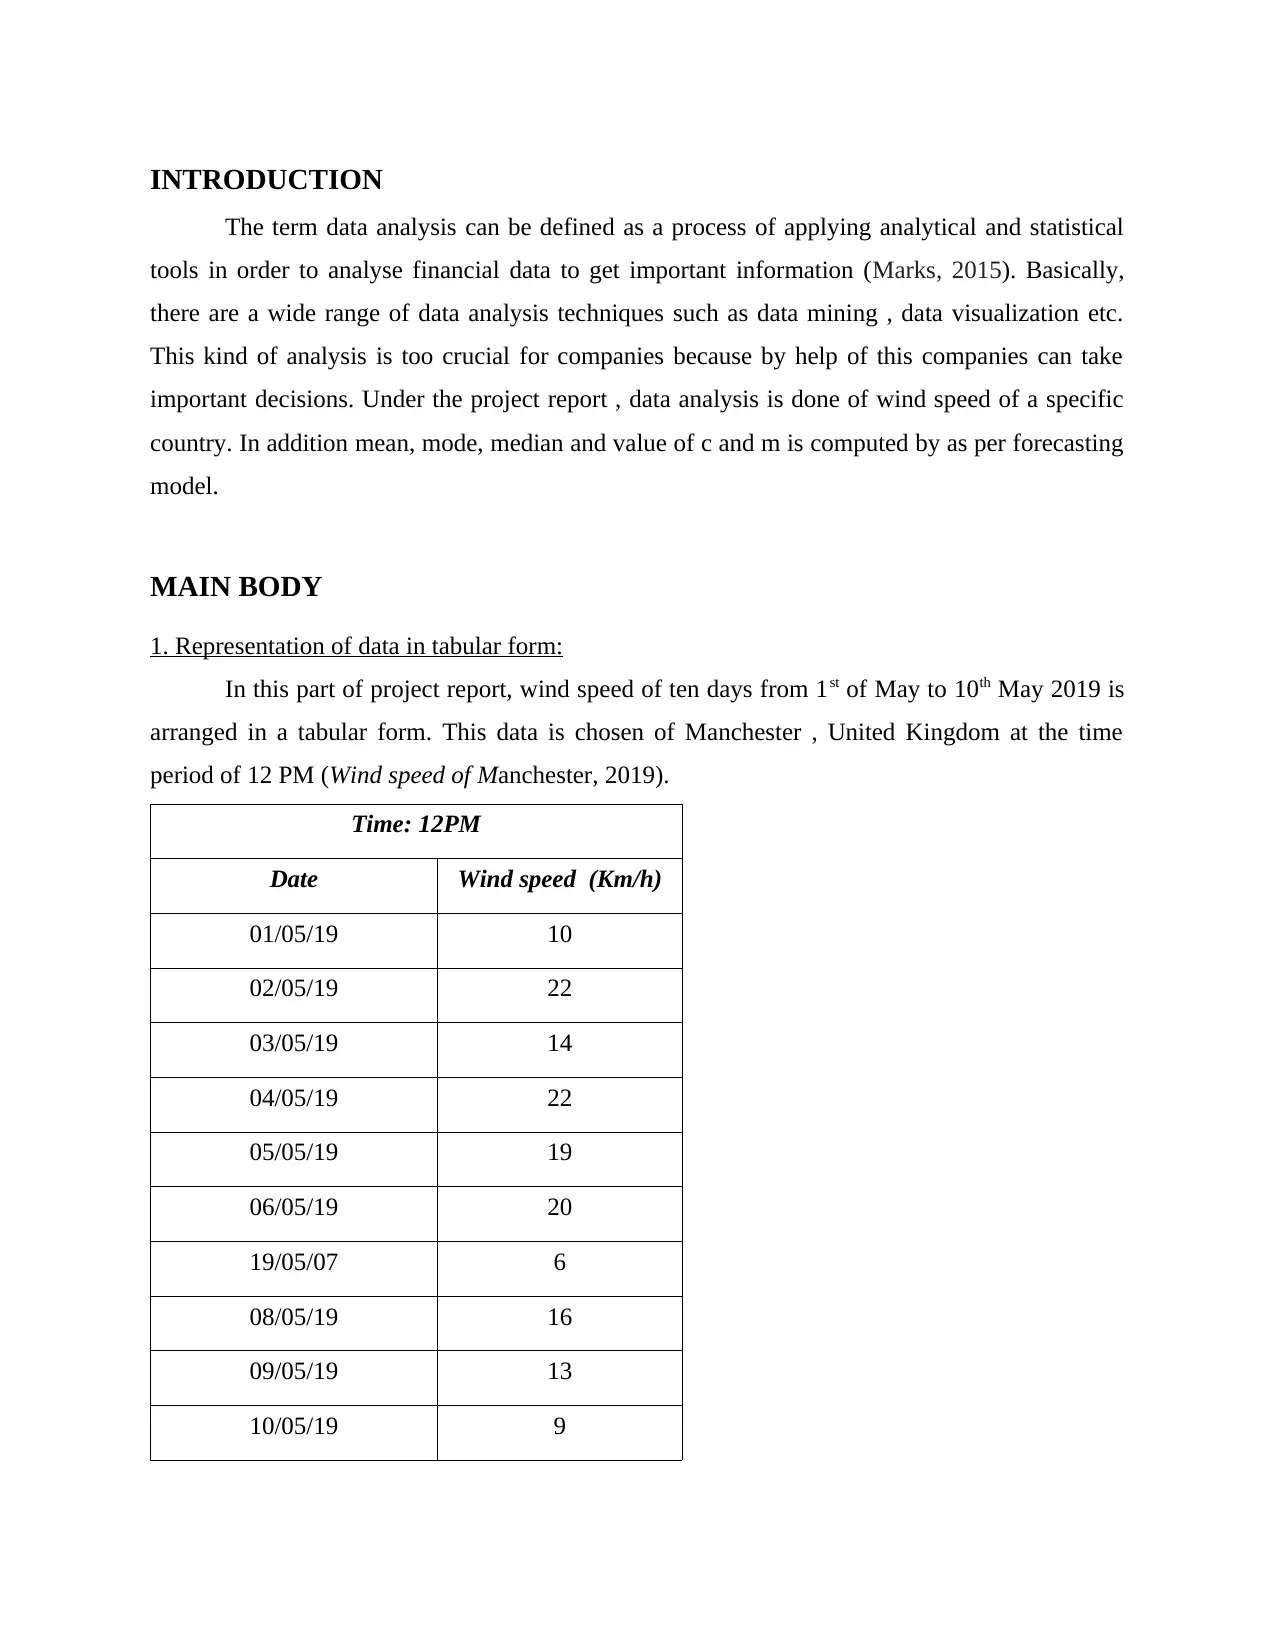
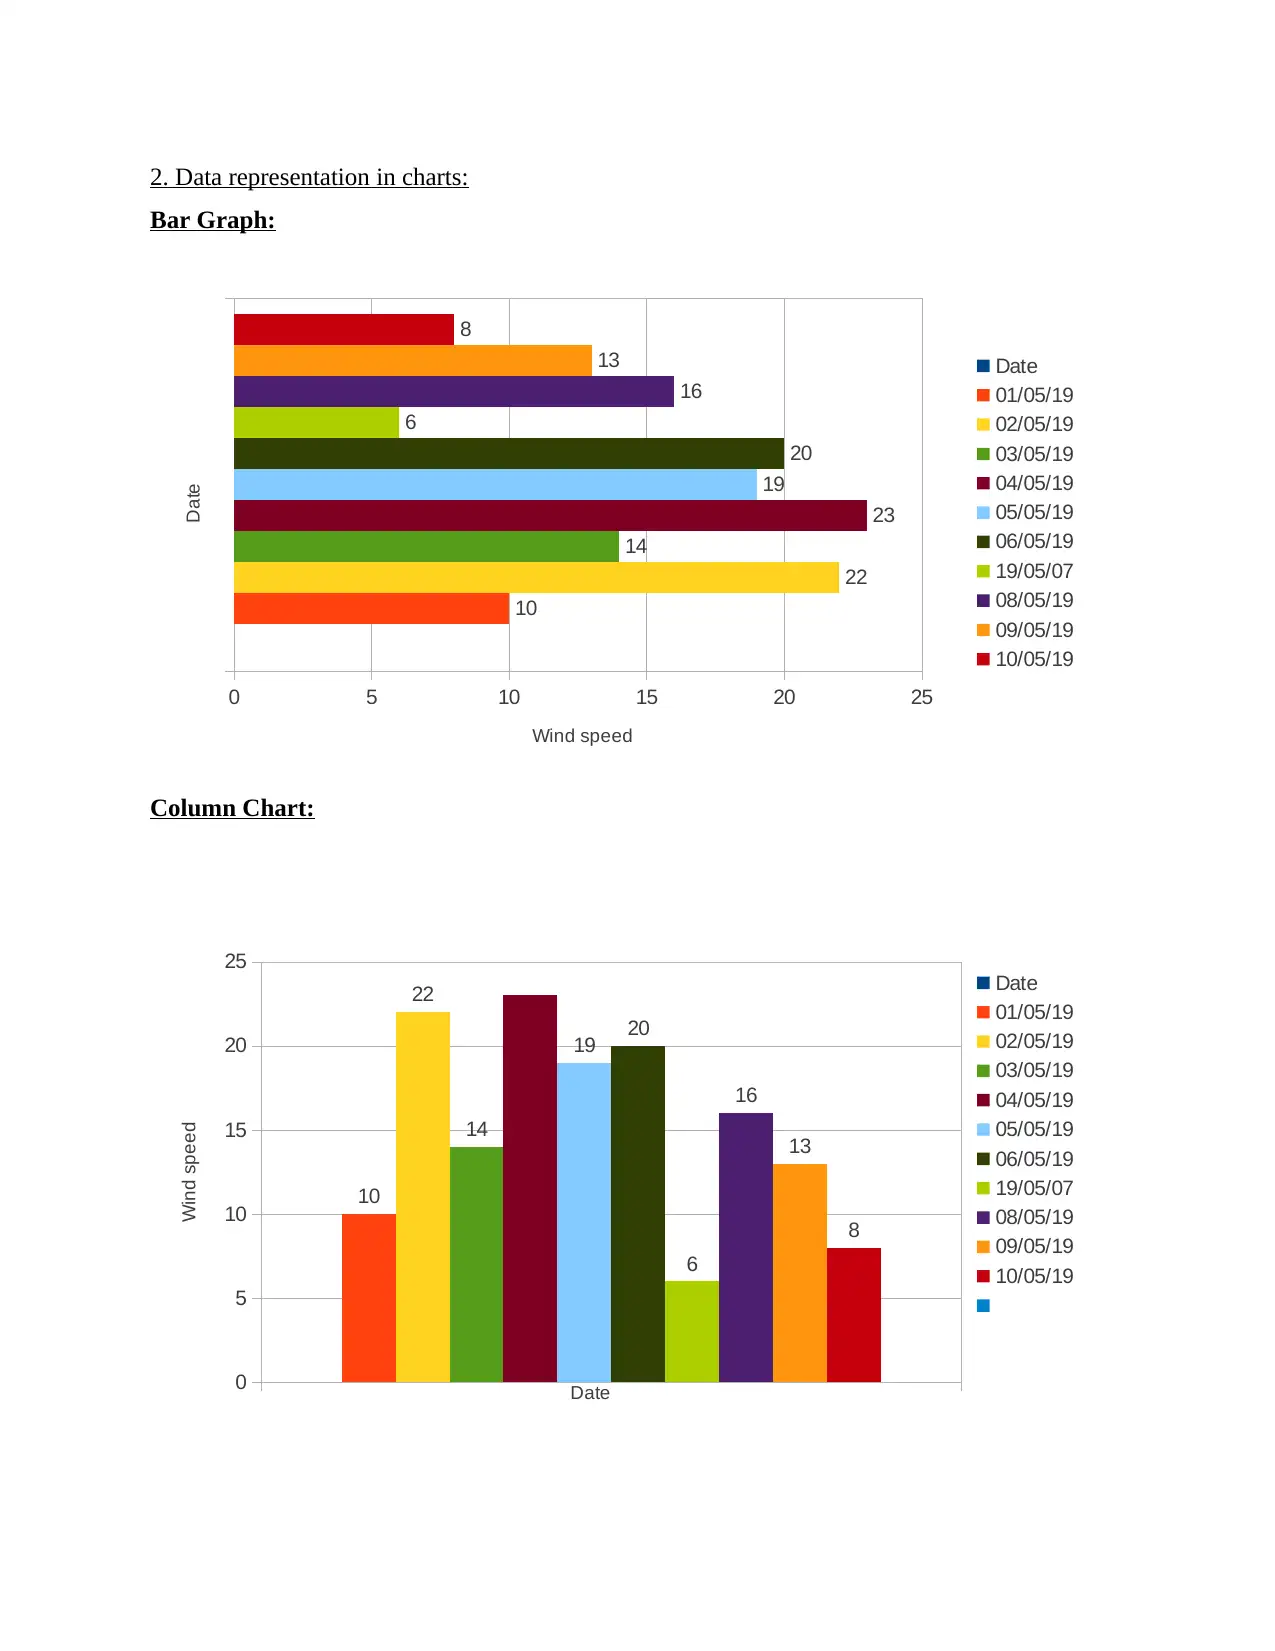
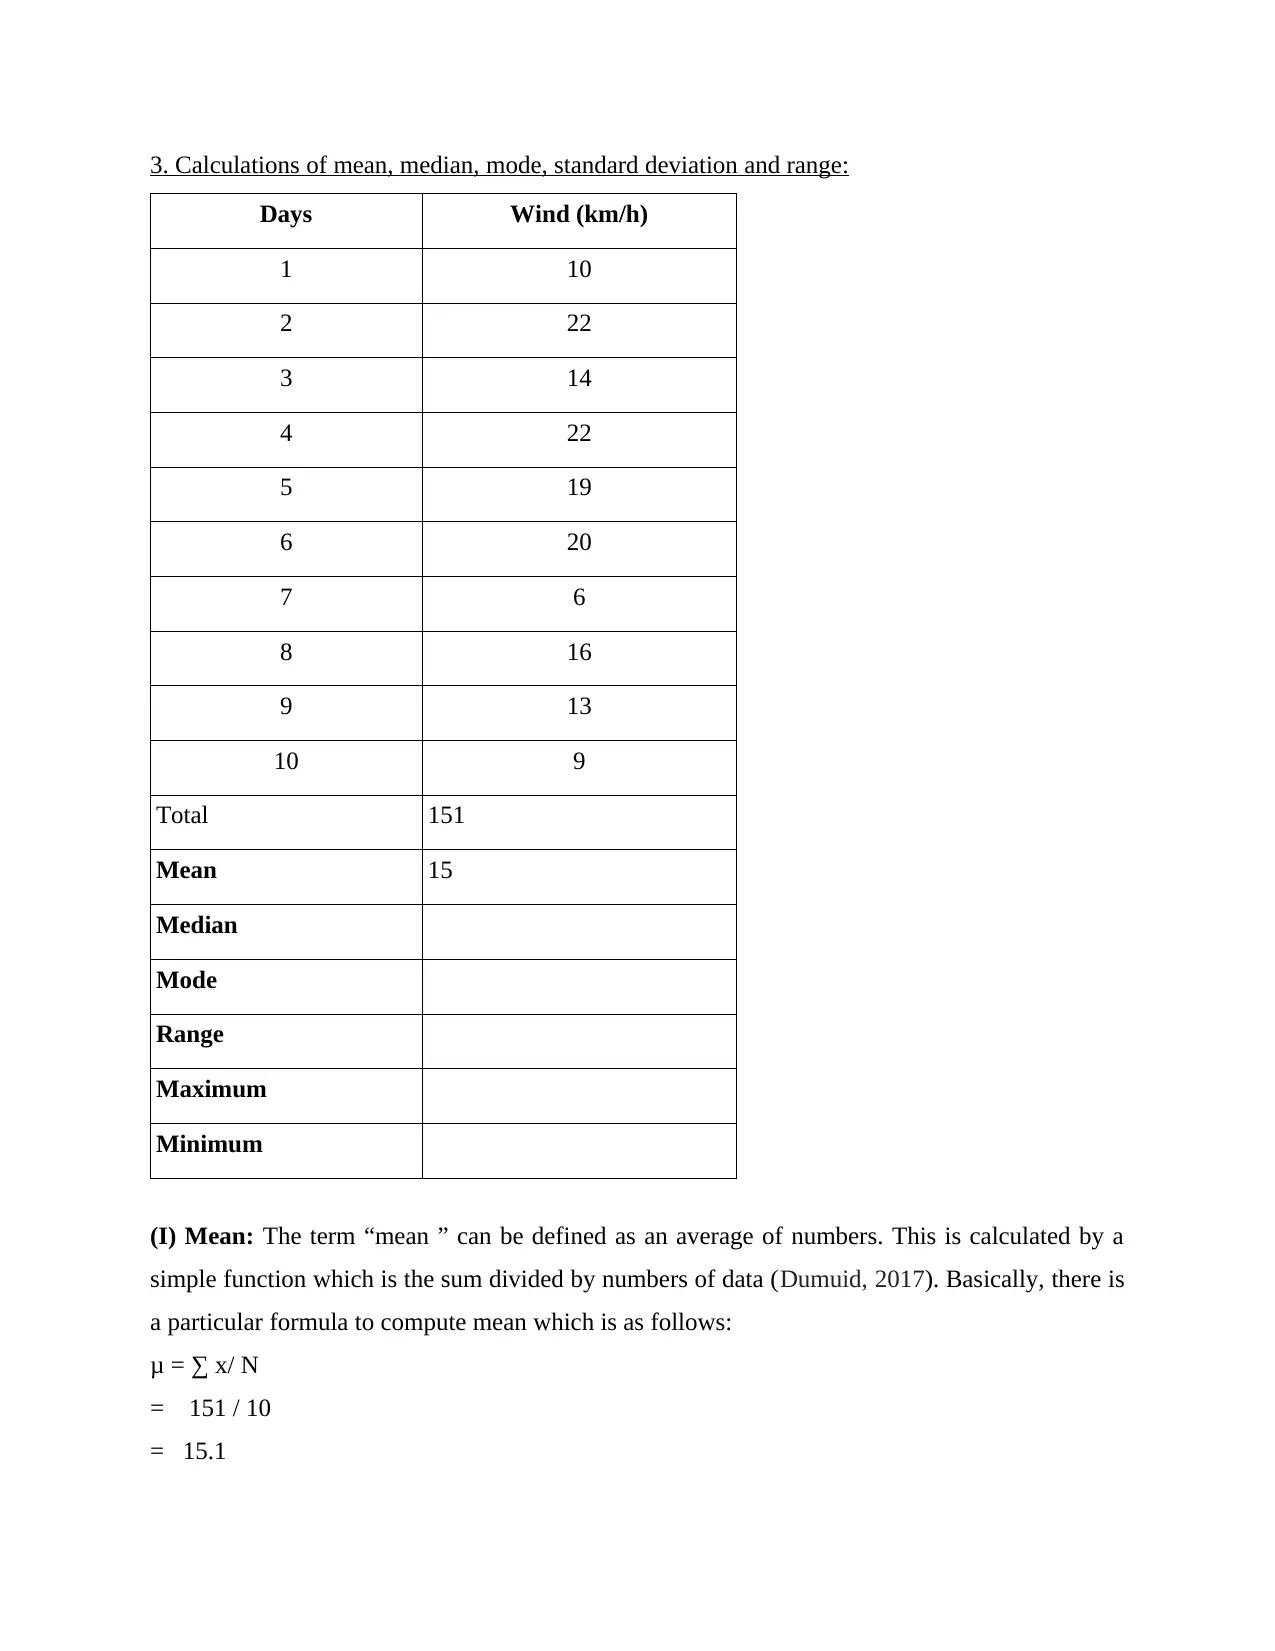
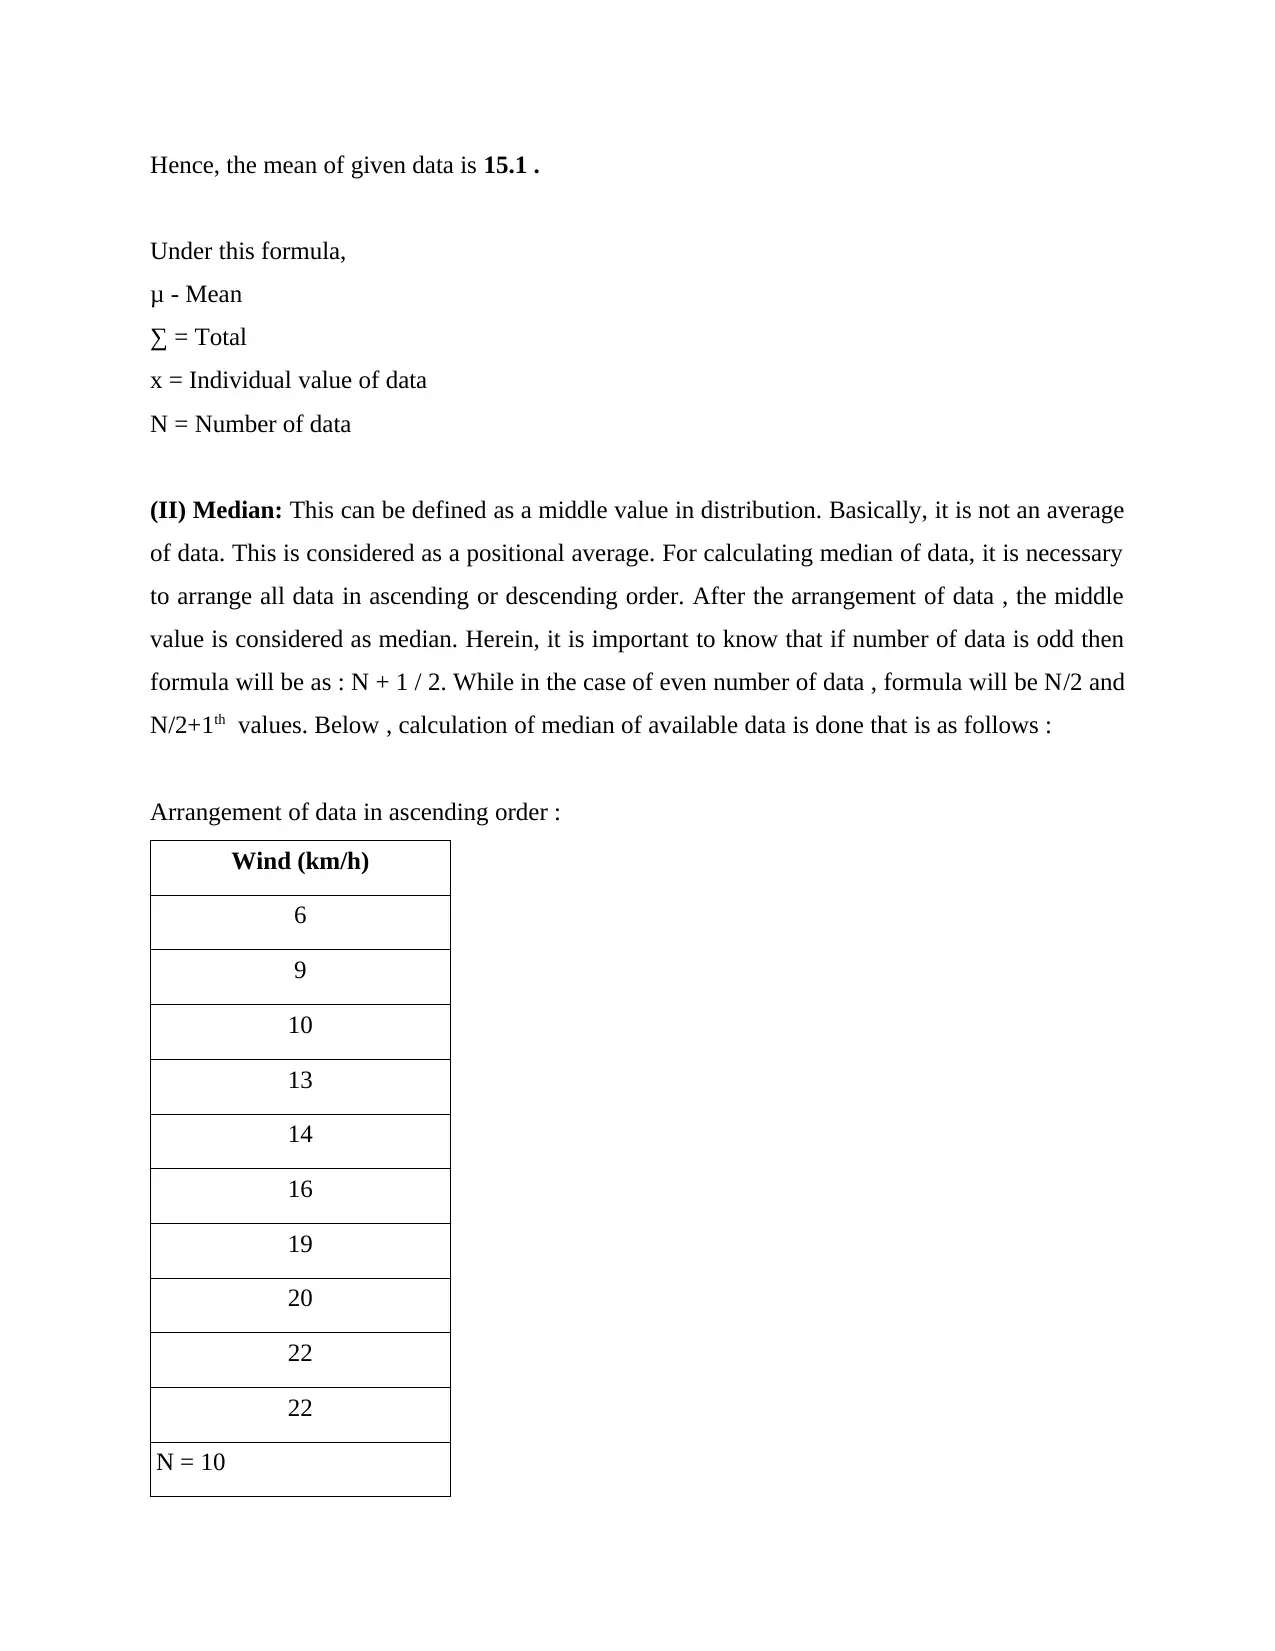
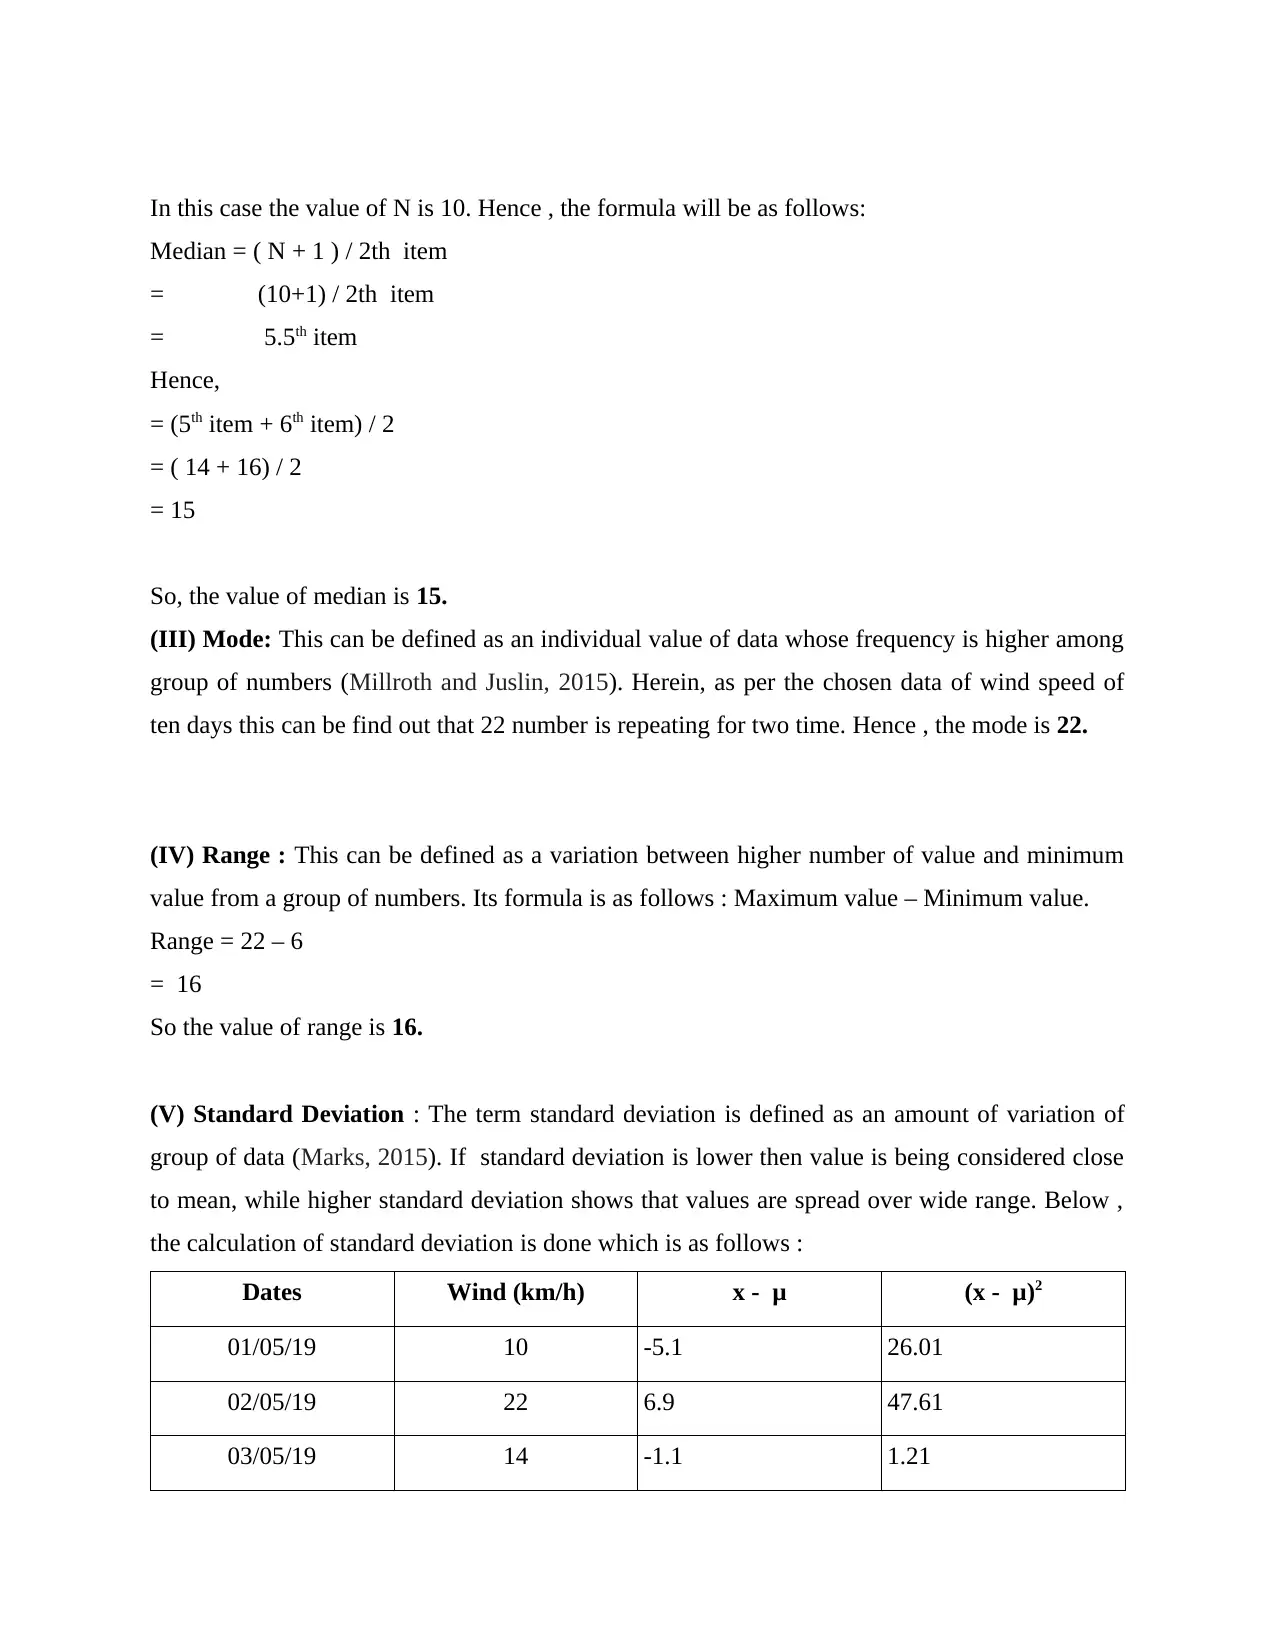
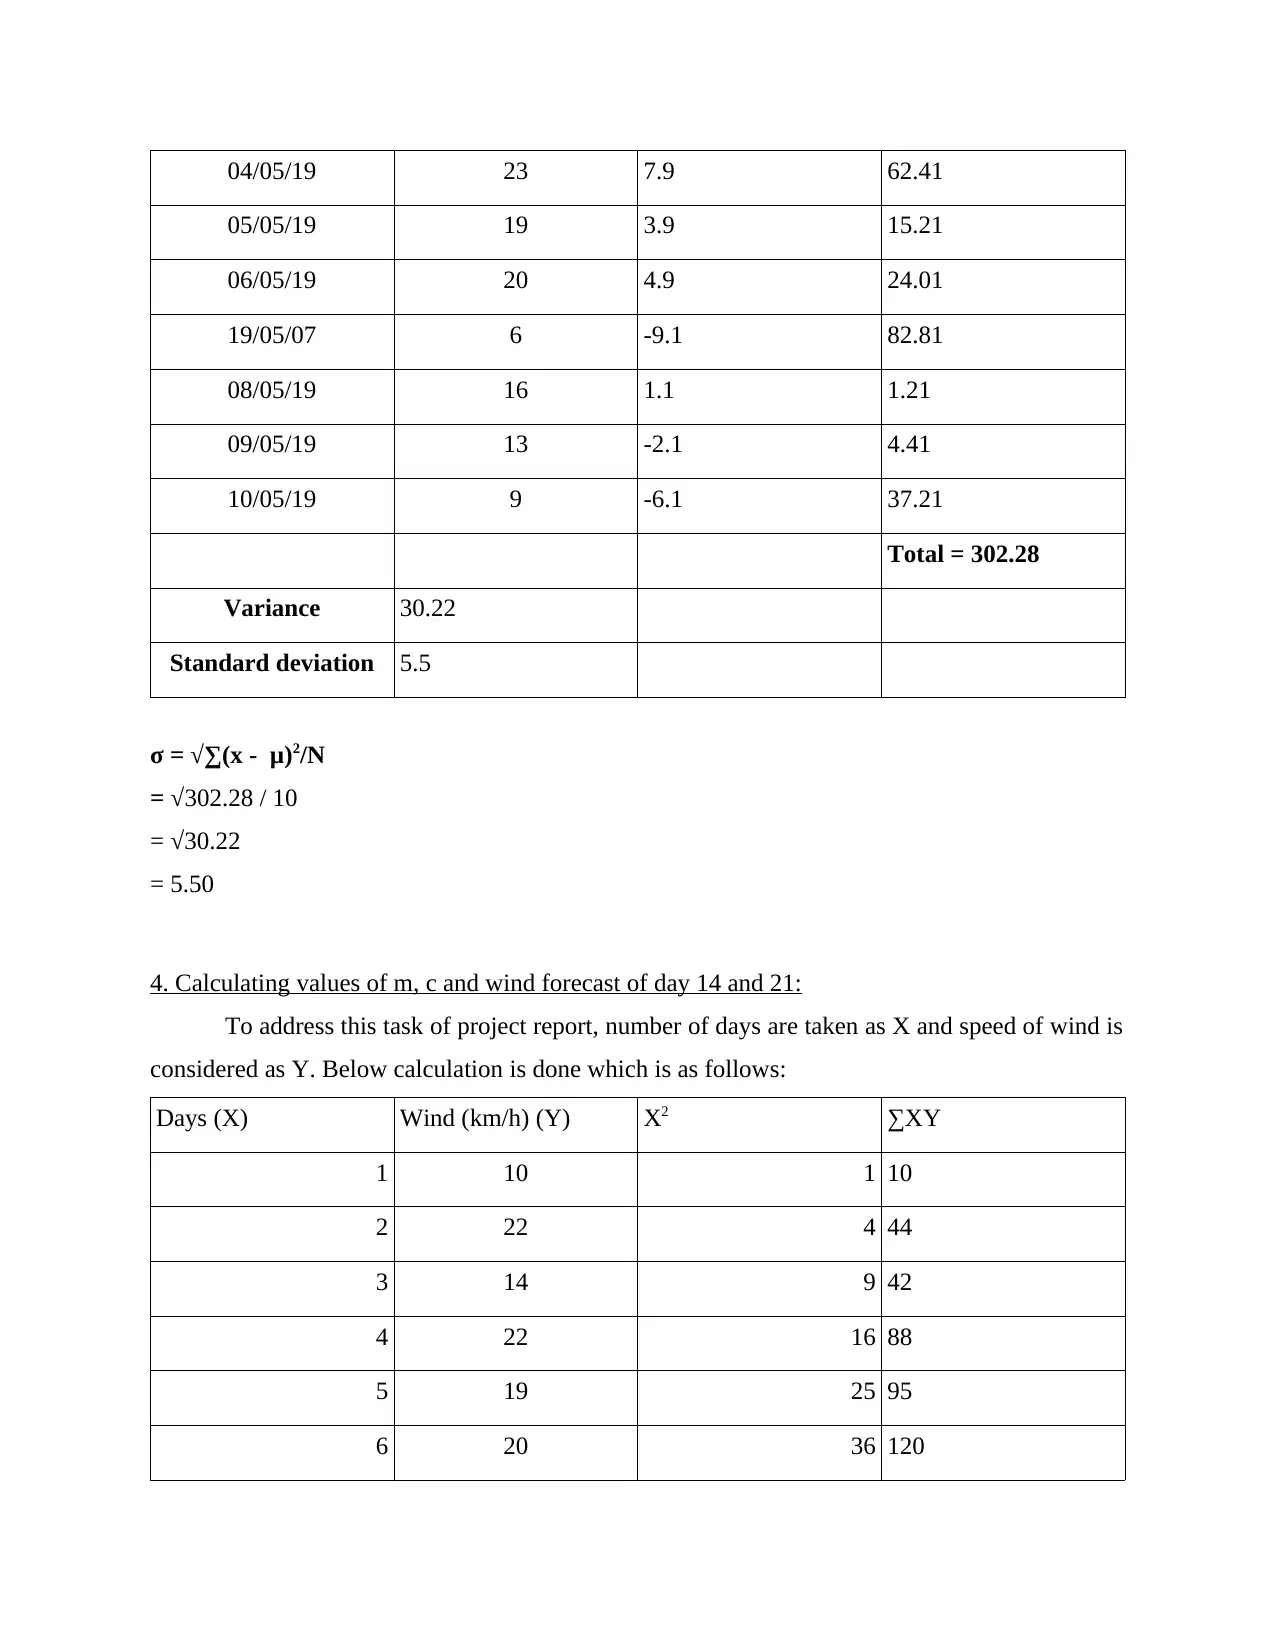
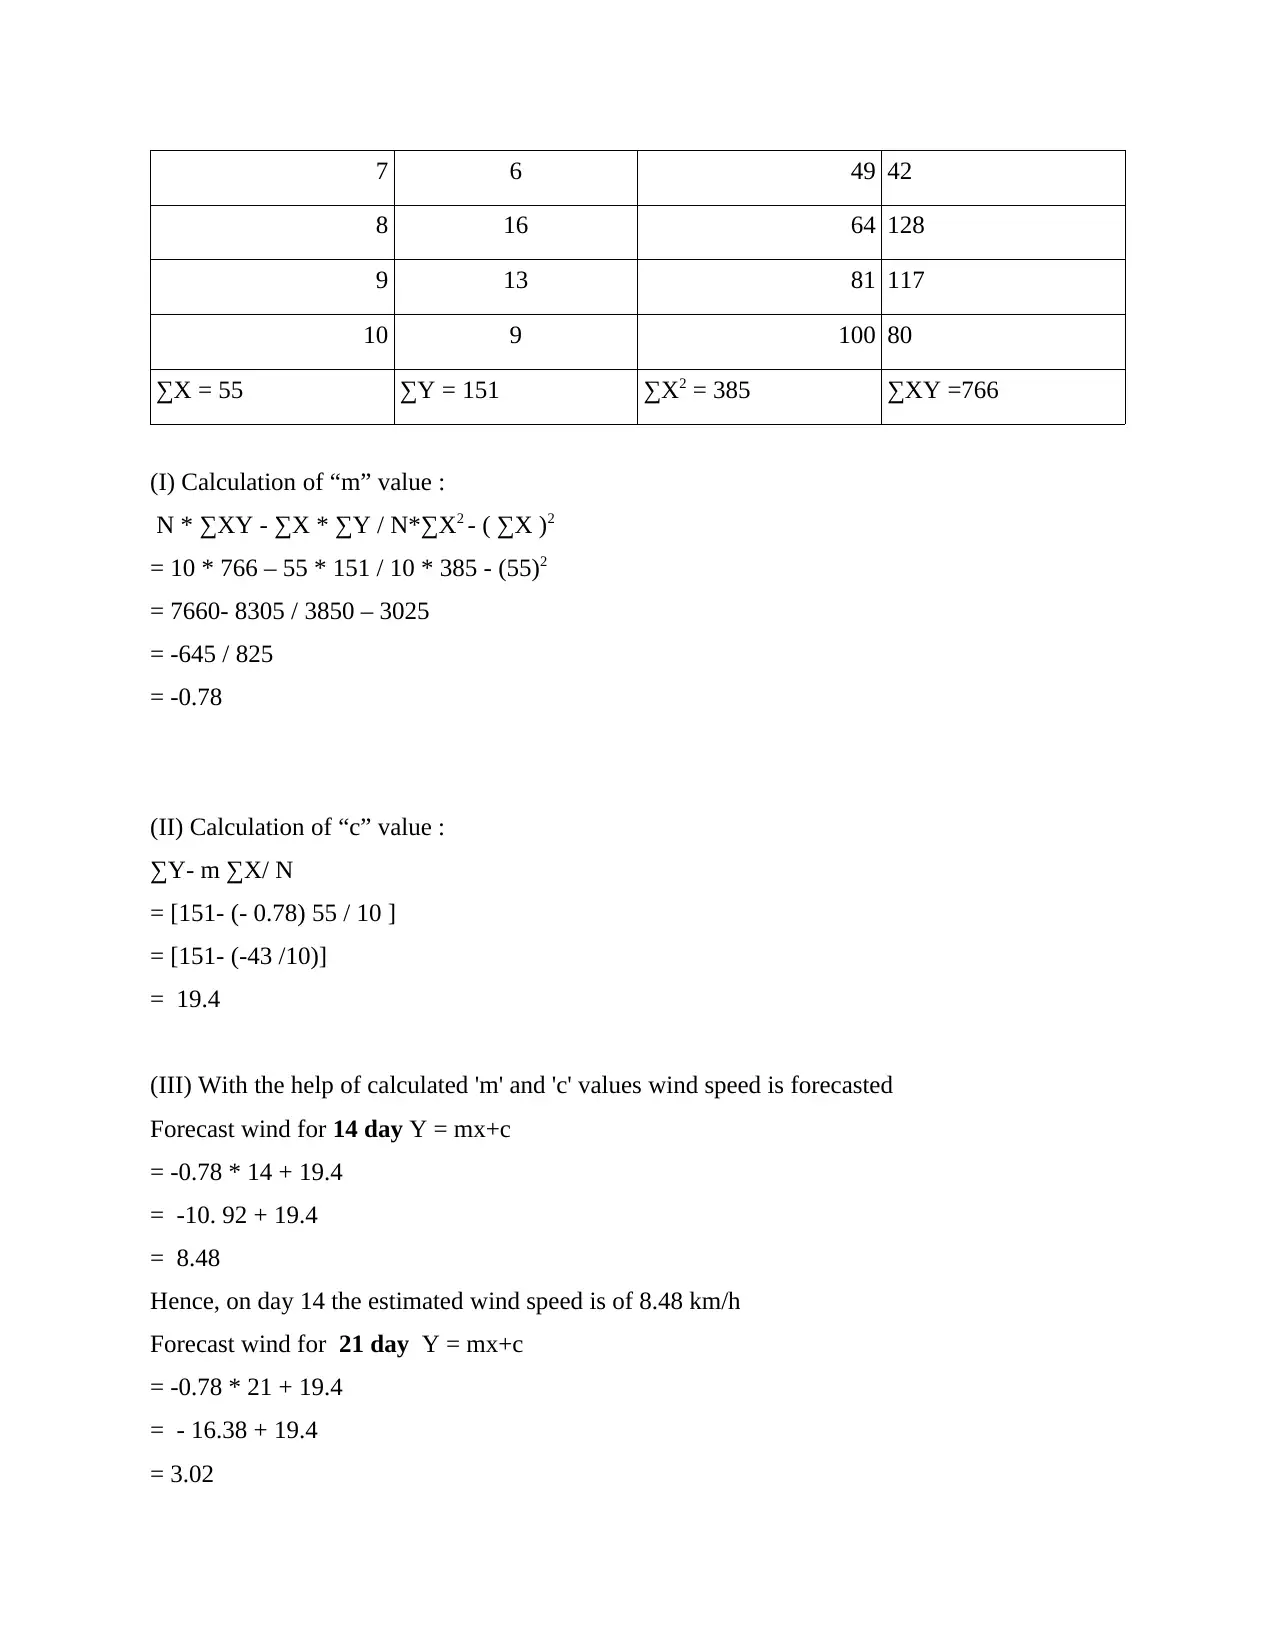
This report presents a comprehensive data analysis of wind speed data from Manchester, UK, focusing on a ten-day period in May 2019. The analysis begins with the representation of the data in both tabular and graphical formats, including bar graphs and column charts. Key statistical measures such as mean, median, mode, range, and standard deviation are calculated to provide a detailed understanding of the data's characteristics. Furthermore, the report employs a linear forecasting model to predict wind speeds for the 14th and 21st days, calculating the values of 'm' and 'c' to derive the forecasts. The conclusion emphasizes the importance of data analysis for decision-making and summarizes the findings, highlighting the application of various analytical techniques and forecasting methods.

Numeracy and Data
Analysis
Analysis
Paraphrase This Document
Need a fresh take? Get an instant paraphrase of this document with our AI Paraphraser

Table of Contents
INTRODUCTION...........................................................................................................................3
MAIN BODY...................................................................................................................................3
1. Representation of data in tabular form:...................................................................................3
2. Data representation in charts:..................................................................................................4
3. Calculations of mean, median, mode, standard deviation and range:.....................................5
4. Calculating values of m, c and wind forecast of day 14 and 21:............................................8
CONCLUSION................................................................................................................................9
REFERENCES..............................................................................................................................10

INTRODUCTION
The term data analysis can be defined as a process of applying analytical and statistical
tools in order to analyse financial data to get important information (Marks, 2015). Basically,
there are a wide range of data analysis techniques such as data mining , data visualization etc.
This kind of analysis is too crucial for companies because by help of this companies can take
important decisions. Under the project report , data analysis is done of wind speed of a specific
country. In addition mean, mode, median and value of c and m is computed by as per forecasting
model.
MAIN BODY
1. Representation of data in tabular form:
In this part of project report, wind speed of ten days from 1st of May to 10th May 2019 is
arranged in a tabular form. This data is chosen of Manchester , United Kingdom at the time
period of 12 PM (Wind speed of Manchester, 2019).
Time: 12PM
Date Wind speed (Km/h)
01/05/19 10
02/05/19 22
03/05/19 14
04/05/19 22
05/05/19 19
06/05/19 20
19/05/07 6
08/05/19 16
09/05/19 13
10/05/19 9
⊘ This is a preview!⊘
Do you want full access?
Subscribe today to unlock all pages.

Trusted by 1+ million students worldwide

2. Data representation in charts:
Bar Graph:
0 5 10 15 20 25
10
22
14
23
19
20
6
16
13
8
Date
01/05/19
02/05/19
03/05/19
04/05/19
05/05/19
06/05/19
19/05/07
08/05/19
09/05/19
10/05/19
Wind speed
Date
Column Chart:
0
5
10
15
20
25
10
22
14
19 20
6
16
13
8
Date
01/05/19
02/05/19
03/05/19
04/05/19
05/05/19
06/05/19
19/05/07
08/05/19
09/05/19
10/05/19
Date
Wind speed
Paraphrase This Document
Need a fresh take? Get an instant paraphrase of this document with our AI Paraphraser

3. Calculations of mean, median, mode, standard deviation and range:
Days Wind (km/h)
1 10
2 22
3 14
4 22
5 19
6 20
7 6
8 16
9 13
10 9
Total 151
Mean 15
Median
Mode
Range
Maximum
Minimum
(I) Mean: The term “mean ” can be defined as an average of numbers. This is calculated by a
simple function which is the sum divided by numbers of data (Dumuid, 2017). Basically, there is
a particular formula to compute mean which is as follows:
μ = ∑ x/ N
= 151 / 10
= 15.1

Hence, the mean of given data is 15.1 .
Under this formula,
μ - Mean
∑ = Total
x = Individual value of data
N = Number of data
(II) Median: This can be defined as a middle value in distribution. Basically, it is not an average
of data. This is considered as a positional average. For calculating median of data, it is necessary
to arrange all data in ascending or descending order. After the arrangement of data , the middle
value is considered as median. Herein, it is important to know that if number of data is odd then
formula will be as : N + 1 / 2. While in the case of even number of data , formula will be N/2 and
N/2+1th values. Below , calculation of median of available data is done that is as follows :
Arrangement of data in ascending order :
Wind (km/h)
6
9
10
13
14
16
19
20
22
22
N = 10
⊘ This is a preview!⊘
Do you want full access?
Subscribe today to unlock all pages.

Trusted by 1+ million students worldwide

In this case the value of N is 10. Hence , the formula will be as follows:
Median = ( N + 1 ) / 2th item
= (10+1) / 2th item
= 5.5th item
Hence,
= (5th item + 6th item) / 2
= ( 14 + 16) / 2
= 15
So, the value of median is 15.
(III) Mode: This can be defined as an individual value of data whose frequency is higher among
group of numbers (Millroth and Juslin, 2015). Herein, as per the chosen data of wind speed of
ten days this can be find out that 22 number is repeating for two time. Hence , the mode is 22.
(IV) Range : This can be defined as a variation between higher number of value and minimum
value from a group of numbers. Its formula is as follows : Maximum value – Minimum value.
Range = 22 – 6
= 16
So the value of range is 16.
(V) Standard Deviation : The term standard deviation is defined as an amount of variation of
group of data (Marks, 2015). If standard deviation is lower then value is being considered close
to mean, while higher standard deviation shows that values are spread over wide range. Below ,
the calculation of standard deviation is done which is as follows :
Dates Wind (km/h) x - μ (x - μ)2
01/05/19 10 -5.1 26.01
02/05/19 22 6.9 47.61
03/05/19 14 -1.1 1.21
Paraphrase This Document
Need a fresh take? Get an instant paraphrase of this document with our AI Paraphraser

04/05/19 23 7.9 62.41
05/05/19 19 3.9 15.21
06/05/19 20 4.9 24.01
19/05/07 6 -9.1 82.81
08/05/19 16 1.1 1.21
09/05/19 13 -2.1 4.41
10/05/19 9 -6.1 37.21
Total = 302.28
Variance 30.22
Standard deviation 5.5
σ = √∑(x - μ)2/N
= √302.28 / 10
= √30.22
= 5.50
4. Calculating values of m, c and wind forecast of day 14 and 21:
To address this task of project report, number of days are taken as X and speed of wind is
considered as Y. Below calculation is done which is as follows:
Days (X) Wind (km/h) (Y) X2 ∑XY
1 10 1 10
2 22 4 44
3 14 9 42
4 22 16 88
5 19 25 95
6 20 36 120

7 6 49 42
8 16 64 128
9 13 81 117
10 9 100 80
∑X = 55 ∑Y = 151 ∑X2 = 385 ∑XY =766
(I) Calculation of “m” value :
N * ∑XY - ∑X * ∑Y / N*∑X2 - ( ∑X )2
= 10 * 766 – 55 * 151 / 10 * 385 - (55)2
= 7660- 8305 / 3850 – 3025
= -645 / 825
= -0.78
(II) Calculation of “c” value :
∑Y- m ∑X/ N
= [151- (- 0.78) 55 / 10 ]
= [151- (-43 /10)]
= 19.4
(III) With the help of calculated 'm' and 'c' values wind speed is forecasted
Forecast wind for 14 day Y = mx+c
= -0.78 * 14 + 19.4
= -10. 92 + 19.4
= 8.48
Hence, on day 14 the estimated wind speed is of 8.48 km/h
Forecast wind for 21 day Y = mx+c
= -0.78 * 21 + 19.4
= - 16.38 + 19.4
= 3.02
⊘ This is a preview!⊘
Do you want full access?
Subscribe today to unlock all pages.

Trusted by 1+ million students worldwide

Hence, on day 21 the estimated wind speed is of 3.02 km/h
CONCLUSION
On the basis of above project report this can be concluded analysis of data is very crucial
for companies in order to take important decisions. Under the project report, chosen data is
analysed and mean, mode, median, range are calculated. As well as by help of liner forecasting
method is used to compute forecasting of 14th and 21st days.
1 out of 10
Related Documents

Your All-in-One AI-Powered Toolkit for Academic Success.
+13062052269
info@desklib.com
Available 24*7 on WhatsApp / Email
Unlock your academic potential
Copyright © 2020–2025 A2Z Services. All Rights Reserved. Developed and managed by ZUCOL.