University Data Analytics and Business Intelligence Report on Amazon
VerifiedAdded on 2022/10/02
|13
|2196
|26
Report
AI Summary
This report provides a comprehensive data analytics and business intelligence analysis of Amazon's stock performance. The study begins with an introduction to Amazon and its business context, followed by graphical representations of stock prices and trading volume using scatter plots and histograms. Descriptive statistics, including mean, median, mode, and standard deviation, are calculated for both adjusted daily closing stock prices and stock volume. The report interprets these statistics to identify trends, volatility, and potential market signals, connecting the findings to practical business implications. The analysis covers a one-year period, offering insights into the company's financial health, market demand, and opportunities for revenue growth. The report concludes by summarizing the key findings and their significance for Amazon's management, emphasizing the value of data-driven decision-making in launching new products and improving overall business strategies. The report includes references to relevant sources.
Running head: Data Analytics And Business Intelligence on Amazon
Data Analytics and Business Intelligence on Amazon
Name of the Student:
Name of the University:
Author Note:
Data Analytics and Business Intelligence on Amazon
Name of the Student:
Name of the University:
Author Note:
Paraphrase This Document
Need a fresh take? Get an instant paraphrase of this document with our AI Paraphraser
1Running head: Data Analytics And Business Intelligence on Amazon
Table of Contents
Chapter 1: Introduction..............................................................................................................2
1.1 Background of the company........................................................................................2
1.2 Practical Business context Amazon.................................................................................2
Chapter 2: Graphical Representation.........................................................................................3
Chapter 3: Descriptive Statistics................................................................................................7
3.1 Central tendency on Adjusted Daily Closing Stock Prices..............................................7
3.2 Central tendency of Stock Volume on Amazon...............................................................8
Chapter 4: Conclusion..............................................................................................................10
Chapter 5: References..............................................................................................................11
2Running head: Data Analytics And Business Intelligence on Amazon
Chapter 1: Introduction
1.1 Background of the company
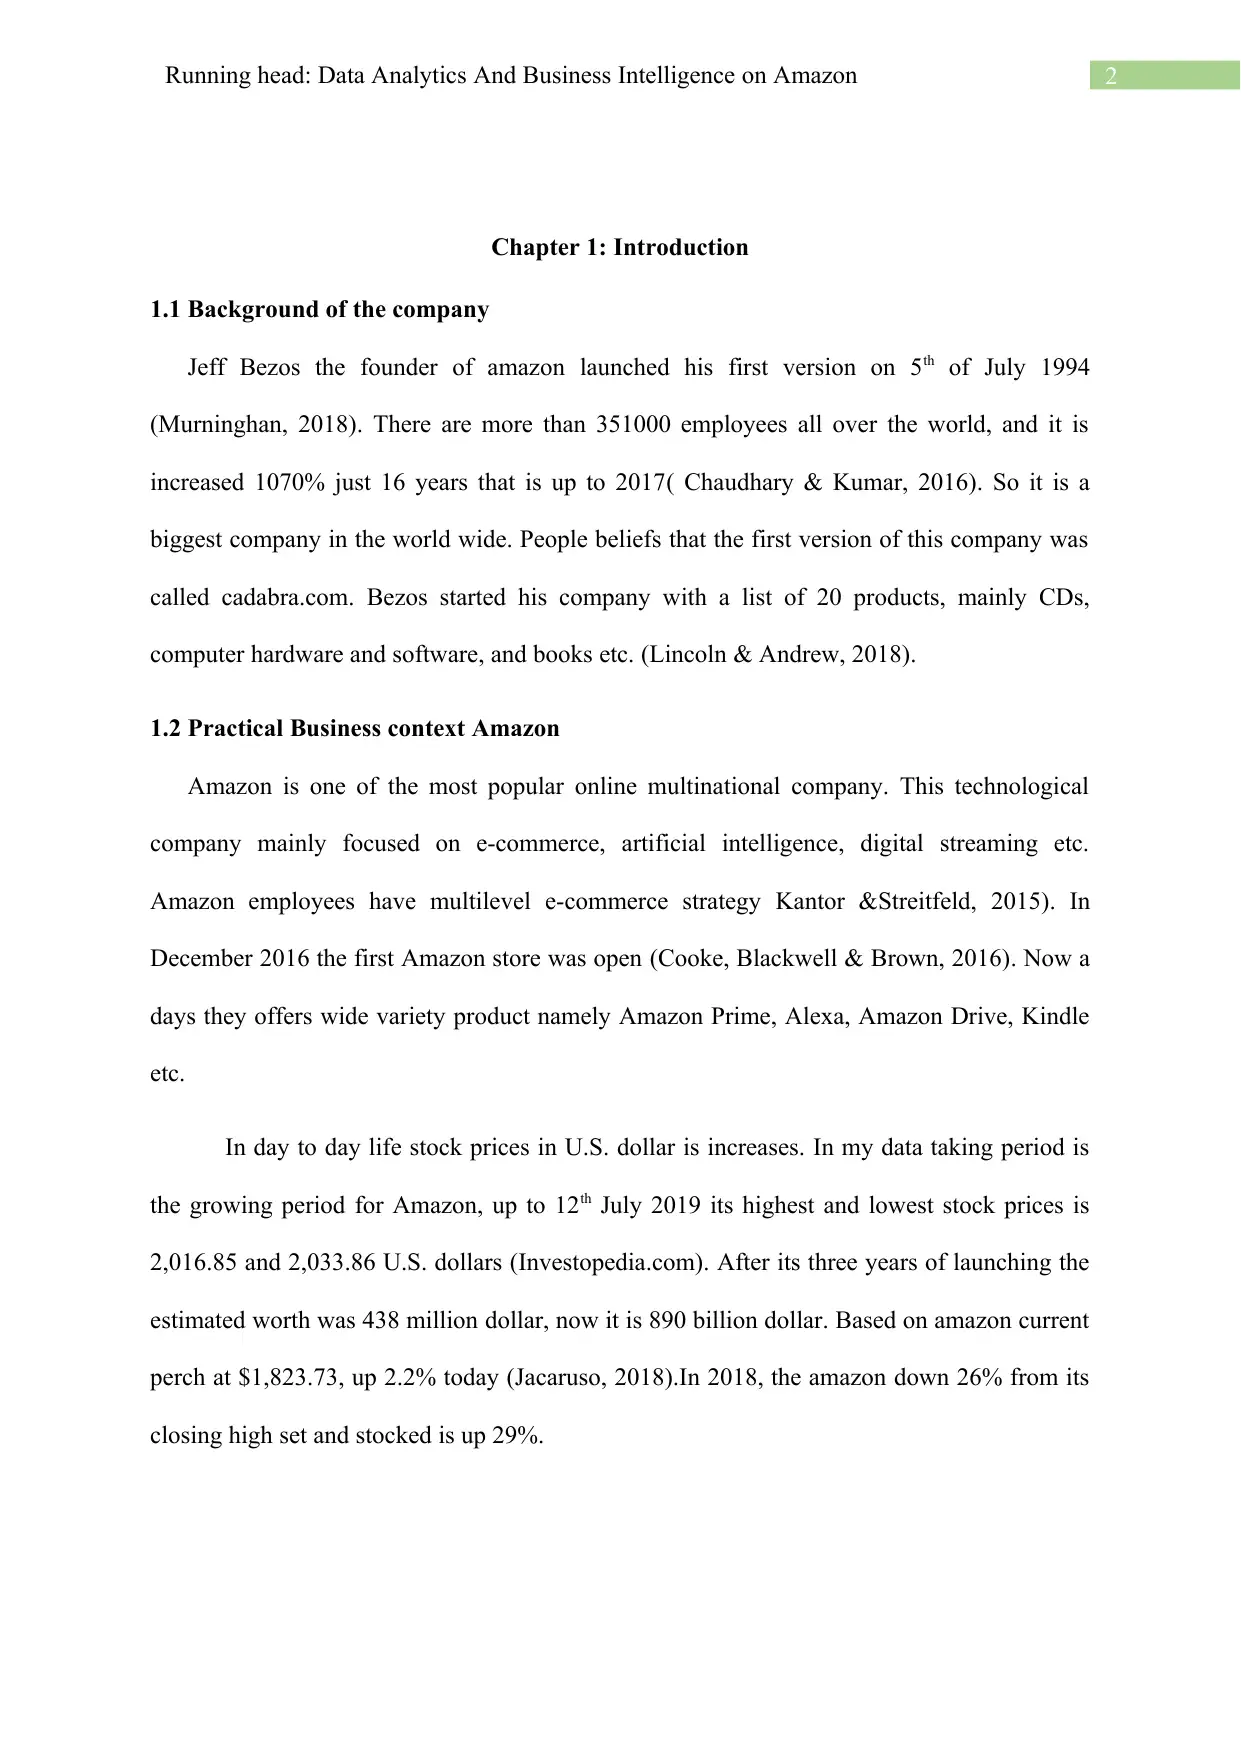
Jeff Bezos the founder of amazon launched his first version on 5th of July 1994
(Murninghan, 2018). There are more than 351000 employees all over the world, and it is
increased 1070% just 16 years that is up to 2017( Chaudhary & Kumar, 2016). So it is a
biggest company in the world wide. People beliefs that the first version of this company was
called cadabra.com. Bezos started his company with a list of 20 products, mainly CDs,
computer hardware and software, and books etc. (Lincoln & Andrew, 2018).
1.2 Practical Business context Amazon
Amazon is one of the most popular online multinational company. This technological
company mainly focused on e-commerce, artificial intelligence, digital streaming etc.
Amazon employees have multilevel e-commerce strategy Kantor &Streitfeld, 2015). In
December 2016 the first Amazon store was open (Cooke, Blackwell & Brown, 2016). Now a
days they offers wide variety product namely Amazon Prime, Alexa, Amazon Drive, Kindle
etc.
In day to day life stock prices in U.S. dollar is increases. In my data taking period is
the growing period for Amazon, up to 12th July 2019 its highest and lowest stock prices is
2,016.85 and 2,033.86 U.S. dollars (Investopedia.com). After its three years of launching the
estimated worth was 438 million dollar, now it is 890 billion dollar. Based on amazon current
perch at $1,823.73, up 2.2% today (Jacaruso, 2018).In 2018, the amazon down 26% from its
closing high set and stocked is up 29%.
Chapter 1: Introduction
1.1 Background of the company
Jeff Bezos the founder of amazon launched his first version on 5th of July 1994
(Murninghan, 2018). There are more than 351000 employees all over the world, and it is
increased 1070% just 16 years that is up to 2017( Chaudhary & Kumar, 2016). So it is a
biggest company in the world wide. People beliefs that the first version of this company was
called cadabra.com. Bezos started his company with a list of 20 products, mainly CDs,
computer hardware and software, and books etc. (Lincoln & Andrew, 2018).
1.2 Practical Business context Amazon
Amazon is one of the most popular online multinational company. This technological
company mainly focused on e-commerce, artificial intelligence, digital streaming etc.
Amazon employees have multilevel e-commerce strategy Kantor &Streitfeld, 2015). In
December 2016 the first Amazon store was open (Cooke, Blackwell & Brown, 2016). Now a
days they offers wide variety product namely Amazon Prime, Alexa, Amazon Drive, Kindle
etc.
In day to day life stock prices in U.S. dollar is increases. In my data taking period is
the growing period for Amazon, up to 12th July 2019 its highest and lowest stock prices is
2,016.85 and 2,033.86 U.S. dollars (Investopedia.com). After its three years of launching the
estimated worth was 438 million dollar, now it is 890 billion dollar. Based on amazon current
perch at $1,823.73, up 2.2% today (Jacaruso, 2018).In 2018, the amazon down 26% from its
closing high set and stocked is up 29%.
⊘ This is a preview!⊘
Do you want full access?
Subscribe today to unlock all pages.
Trusted by 1+ million students worldwide
3Running head: Data Analytics And Business Intelligence on Amazon
Chapter 2: Graphical Representation
0
500
1000
1500
2000
2500
Scatter Plots on Highest stock Price
Time in Days
Stock Prices in U.S. Dollars
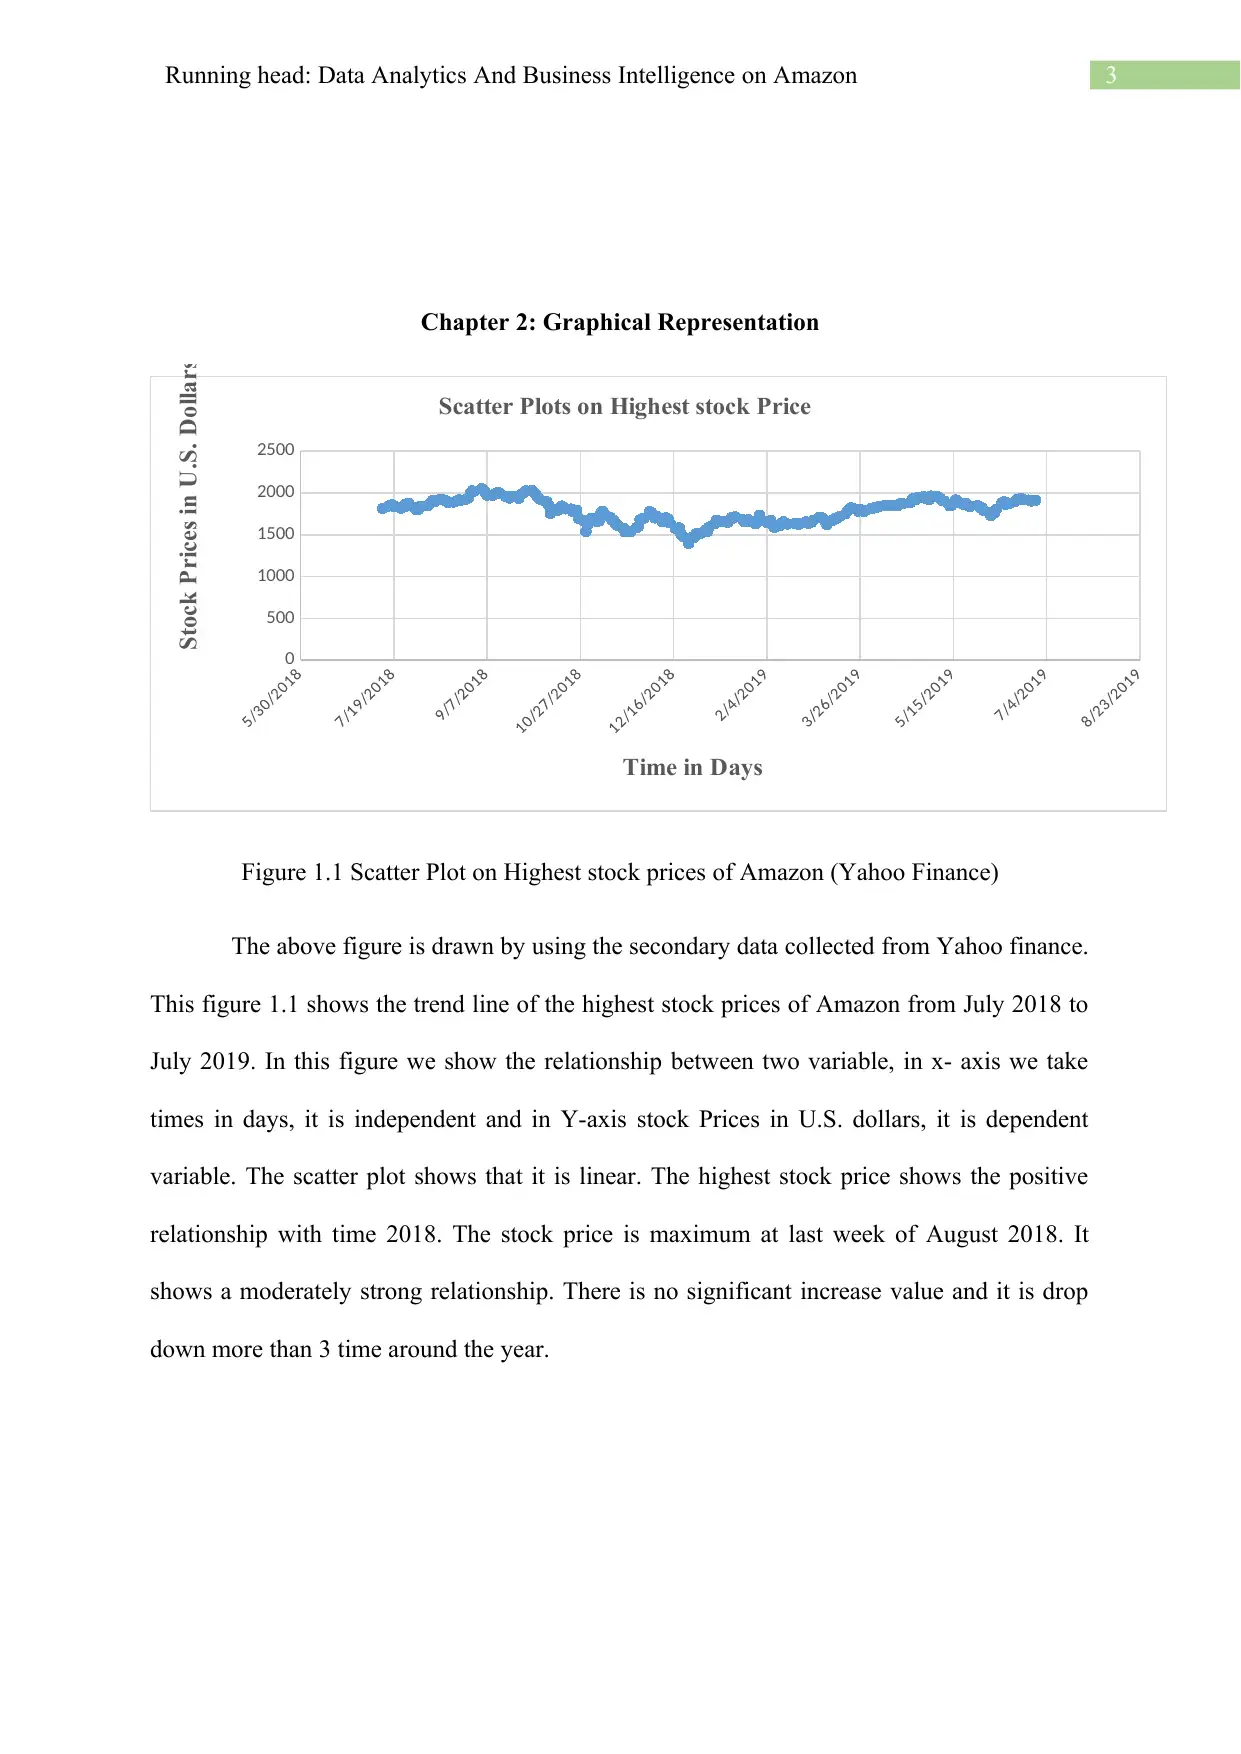
Figure 1.1 Scatter Plot on Highest stock prices of Amazon (Yahoo Finance)
The above figure is drawn by using the secondary data collected from Yahoo finance.
This figure 1.1 shows the trend line of the highest stock prices of Amazon from July 2018 to
July 2019. In this figure we show the relationship between two variable, in x- axis we take
times in days, it is independent and in Y-axis stock Prices in U.S. dollars, it is dependent
variable. The scatter plot shows that it is linear. The highest stock price shows the positive
relationship with time 2018. The stock price is maximum at last week of August 2018. It
shows a moderately strong relationship. There is no significant increase value and it is drop
down more than 3 time around the year.
Chapter 2: Graphical Representation
0
500
1000
1500
2000
2500
Scatter Plots on Highest stock Price
Time in Days
Stock Prices in U.S. Dollars
Figure 1.1 Scatter Plot on Highest stock prices of Amazon (Yahoo Finance)
The above figure is drawn by using the secondary data collected from Yahoo finance.
This figure 1.1 shows the trend line of the highest stock prices of Amazon from July 2018 to
July 2019. In this figure we show the relationship between two variable, in x- axis we take
times in days, it is independent and in Y-axis stock Prices in U.S. dollars, it is dependent
variable. The scatter plot shows that it is linear. The highest stock price shows the positive
relationship with time 2018. The stock price is maximum at last week of August 2018. It
shows a moderately strong relationship. There is no significant increase value and it is drop
down more than 3 time around the year.
Paraphrase This Document
Need a fresh take? Get an instant paraphrase of this document with our AI Paraphraser
4Running head: Data Analytics And Business Intelligence on Amazon
0
500
1000
1500
2000
2500
Scatter Plots on Lowest stock Price
Times in Days
Stock Prices in U.S. Dollars
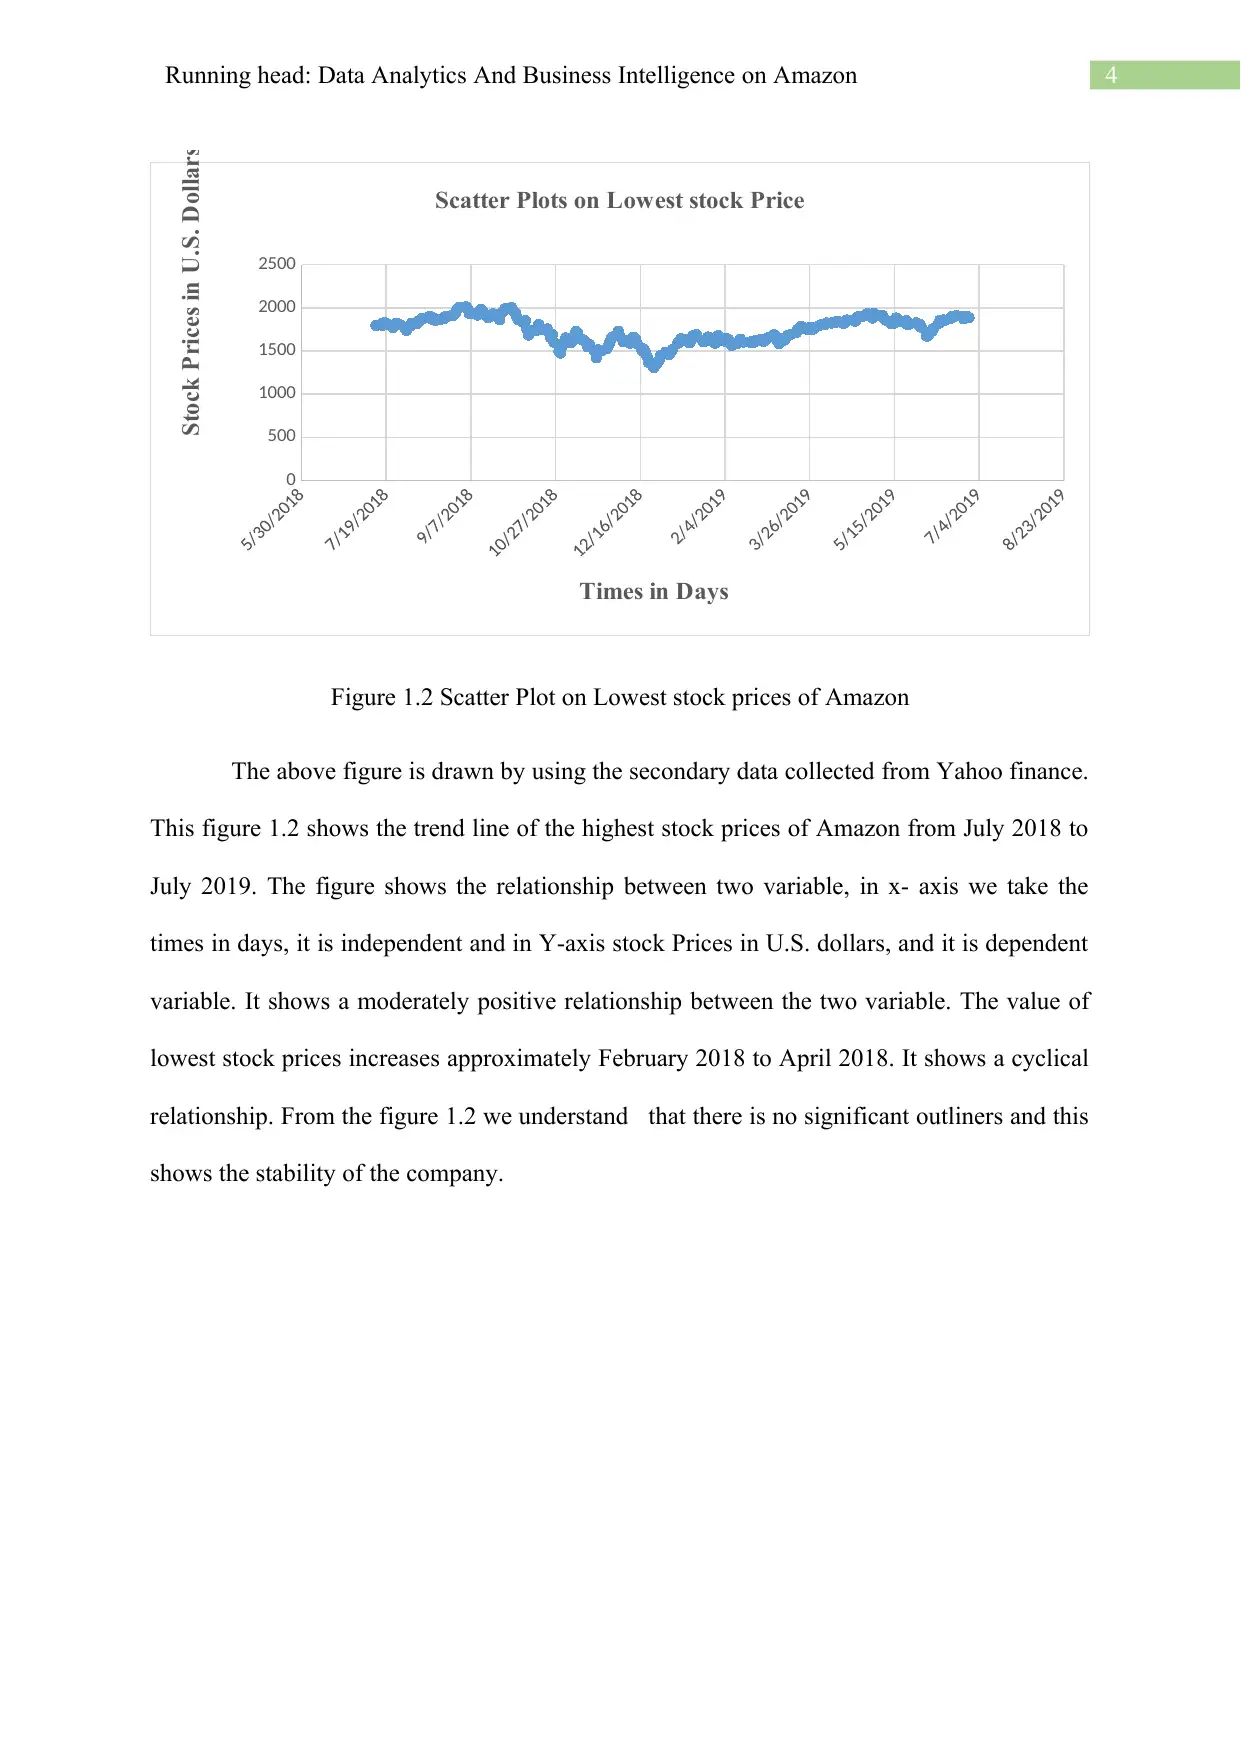
Figure 1.2 Scatter Plot on Lowest stock prices of Amazon
The above figure is drawn by using the secondary data collected from Yahoo finance.
This figure 1.2 shows the trend line of the highest stock prices of Amazon from July 2018 to
July 2019. The figure shows the relationship between two variable, in x- axis we take the
times in days, it is independent and in Y-axis stock Prices in U.S. dollars, and it is dependent
variable. It shows a moderately positive relationship between the two variable. The value of
lowest stock prices increases approximately February 2018 to April 2018. It shows a cyclical
relationship. From the figure 1.2 we understand that there is no significant outliners and this
shows the stability of the company.
0
500
1000
1500
2000
2500
Scatter Plots on Lowest stock Price
Times in Days
Stock Prices in U.S. Dollars
Figure 1.2 Scatter Plot on Lowest stock prices of Amazon
The above figure is drawn by using the secondary data collected from Yahoo finance.
This figure 1.2 shows the trend line of the highest stock prices of Amazon from July 2018 to
July 2019. The figure shows the relationship between two variable, in x- axis we take the
times in days, it is independent and in Y-axis stock Prices in U.S. dollars, and it is dependent
variable. It shows a moderately positive relationship between the two variable. The value of
lowest stock prices increases approximately February 2018 to April 2018. It shows a cyclical
relationship. From the figure 1.2 we understand that there is no significant outliners and this
shows the stability of the company.
5Running head: Data Analytics And Business Intelligence on Amazon
less than
1400 1400-
1500 1500-
1600 1600-
1700 1700-
1800 1800-
1900 1900-
2000 2000-
2100
0
10
20
30
40
50
60
70
80
Histogram
Range of Adjusted closing Stock Prices
Number of Occurences
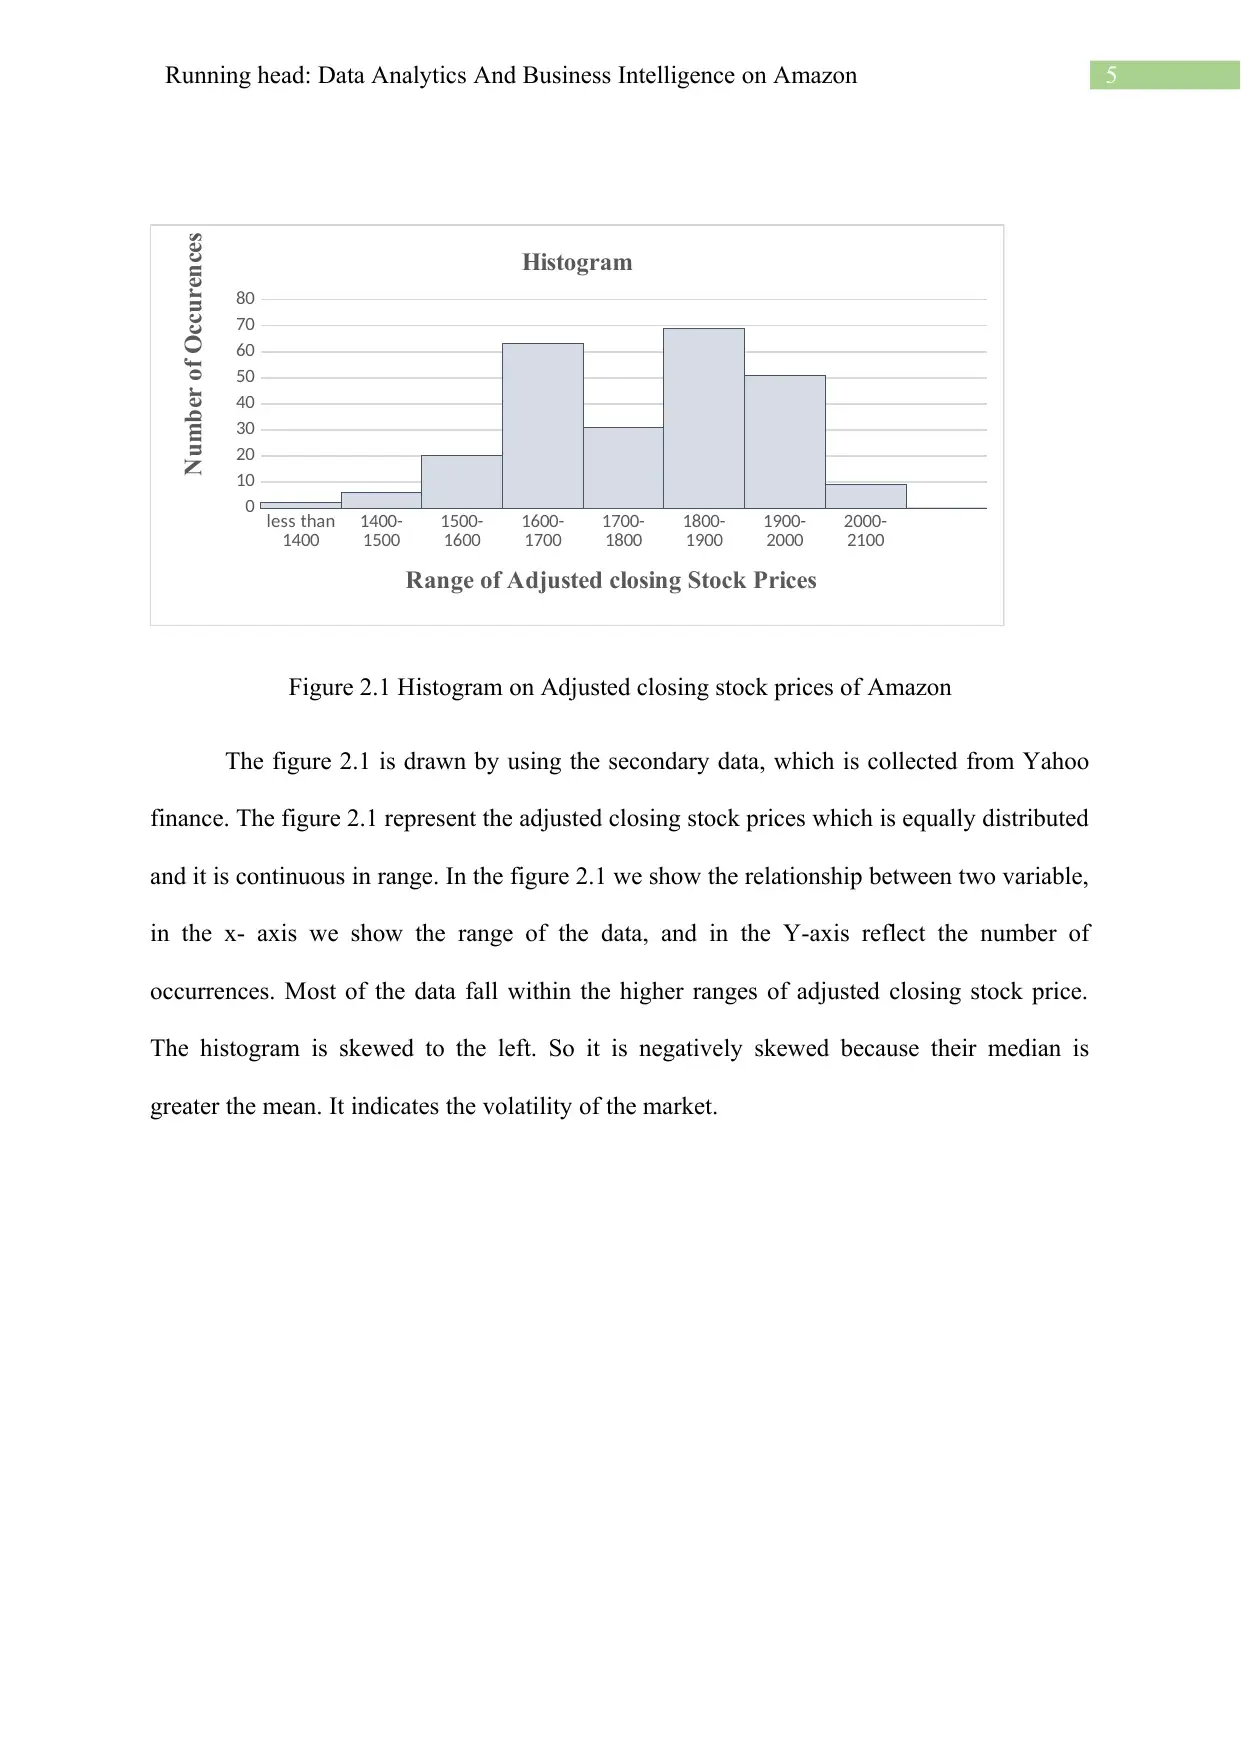
Figure 2.1 Histogram on Adjusted closing stock prices of Amazon
The figure 2.1 is drawn by using the secondary data, which is collected from Yahoo
finance. The figure 2.1 represent the adjusted closing stock prices which is equally distributed
and it is continuous in range. In the figure 2.1 we show the relationship between two variable,
in the x- axis we show the range of the data, and in the Y-axis reflect the number of
occurrences. Most of the data fall within the higher ranges of adjusted closing stock price.
The histogram is skewed to the left. So it is negatively skewed because their median is
greater the mean. It indicates the volatility of the market.
less than
1400 1400-
1500 1500-
1600 1600-
1700 1700-
1800 1800-
1900 1900-
2000 2000-
2100
0
10
20
30
40
50
60
70
80
Histogram
Range of Adjusted closing Stock Prices
Number of Occurences
Figure 2.1 Histogram on Adjusted closing stock prices of Amazon
The figure 2.1 is drawn by using the secondary data, which is collected from Yahoo
finance. The figure 2.1 represent the adjusted closing stock prices which is equally distributed
and it is continuous in range. In the figure 2.1 we show the relationship between two variable,
in the x- axis we show the range of the data, and in the Y-axis reflect the number of
occurrences. Most of the data fall within the higher ranges of adjusted closing stock price.
The histogram is skewed to the left. So it is negatively skewed because their median is
greater the mean. It indicates the volatility of the market.
⊘ This is a preview!⊘
Do you want full access?
Subscribe today to unlock all pages.
Trusted by 1+ million students worldwide
6Running head: Data Analytics And Business Intelligence on Amazon
less than 2000000
2000000-4000000
4000000-6000000
6000000-8000000
8000000-10000000
10000000-120000000
120000000-14000000
140000000-160000000
0
20
40
60
80
100
Histogram
Range of Stock Trading Volume
Frequency
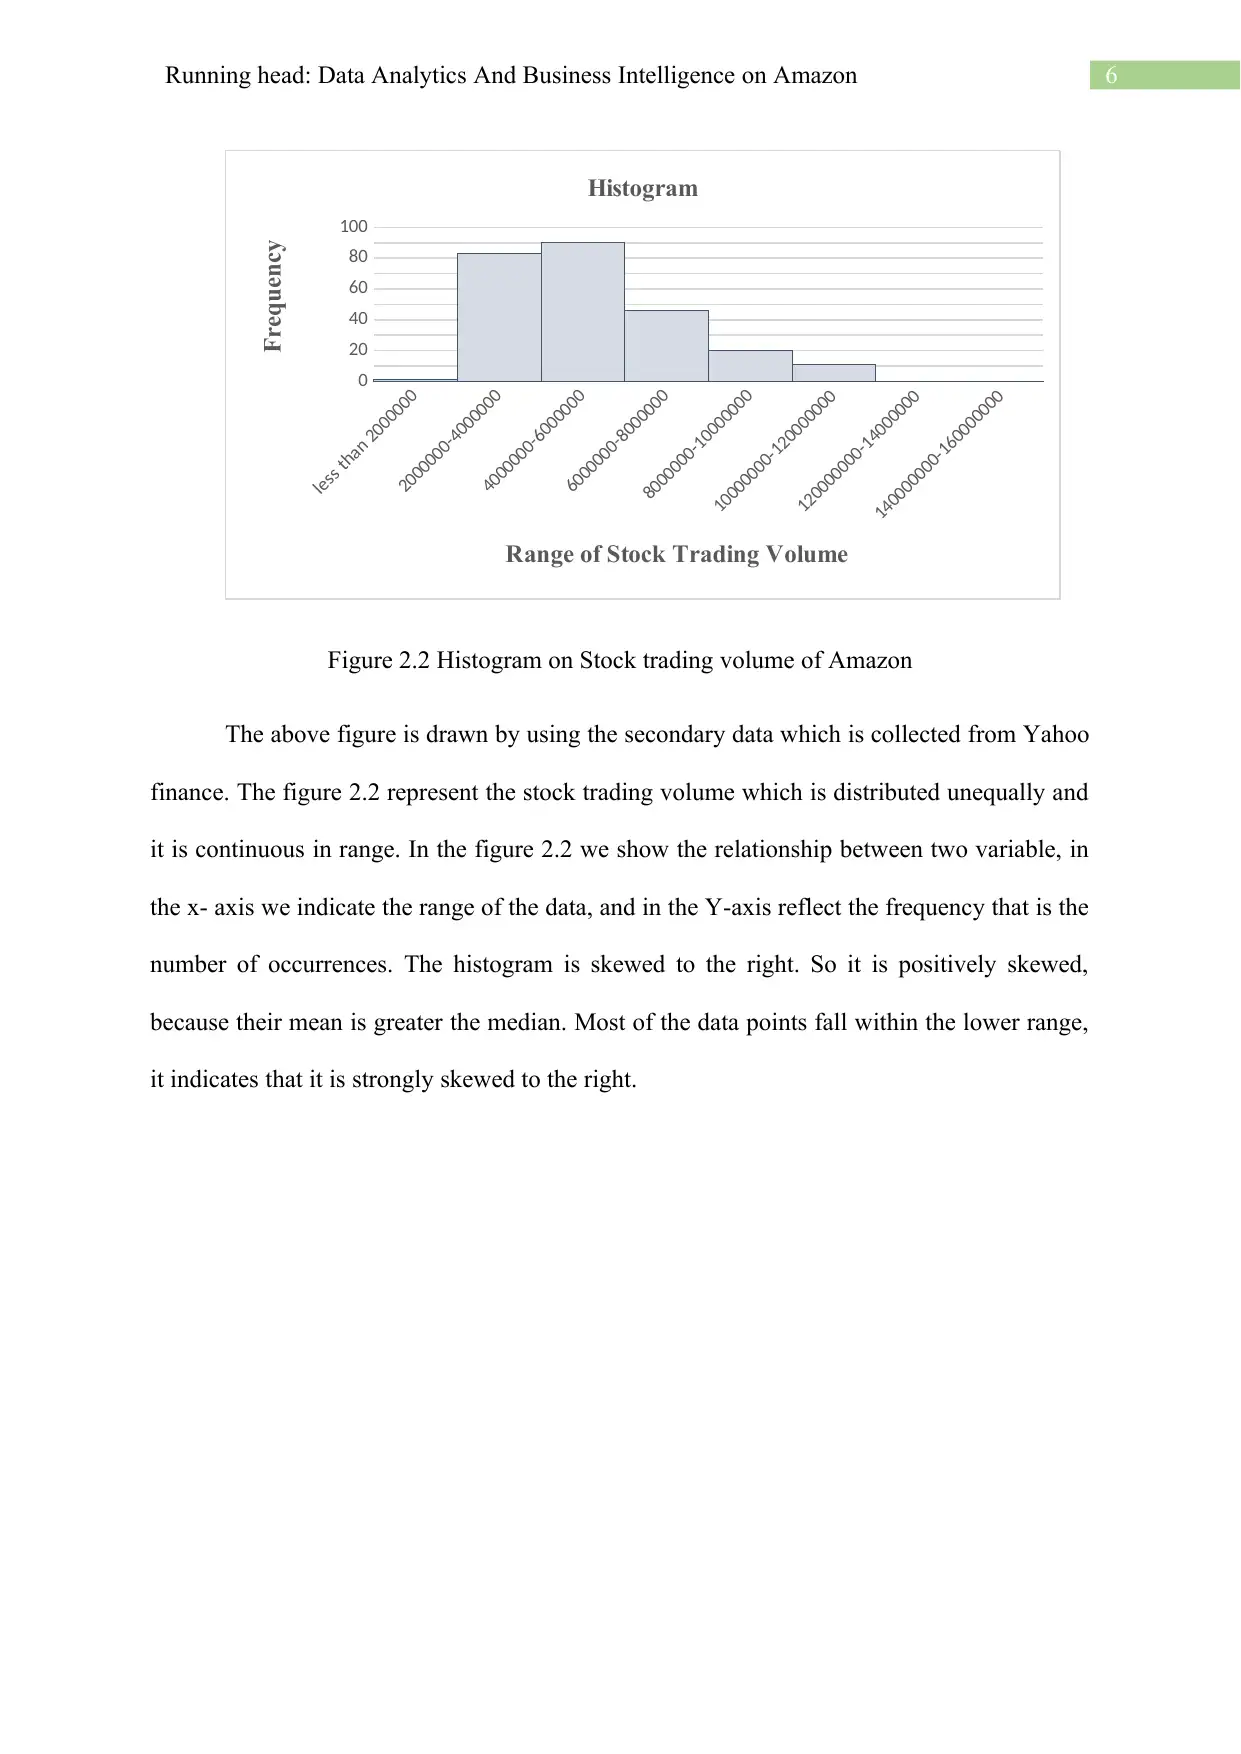
Figure 2.2 Histogram on Stock trading volume of Amazon
The above figure is drawn by using the secondary data which is collected from Yahoo
finance. The figure 2.2 represent the stock trading volume which is distributed unequally and
it is continuous in range. In the figure 2.2 we show the relationship between two variable, in
the x- axis we indicate the range of the data, and in the Y-axis reflect the frequency that is the
number of occurrences. The histogram is skewed to the right. So it is positively skewed,
because their mean is greater the median. Most of the data points fall within the lower range,
it indicates that it is strongly skewed to the right.
less than 2000000
2000000-4000000
4000000-6000000
6000000-8000000
8000000-10000000
10000000-120000000
120000000-14000000
140000000-160000000
0
20
40
60
80
100
Histogram
Range of Stock Trading Volume
Frequency
Figure 2.2 Histogram on Stock trading volume of Amazon
The above figure is drawn by using the secondary data which is collected from Yahoo
finance. The figure 2.2 represent the stock trading volume which is distributed unequally and
it is continuous in range. In the figure 2.2 we show the relationship between two variable, in
the x- axis we indicate the range of the data, and in the Y-axis reflect the frequency that is the
number of occurrences. The histogram is skewed to the right. So it is positively skewed,
because their mean is greater the median. Most of the data points fall within the lower range,
it indicates that it is strongly skewed to the right.
Paraphrase This Document
Need a fresh take? Get an instant paraphrase of this document with our AI Paraphraser
7Running head: Data Analytics And Business Intelligence on Amazon
Chapter 3: Descriptive Statistics
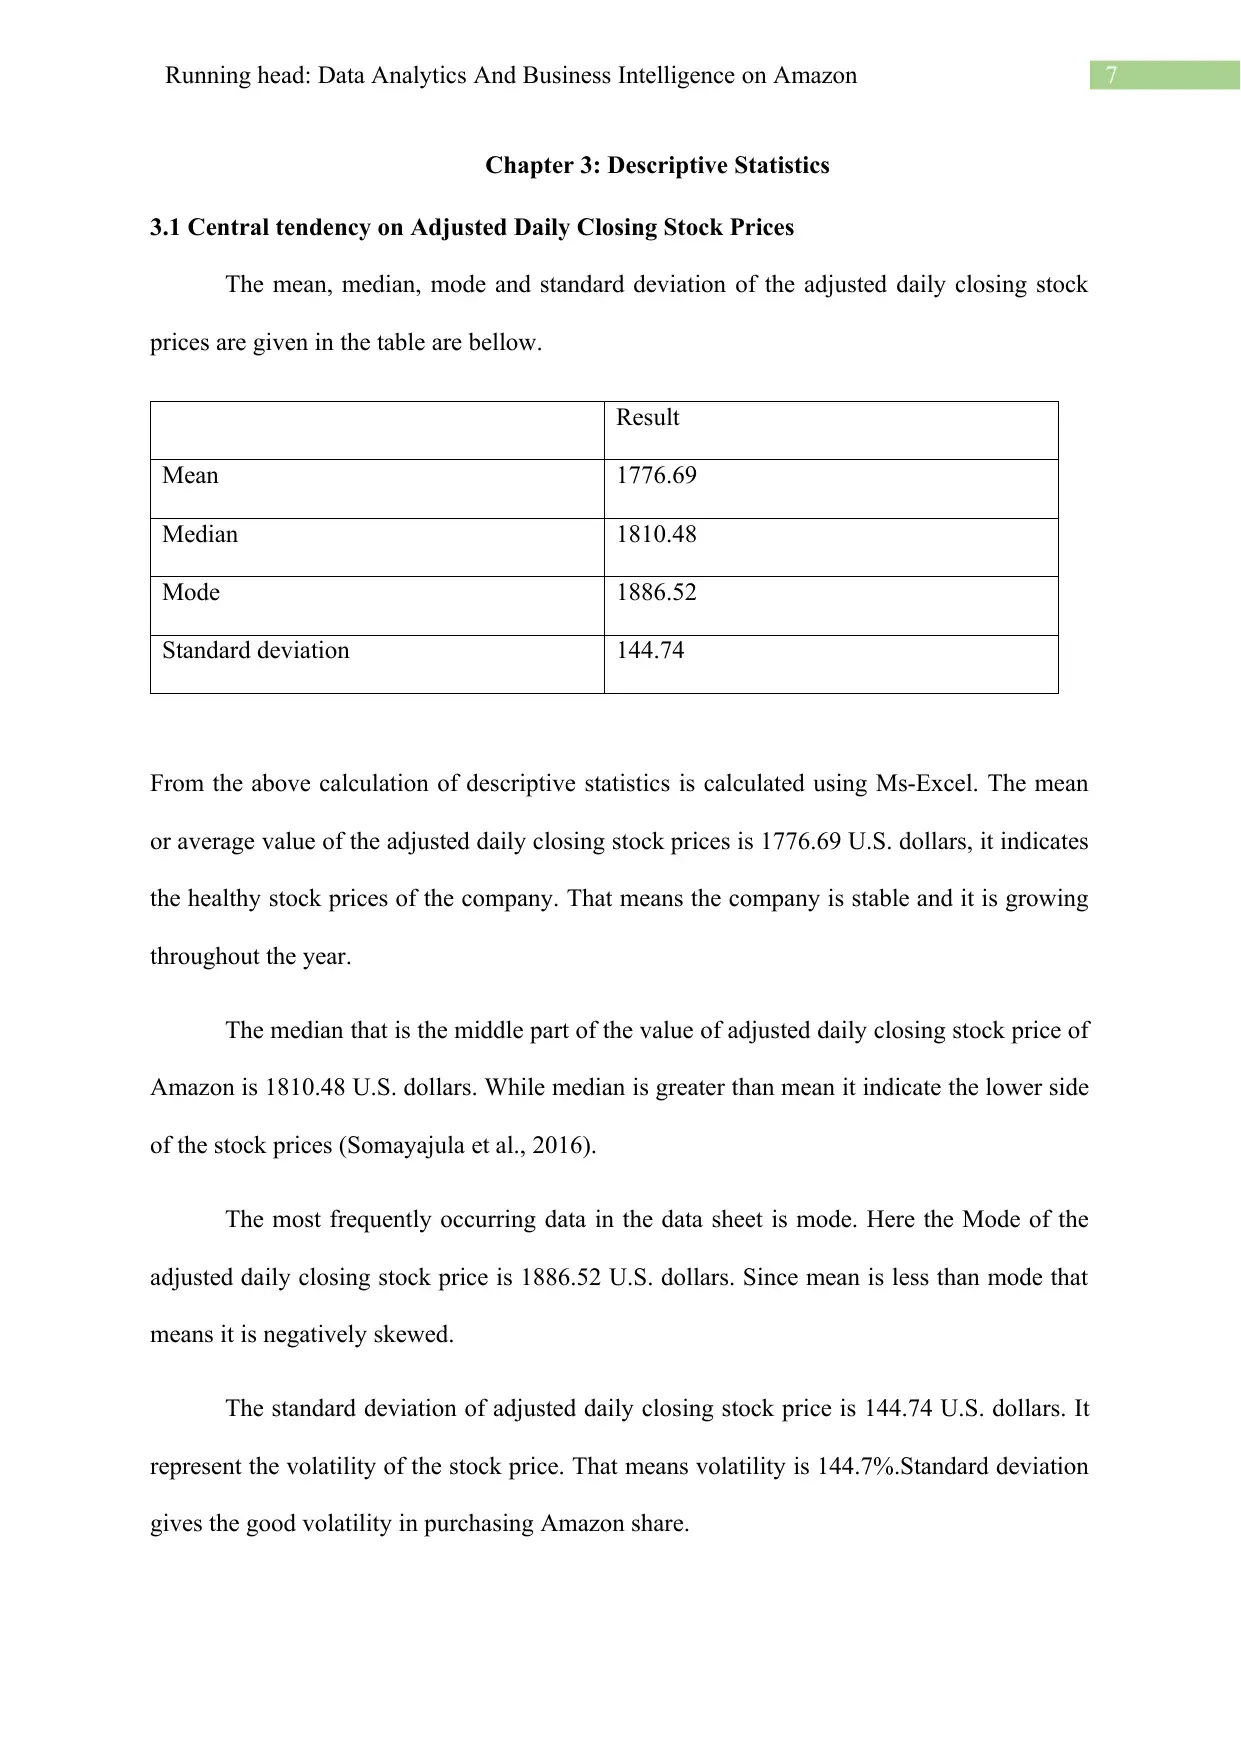
3.1 Central tendency on Adjusted Daily Closing Stock Prices
The mean, median, mode and standard deviation of the adjusted daily closing stock
prices are given in the table are bellow.
Result
Mean 1776.69
Median 1810.48
Mode 1886.52
Standard deviation 144.74
From the above calculation of descriptive statistics is calculated using Ms-Excel. The mean
or average value of the adjusted daily closing stock prices is 1776.69 U.S. dollars, it indicates
the healthy stock prices of the company. That means the company is stable and it is growing
throughout the year.
The median that is the middle part of the value of adjusted daily closing stock price of
Amazon is 1810.48 U.S. dollars. While median is greater than mean it indicate the lower side
of the stock prices (Somayajula et al., 2016).
The most frequently occurring data in the data sheet is mode. Here the Mode of the
adjusted daily closing stock price is 1886.52 U.S. dollars. Since mean is less than mode that
means it is negatively skewed.
The standard deviation of adjusted daily closing stock price is 144.74 U.S. dollars. It
represent the volatility of the stock price. That means volatility is 144.7%.Standard deviation
gives the good volatility in purchasing Amazon share.
Chapter 3: Descriptive Statistics
3.1 Central tendency on Adjusted Daily Closing Stock Prices
The mean, median, mode and standard deviation of the adjusted daily closing stock
prices are given in the table are bellow.
Result
Mean 1776.69
Median 1810.48
Mode 1886.52
Standard deviation 144.74
From the above calculation of descriptive statistics is calculated using Ms-Excel. The mean
or average value of the adjusted daily closing stock prices is 1776.69 U.S. dollars, it indicates
the healthy stock prices of the company. That means the company is stable and it is growing
throughout the year.
The median that is the middle part of the value of adjusted daily closing stock price of
Amazon is 1810.48 U.S. dollars. While median is greater than mean it indicate the lower side
of the stock prices (Somayajula et al., 2016).
The most frequently occurring data in the data sheet is mode. Here the Mode of the
adjusted daily closing stock price is 1886.52 U.S. dollars. Since mean is less than mode that
means it is negatively skewed.
The standard deviation of adjusted daily closing stock price is 144.74 U.S. dollars. It
represent the volatility of the stock price. That means volatility is 144.7%.Standard deviation
gives the good volatility in purchasing Amazon share.
8Running head: Data Analytics And Business Intelligence on Amazon
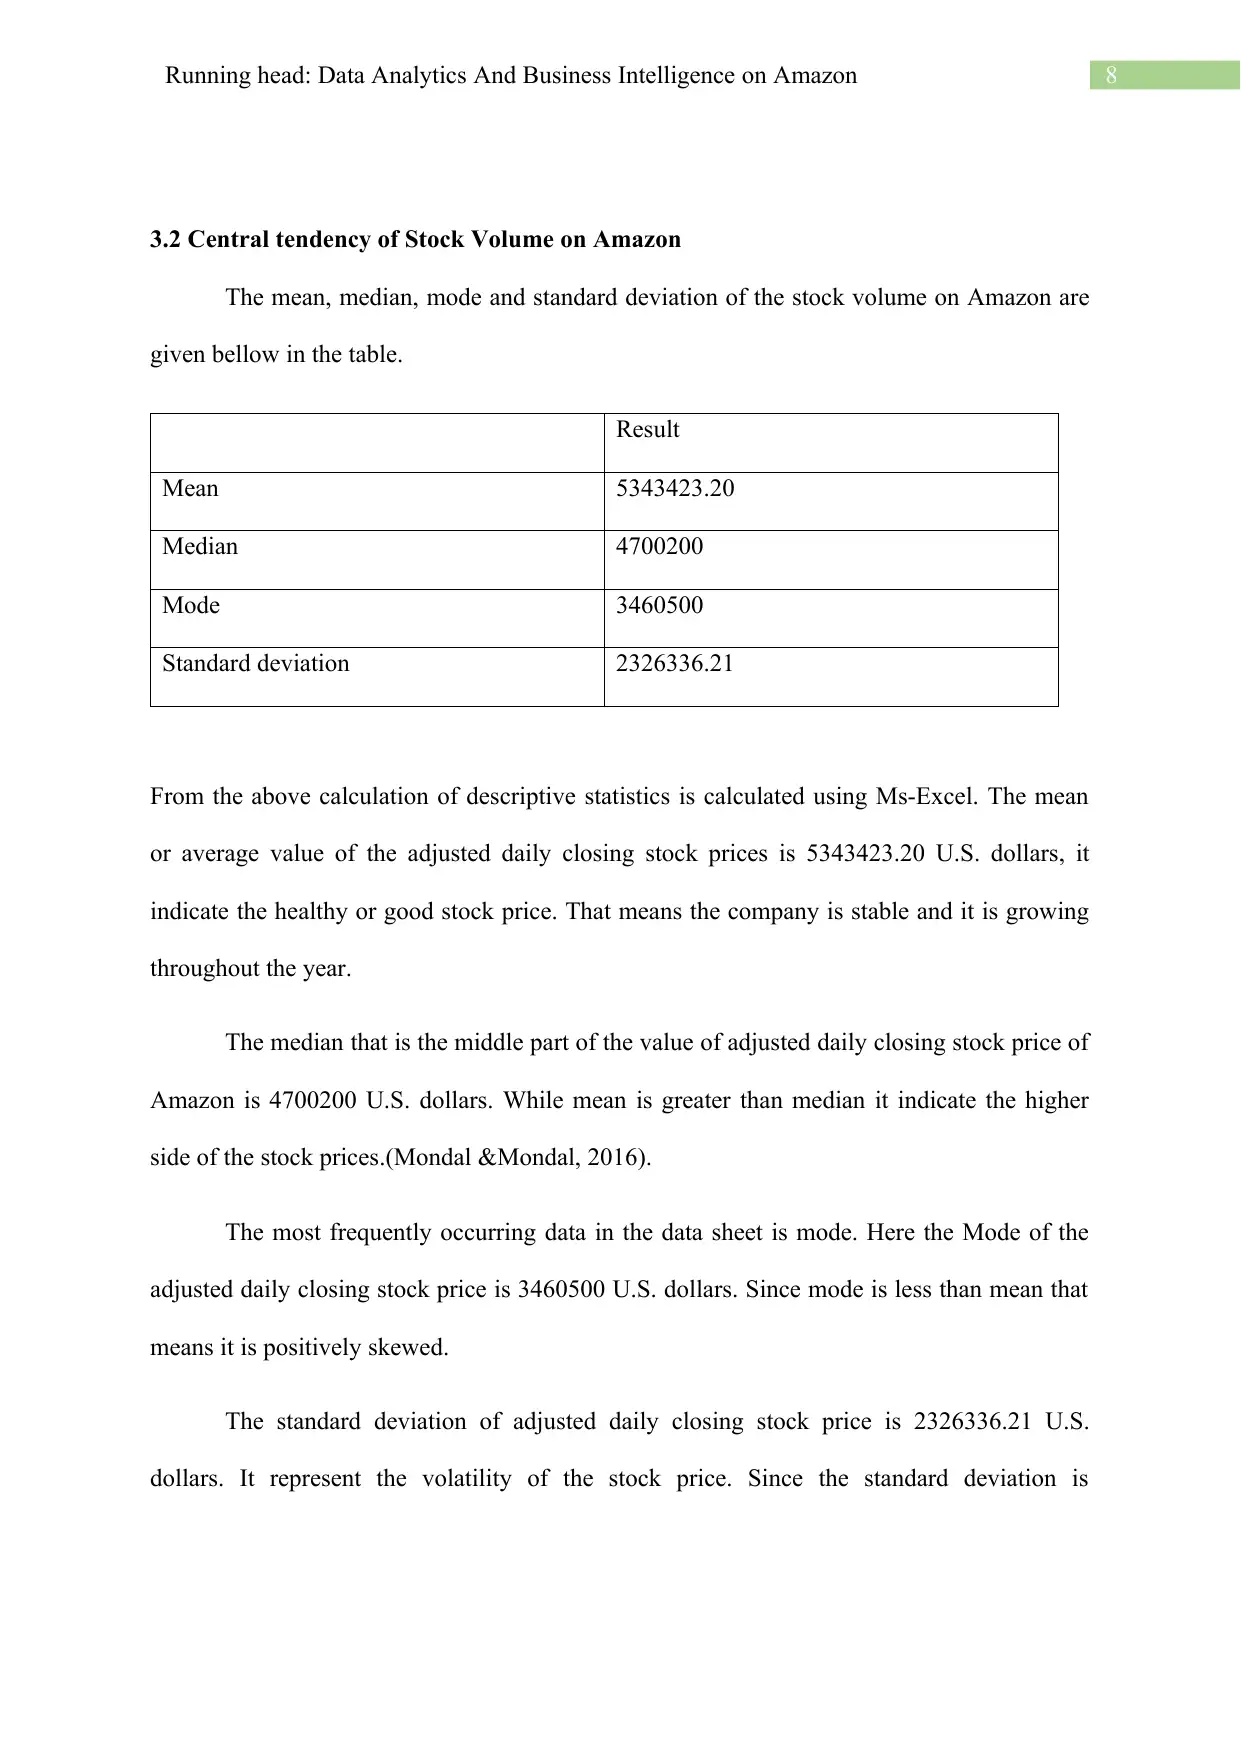
3.2 Central tendency of Stock Volume on Amazon
The mean, median, mode and standard deviation of the stock volume on Amazon are
given bellow in the table.
Result
Mean 5343423.20
Median 4700200
Mode 3460500
Standard deviation 2326336.21
From the above calculation of descriptive statistics is calculated using Ms-Excel. The mean
or average value of the adjusted daily closing stock prices is 5343423.20 U.S. dollars, it
indicate the healthy or good stock price. That means the company is stable and it is growing
throughout the year.
The median that is the middle part of the value of adjusted daily closing stock price of
Amazon is 4700200 U.S. dollars. While mean is greater than median it indicate the higher
side of the stock prices.(Mondal &Mondal, 2016).
The most frequently occurring data in the data sheet is mode. Here the Mode of the
adjusted daily closing stock price is 3460500 U.S. dollars. Since mode is less than mean that
means it is positively skewed.
The standard deviation of adjusted daily closing stock price is 2326336.21 U.S.
dollars. It represent the volatility of the stock price. Since the standard deviation is
⊘ This is a preview!⊘
Do you want full access?
Subscribe today to unlock all pages.
Trusted by 1+ million students worldwide

9Running head: Data Analytics And Business Intelligence on Amazon
2326336.2, it indicate high volatility in the data set. Which shows lack of consistency in the
volume of Amazon.
2326336.2, it indicate high volatility in the data set. Which shows lack of consistency in the
volume of Amazon.
Paraphrase This Document
Need a fresh take? Get an instant paraphrase of this document with our AI Paraphraser
10Running head: Data Analytics And Business Intelligence on Amazon
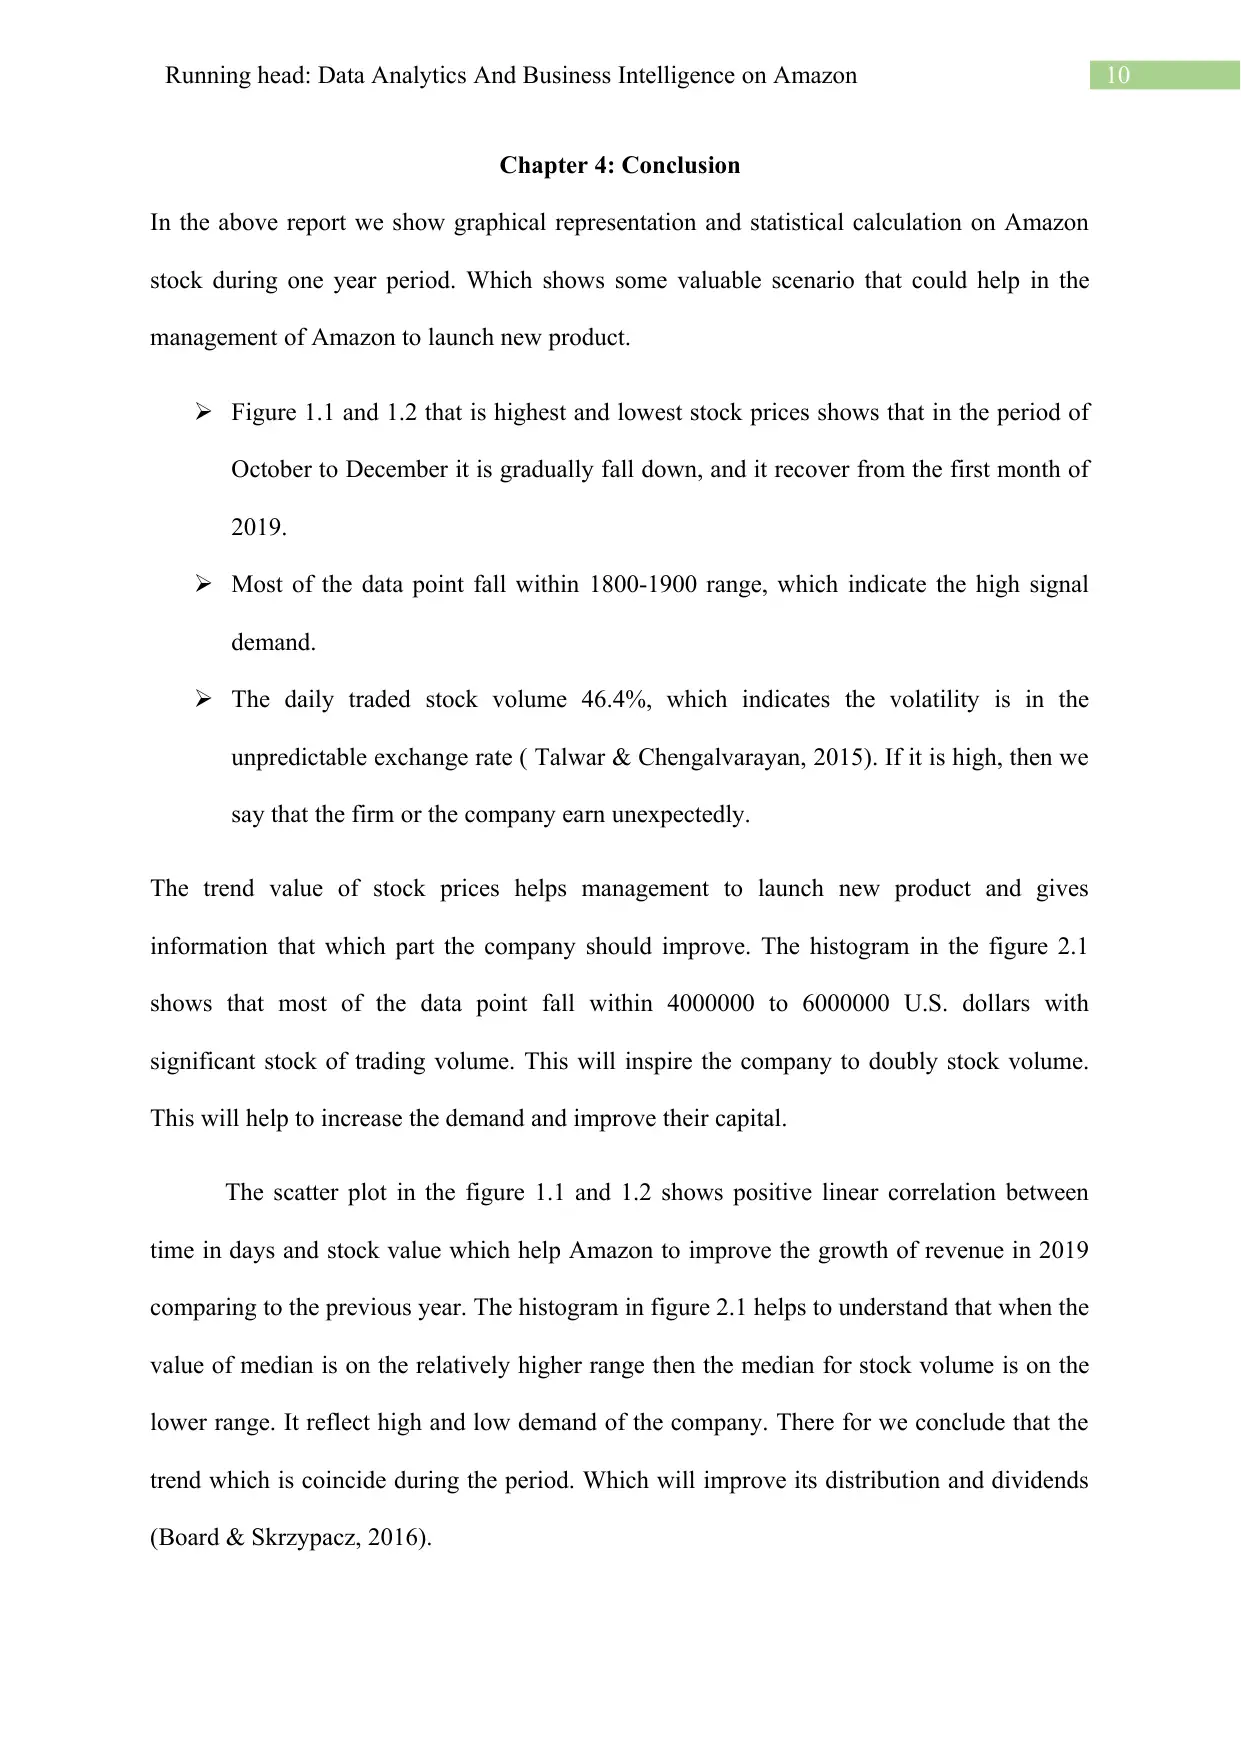
Chapter 4: Conclusion
In the above report we show graphical representation and statistical calculation on Amazon
stock during one year period. Which shows some valuable scenario that could help in the
management of Amazon to launch new product.
Figure 1.1 and 1.2 that is highest and lowest stock prices shows that in the period of
October to December it is gradually fall down, and it recover from the first month of
2019.
Most of the data point fall within 1800-1900 range, which indicate the high signal
demand.
The daily traded stock volume 46.4%, which indicates the volatility is in the
unpredictable exchange rate ( Talwar & Chengalvarayan, 2015). If it is high, then we
say that the firm or the company earn unexpectedly.
The trend value of stock prices helps management to launch new product and gives
information that which part the company should improve. The histogram in the figure 2.1
shows that most of the data point fall within 4000000 to 6000000 U.S. dollars with
significant stock of trading volume. This will inspire the company to doubly stock volume.
This will help to increase the demand and improve their capital.
The scatter plot in the figure 1.1 and 1.2 shows positive linear correlation between
time in days and stock value which help Amazon to improve the growth of revenue in 2019
comparing to the previous year. The histogram in figure 2.1 helps to understand that when the
value of median is on the relatively higher range then the median for stock volume is on the
lower range. It reflect high and low demand of the company. There for we conclude that the
trend which is coincide during the period. Which will improve its distribution and dividends
(Board & Skrzypacz, 2016).
11Running head: Data Analytics And Business Intelligence on Amazon
Chapter 5: References
Board, S., & Skrzypacz, A. (2016). Revenue management with forward-looking buyers.
Journal of Political Economy, 124(4), 1046-1087.
Chaudhary, K., & Kumar, S. (2016). Customer Satisfaction towards Flipkart and Amazon: A
Comparative Study. International Journal of Academic Research & Development
JAR&D, 35.
Cooke, D. G., Blackwell, L. F., & Brown, S. (2016). A graphical trap for unwary users of
Excel 2010. International Journal of Open Information Technologies, 4(2).
https://www.Finance. Yahoo.com
https://www.investopedia.com/terms/s/skewness.asp
https://www.marketwatch.com/investing/stock/amzn
Jacaruso, L. C. (2018). A method of trend forecasting for financial and geopolitical data:
inferring the effects of unknown exogenous variables. Journal of Big Data, 5(1), 47.
Kantor, J., & Streitfeld, D. (2015). Inside Amazon: Wrestling big ideas in a bruising
workplace. New York Times, 15, 74-80.
Lincoln, I. V., & Andrew, C. E. (2018). Porter Analysis: A Business Strategy of Amazon.
Com Through a Value Chain and Comparative Advantage Analysis of Amazon’s
Trademarks and Intangibles. Com Through a Value Chain and Comparative
Advantage Analysis of Amazon’s Trademarks and Intangibles (November 27, 2018).
Practical Guide to US Transfer Pricing.
Mondal, H., & Mondal, S. (2016). Sample size calculation to data analysis of a correlation
study in Microsoft Excel®: A hands-on guide with example. International Journal of
Clinical and Experimental Physiology, 3(4), 180-189
Murninghan, M. (2018). Equity Culture and Decent Work: The Case of Amazon (2017). New
England Journal of Public Policy, 30(1), 11.
Somayajula, S. R. K., Liu, C., Kiraly, K. P., Gopalakrishnan, V., Desai, J. P., & Narasimhan,
S. (2015). U.S. Patent No. 9,020,479. Washington, DC: U.S. Patent and Trademark
Office.
⊘ This is a preview!⊘
Do you want full access?
Subscribe today to unlock all pages.
Trusted by 1+ million students worldwide
1 out of 13


Your All-in-One AI-Powered Toolkit for Academic Success.
+13062052269
info@desklib.com
Available 24*7 on WhatsApp / Email
![[object Object]](/_next/static/media/star-bottom.7253800d.svg)
Unlock your academic potential
Copyright © 2020–2026 A2Z Services. All Rights Reserved. Developed and managed by ZUCOL.