eCommerce Data Analytics: Profit Analysis Case Study
VerifiedAdded on 2021/06/18
|19
|3900
|122
Case Study
AI Summary
This case study analyzes an eCommerce business's data, focusing on profitability and customer behavior. The analysis includes data from 1180 clothing items, examining variables such as product price, sales price, profit, customer numbers, shipping type, customer type, region, material, and color. The study reveals an overall profit margin of 7.95%, with regional variations. Statistical methods like chi-squared tests, t-tests, and ANOVA are used to assess associations, compare means, and identify significant differences. Key findings include associations between shipping type and material, and customer type and material. The study highlights that free shipping and wool material products are preferred by customers. Correlation and regression analyses reveal positive relationships between product price and customer numbers, and the impact of customer numbers on profit. The study concludes with recommendations for the company based on the analysis.
Data Analytics: A Business Case Study
Executive Summary
Recently, eCommerce captured the attention of whole world. Online shopping is one
of the main part of eCommerce. As the eCommerce business increased exponentially it brings
new challenges to the service provider. Business competition and customer satisfaction are
the important challenges for service provider.
Service provider used the different tools, techniques and strategies to attract the
customers. Business is all about the attraction, quality and service provided by the service
provider. We have data of 1180 Cloths (Jacket, Jeans and Suit). We considered the following
attributes / variables as Product Name, Product Price (in $), Sale Price (in $), Profit (in $),
Number of customers who bought the product, Shipping Type (Free or Paid), Customer Type
(New or Existing), Region (QLD, WA, VIC, TAS, SA), Product Material (Wool and Cotton)
and Product Colour (Black, Blue, Pink, Red and White).
We observed that company gaining about 7.95% profit overall. We can observed that
there is no comparative difference in the different attributes. In the region, WA region giving
the most profit percentage as 8.23% and QLD region generate 7.75% lowest among the all-
region. We observed that averagely there is 11.81 customer for each products with standard
deviation 3.82.
We observed that only shipping type and material have significant association at 5%
level of significance and customer type and material have significant association at 10% level
of significance whereas all other pairs are not associated. Average new customers are more
than the existing customers. Mean number of customers for the products which are shipped
freely is significantly more than products which has paid shipping. We can say that wool
1
Paraphrase This Document
Need a fresh take? Get an instant paraphrase of this document with our AI Paraphraser
material products are more preferred than cotton as the number of customers for wool
material products are significantly more than cotton material product. We conclude that there
is significant difference between mean numbers of customers in different region and there is
no significant differences between mean numbers of customers according to colour. We can
see that QLD has most number of customer compared to the other region.
From the correlation analysis, we can say that product price and number of customer
are positively related with each other. Number of customers is negatively correlated with
profit and product price. Regression analysis suggest that there is significant relation between
total profit and number of customers. We also observed R2 as 0.74 which suggest that fitting
is good. Slope of number of customers suggest that every customer gives on an average
$2.3592 profit to the company. We have also given recommendation from the analysis and
plan for it.
2
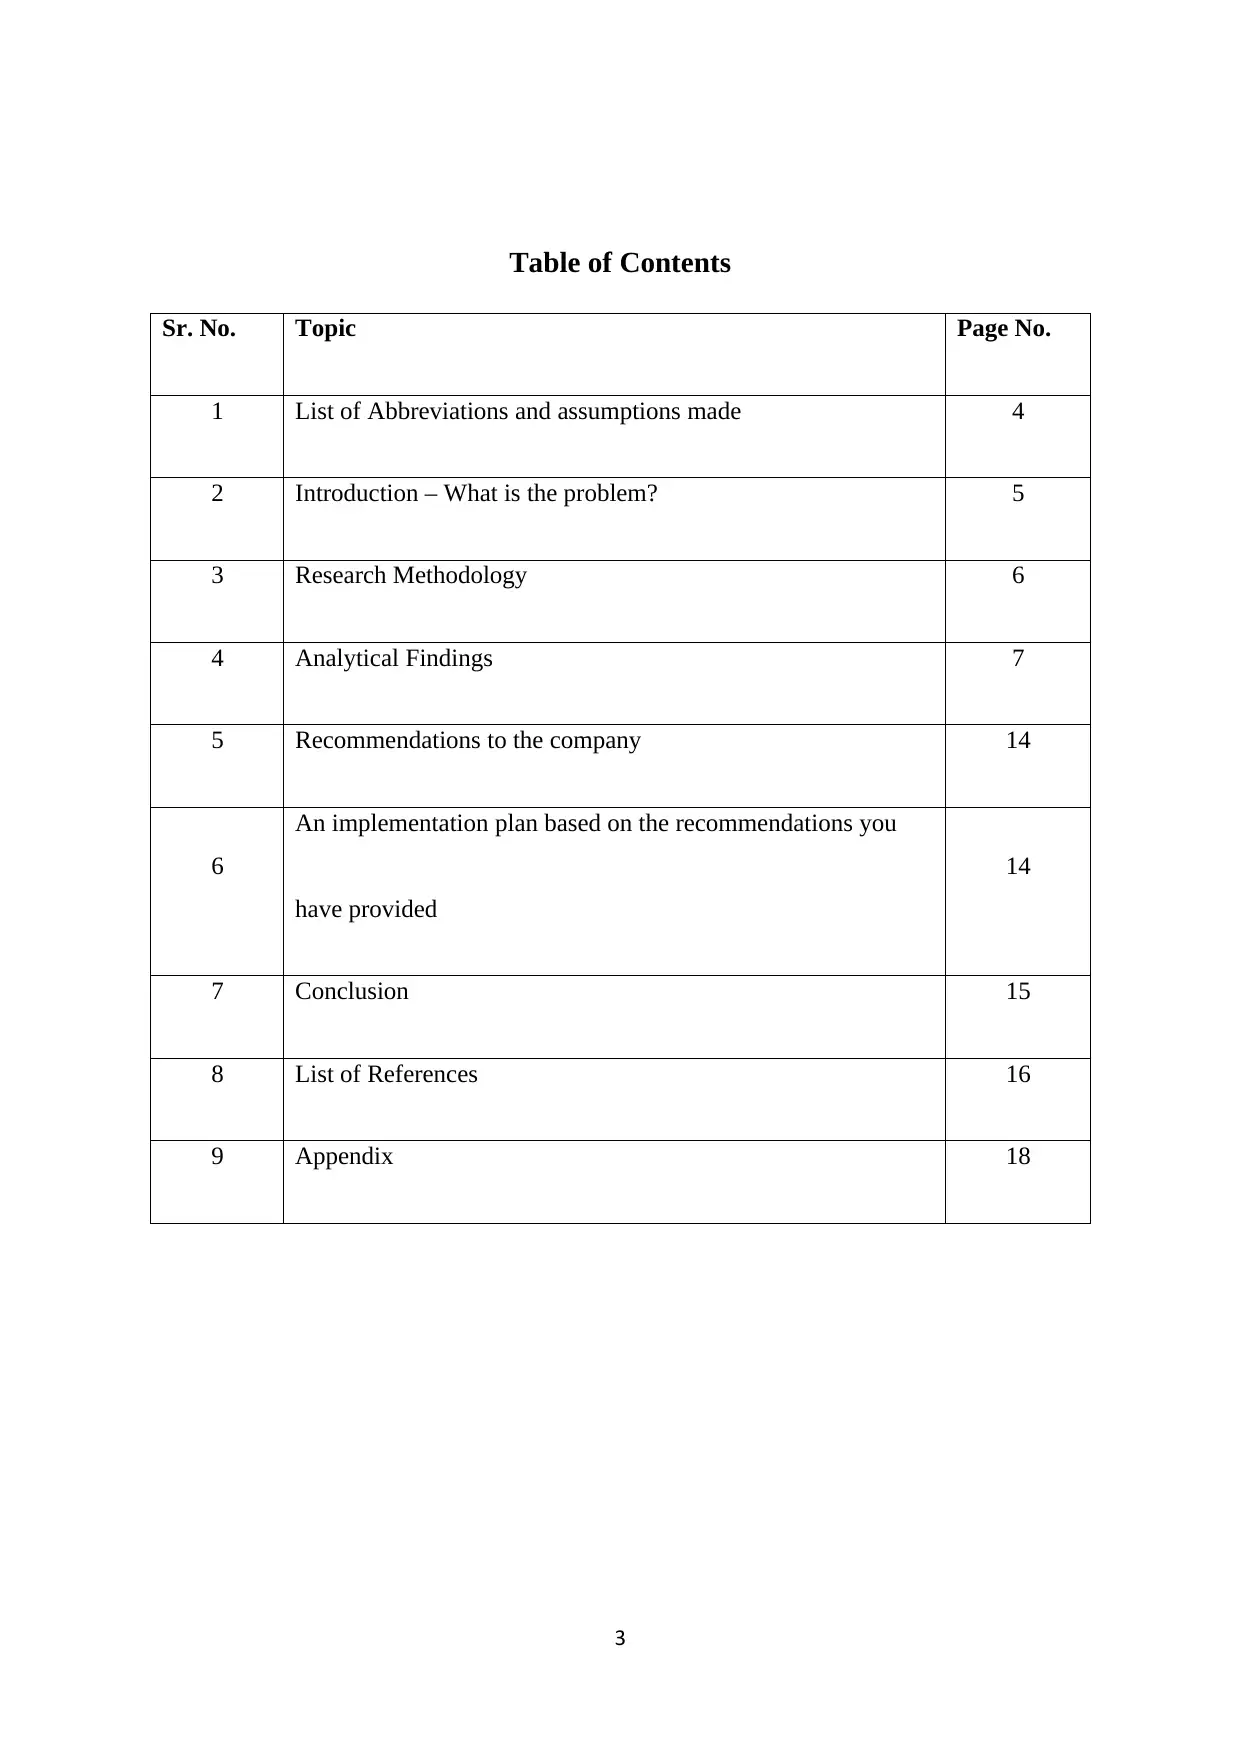
Table of Contents
Sr. No. Topic Page No.
1 List of Abbreviations and assumptions made 4
2 Introduction – What is the problem? 5
3 Research Methodology 6
4 Analytical Findings 7
5 Recommendations to the company 14
6
An implementation plan based on the recommendations you
have provided
14
7 Conclusion 15
8 List of References 16
9 Appendix 18
3
⊘ This is a preview!⊘
Do you want full access?
Subscribe today to unlock all pages.
Trusted by 1+ million students worldwide
List of Abbreviations and assumptions made
Max : Maximum
Min : Minimum
NSW : New South Wales
QLD : Queensland
SA : South Australia
TAS : Tasmania
VIC : Victoria
WA : Western Australia
4
Max : Maximum
Min : Minimum
NSW : New South Wales
QLD : Queensland
SA : South Australia
TAS : Tasmania
VIC : Victoria
WA : Western Australia
4
Paraphrase This Document
Need a fresh take? Get an instant paraphrase of this document with our AI Paraphraser
Introduction – What is the problem?
Recently, eCommerce captured the attention of whole world. Online shopping is one
of the main part of eCommerce. As the eCommerce business increased exponentially it brings
new challenges to the service provider. Business competition and customer satisfaction are
the important challenges for service provider.
Service provider used the different tools, techniques and strategies to attract the
customers. Business is all about the attraction, quality and service provided by the service
provider.
About Data:
We have data of 1180 Cloths (Jacket, Jeans and Suit). We considered the following
attributes / variables as
i) Product Name
ii) Product Price (in $)
iii) Sale Price (in $)
iv) Profit (in $)
v) Number of customers who bought the product
vi) Shipping Type (Free or Paid)
vii) Customer Type (New or Existing)
viii) Region (QLD, WA, VIC, TAS, SA)
ix) Product Material (Wool and Cotton)
x) Product Colour (Black, Blue, Pink, Red and White)
5
We define following variables for our analysis from the above variables
Total Monthly sale amount (in $) = Sale Price (in $) × Number of customers
Total monthly profit (in $) = Profit (in $) × Number of customers
Project Problem:
We are interested to know the following things
i) Profit analysis by shipping type, customer type, region, material and colour.
ii) Whether there is any association between shipping type, customer type, region,
material and colour.
iii) Whether the number of customers is significantly different shipping type,
customer type, region, material and colour.
iv) Correlation analysis of variables
v) Regression analysis for total monthly sales
Research Methodology
Data analysis is incomplete without use of statistical tools and techniques. Selection
of proper tools and techniques is the important aspect of the analysis. We did the profit
analysis for shipping type, customer type, region, material and colour by summarising the
total sale amount and total profit. We test the association between different attributes
shipping type, customer type, region, material and colour by carrying the chi-squared test for
association. We used two sample t-test and one way ANOVA for testing the mean of number
of customers for shipping type, customer type, region, material and colour. We carried the
correlation analysis for variables product price, profit and number of customers. We used
regression analysis for predicting total sale. We run the python code given in appendix and
formatted output is reported.
6
⊘ This is a preview!⊘
Do you want full access?
Subscribe today to unlock all pages.
Trusted by 1+ million students worldwide
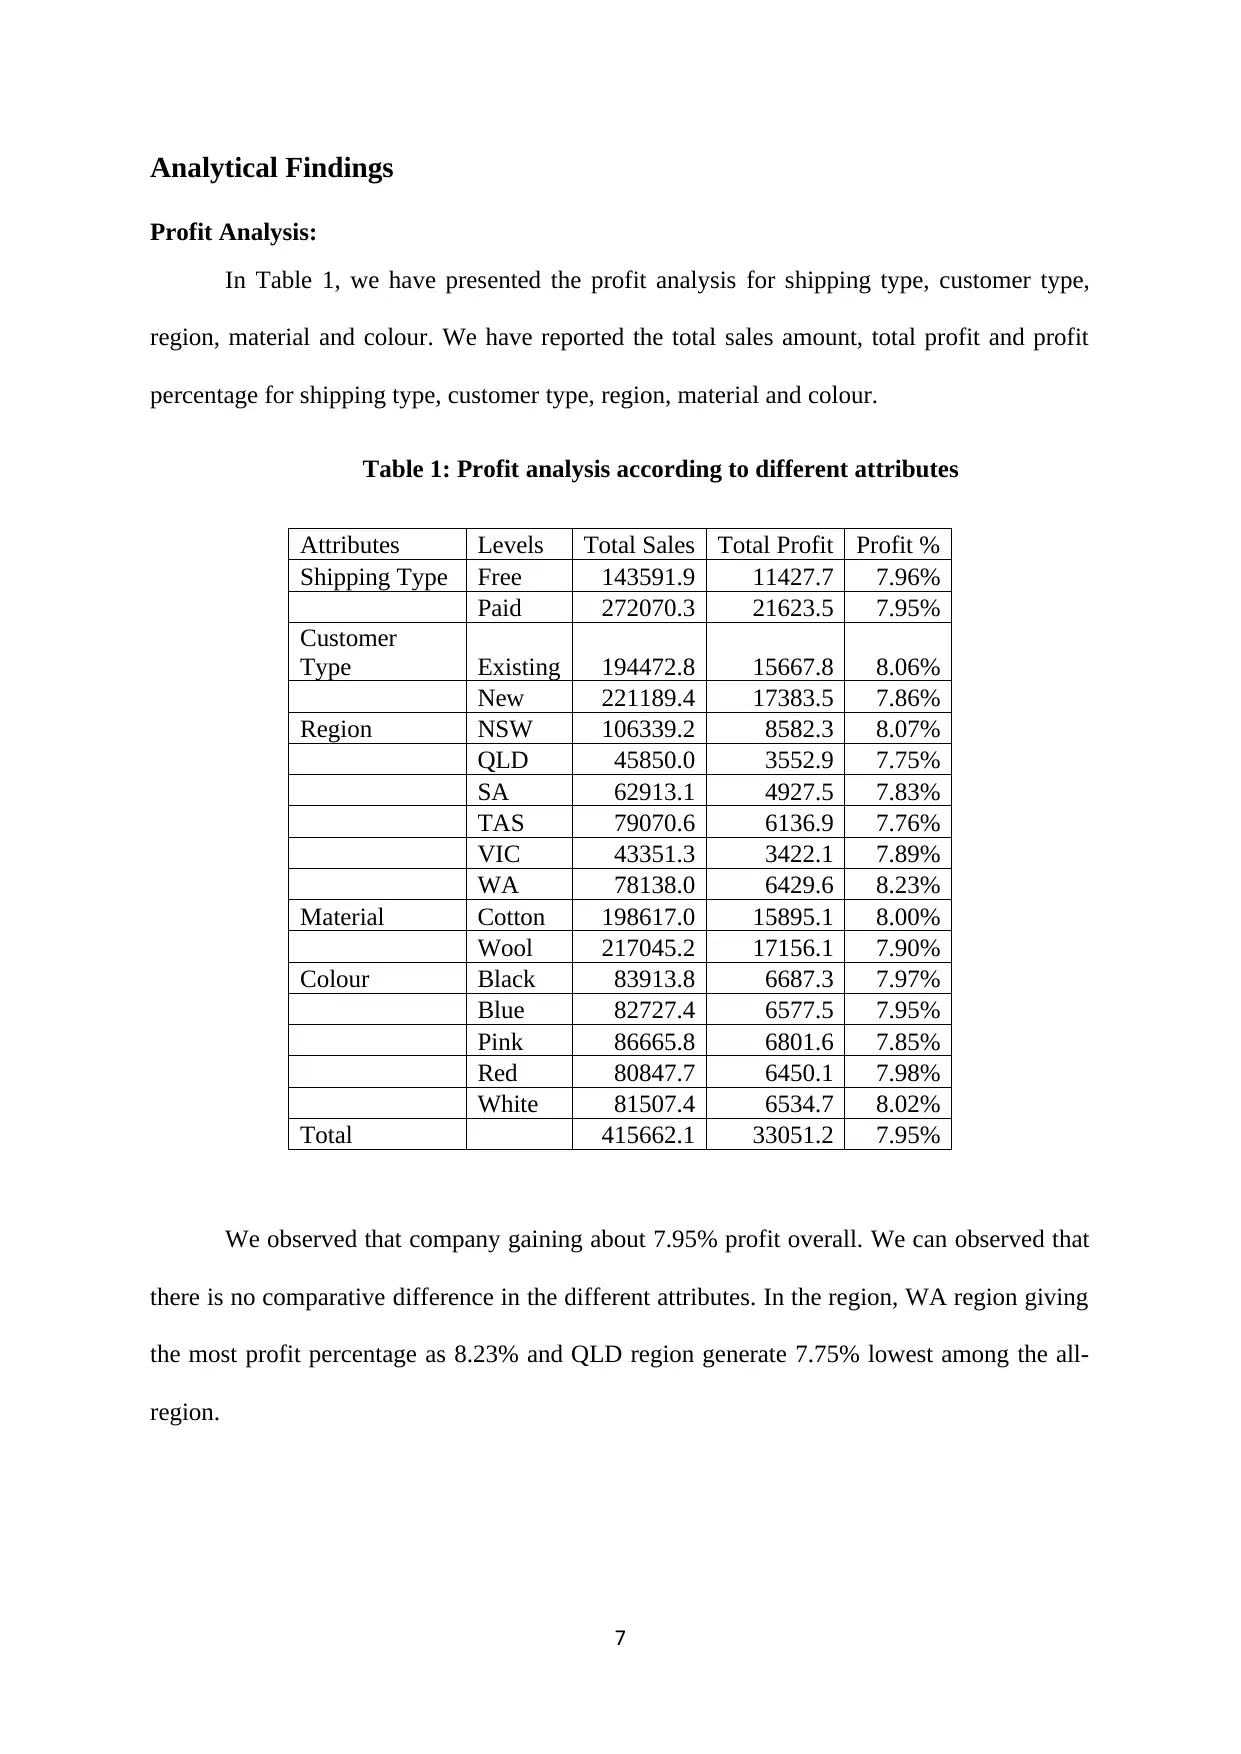
Analytical Findings
Profit Analysis:
In Table 1, we have presented the profit analysis for shipping type, customer type,
region, material and colour. We have reported the total sales amount, total profit and profit
percentage for shipping type, customer type, region, material and colour.
Table 1: Profit analysis according to different attributes
Attributes Levels Total Sales Total Profit Profit %
Shipping Type Free 143591.9 11427.7 7.96%
Paid 272070.3 21623.5 7.95%
Customer
Type Existing 194472.8 15667.8 8.06%
New 221189.4 17383.5 7.86%
Region NSW 106339.2 8582.3 8.07%
QLD 45850.0 3552.9 7.75%
SA 62913.1 4927.5 7.83%
TAS 79070.6 6136.9 7.76%
VIC 43351.3 3422.1 7.89%
WA 78138.0 6429.6 8.23%
Material Cotton 198617.0 15895.1 8.00%
Wool 217045.2 17156.1 7.90%
Colour Black 83913.8 6687.3 7.97%
Blue 82727.4 6577.5 7.95%
Pink 86665.8 6801.6 7.85%
Red 80847.7 6450.1 7.98%
White 81507.4 6534.7 8.02%
Total 415662.1 33051.2 7.95%
We observed that company gaining about 7.95% profit overall. We can observed that
there is no comparative difference in the different attributes. In the region, WA region giving
the most profit percentage as 8.23% and QLD region generate 7.75% lowest among the all-
region.
7
Paraphrase This Document
Need a fresh take? Get an instant paraphrase of this document with our AI Paraphraser
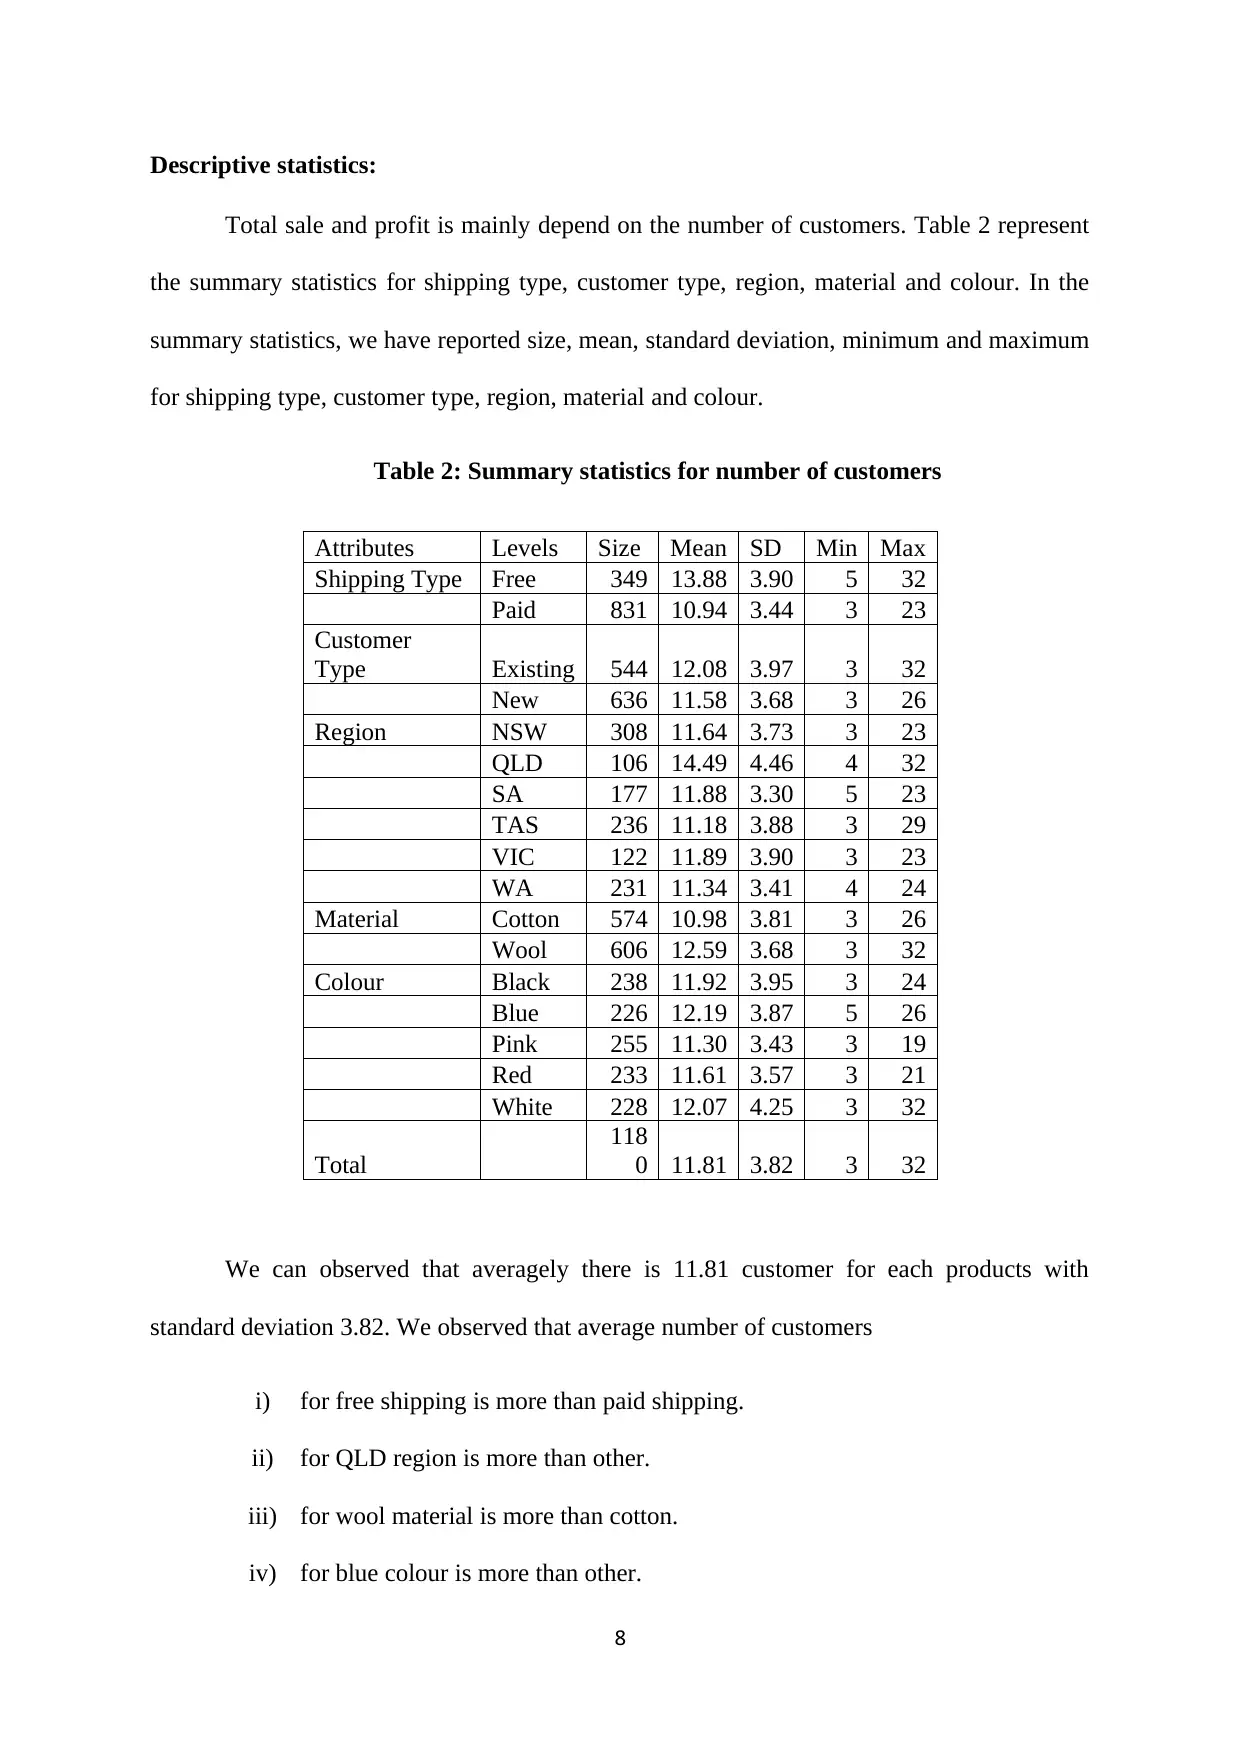
Descriptive statistics:
Total sale and profit is mainly depend on the number of customers. Table 2 represent
the summary statistics for shipping type, customer type, region, material and colour. In the
summary statistics, we have reported size, mean, standard deviation, minimum and maximum
for shipping type, customer type, region, material and colour.
Table 2: Summary statistics for number of customers
Attributes Levels Size Mean SD Min Max
Shipping Type Free 349 13.88 3.90 5 32
Paid 831 10.94 3.44 3 23
Customer
Type Existing 544 12.08 3.97 3 32
New 636 11.58 3.68 3 26
Region NSW 308 11.64 3.73 3 23
QLD 106 14.49 4.46 4 32
SA 177 11.88 3.30 5 23
TAS 236 11.18 3.88 3 29
VIC 122 11.89 3.90 3 23
WA 231 11.34 3.41 4 24
Material Cotton 574 10.98 3.81 3 26
Wool 606 12.59 3.68 3 32
Colour Black 238 11.92 3.95 3 24
Blue 226 12.19 3.87 5 26
Pink 255 11.30 3.43 3 19
Red 233 11.61 3.57 3 21
White 228 12.07 4.25 3 32
Total
118
0 11.81 3.82 3 32
We can observed that averagely there is 11.81 customer for each products with
standard deviation 3.82. We observed that average number of customers
i) for free shipping is more than paid shipping.
ii) for QLD region is more than other.
iii) for wool material is more than cotton.
iv) for blue colour is more than other.
8
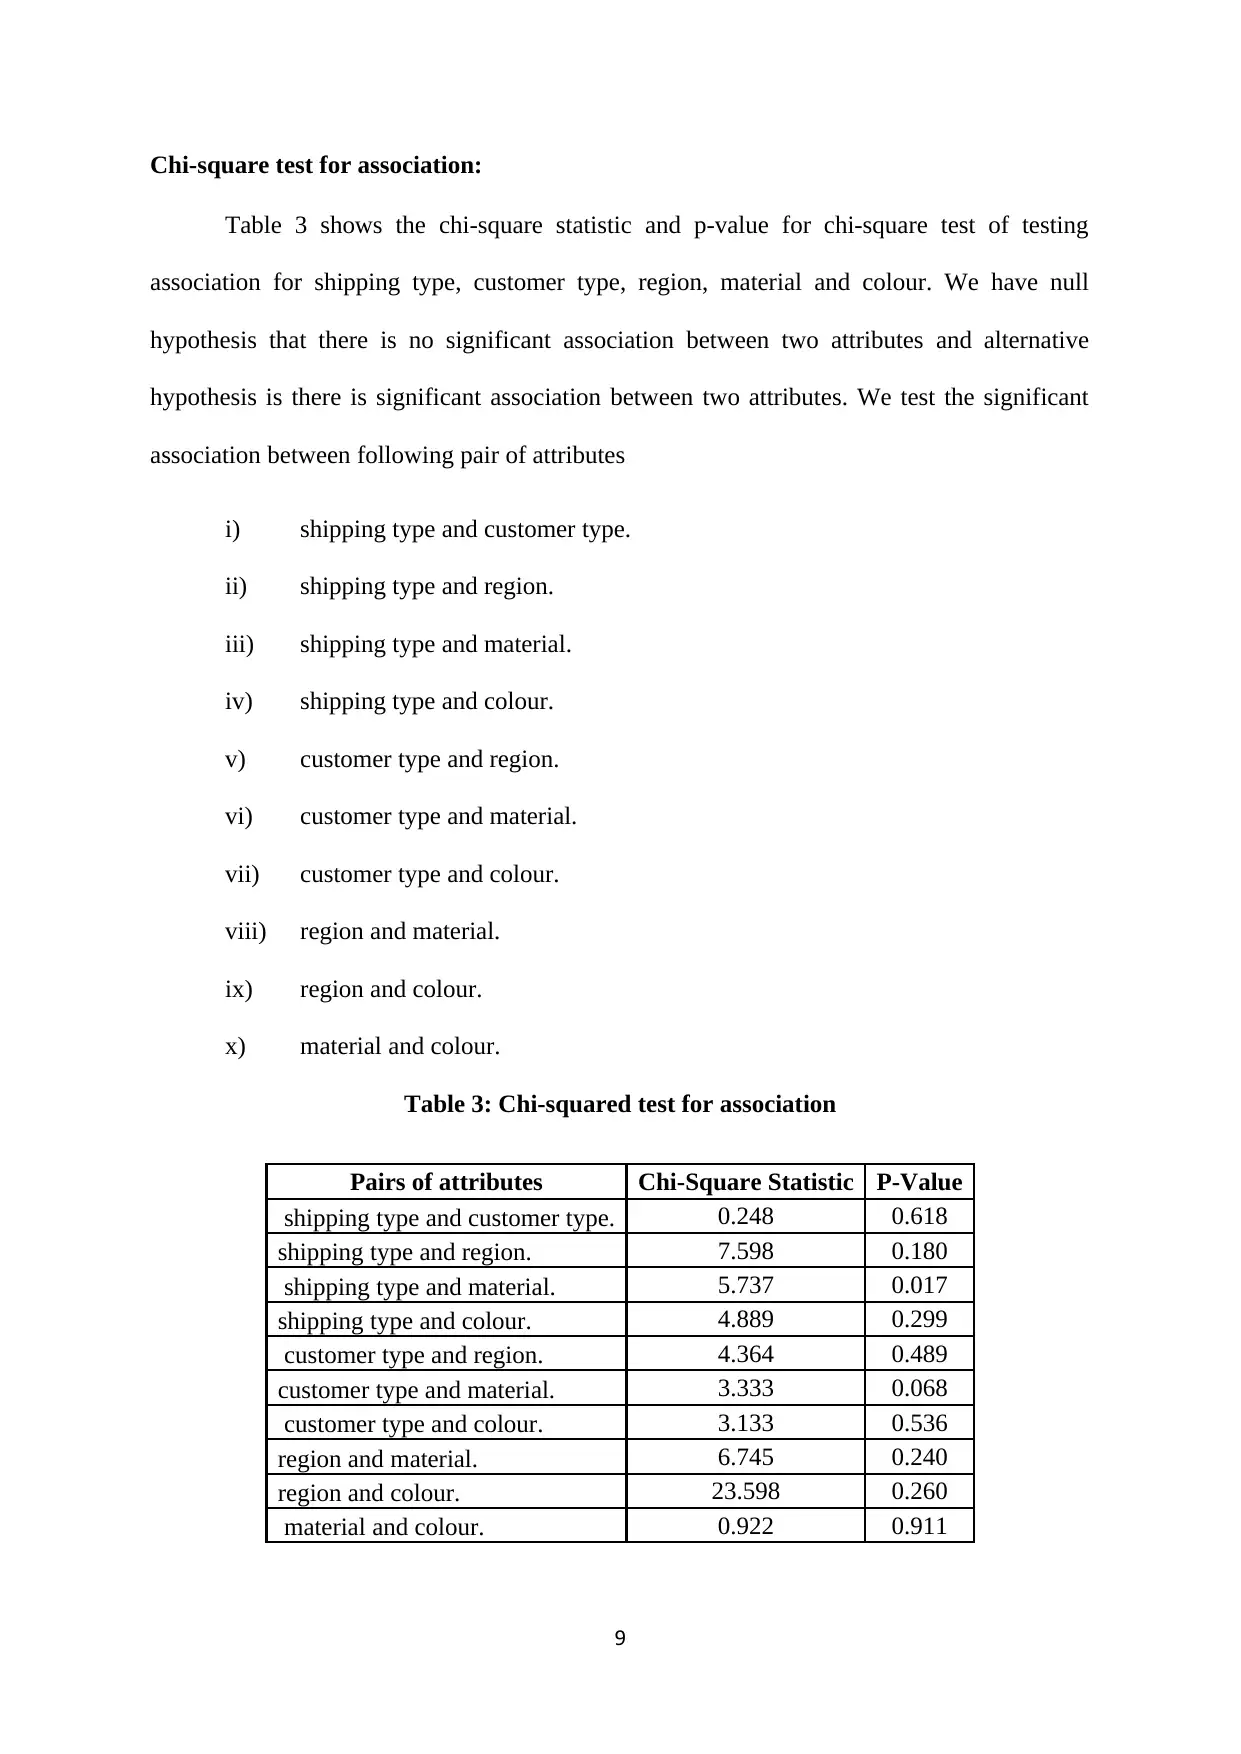
Chi-square test for association:
Table 3 shows the chi-square statistic and p-value for chi-square test of testing
association for shipping type, customer type, region, material and colour. We have null
hypothesis that there is no significant association between two attributes and alternative
hypothesis is there is significant association between two attributes. We test the significant
association between following pair of attributes
i) shipping type and customer type.
ii) shipping type and region.
iii) shipping type and material.
iv) shipping type and colour.
v) customer type and region.
vi) customer type and material.
vii) customer type and colour.
viii) region and material.
ix) region and colour.
x) material and colour.
Table 3: Chi-squared test for association
Pairs of attributes Chi-Square Statistic P-Value
shipping type and customer type. 0.248 0.618
shipping type and region. 7.598 0.180
shipping type and material. 5.737 0.017
shipping type and colour. 4.889 0.299
customer type and region. 4.364 0.489
customer type and material. 3.333 0.068
customer type and colour. 3.133 0.536
region and material. 6.745 0.240
region and colour. 23.598 0.260
material and colour. 0.922 0.911
9
⊘ This is a preview!⊘
Do you want full access?
Subscribe today to unlock all pages.
Trusted by 1+ million students worldwide
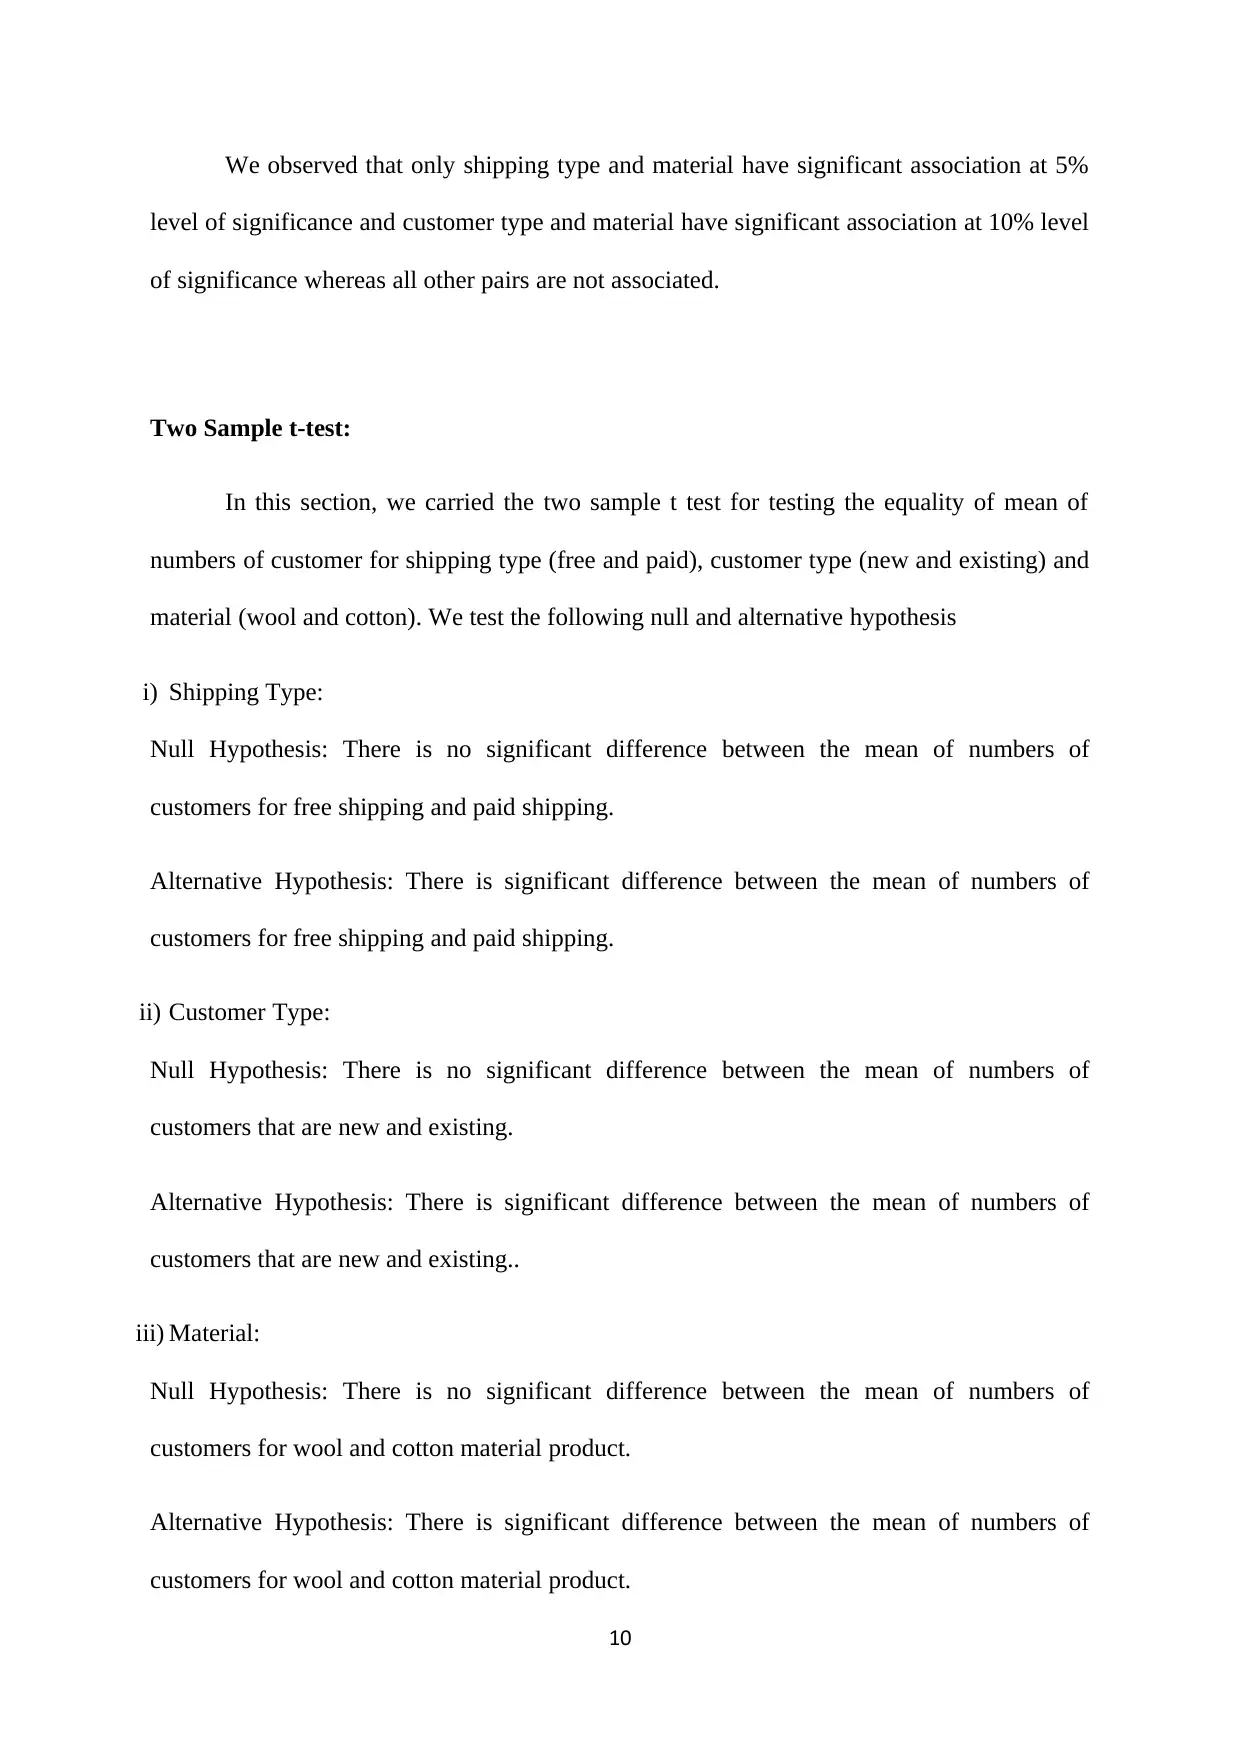
We observed that only shipping type and material have significant association at 5%
level of significance and customer type and material have significant association at 10% level
of significance whereas all other pairs are not associated.
Two Sample t-test:
In this section, we carried the two sample t test for testing the equality of mean of
numbers of customer for shipping type (free and paid), customer type (new and existing) and
material (wool and cotton). We test the following null and alternative hypothesis
i) Shipping Type:
Null Hypothesis: There is no significant difference between the mean of numbers of
customers for free shipping and paid shipping.
Alternative Hypothesis: There is significant difference between the mean of numbers of
customers for free shipping and paid shipping.
ii) Customer Type:
Null Hypothesis: There is no significant difference between the mean of numbers of
customers that are new and existing.
Alternative Hypothesis: There is significant difference between the mean of numbers of
customers that are new and existing..
iii) Material:
Null Hypothesis: There is no significant difference between the mean of numbers of
customers for wool and cotton material product.
Alternative Hypothesis: There is significant difference between the mean of numbers of
customers for wool and cotton material product.
10
Paraphrase This Document
Need a fresh take? Get an instant paraphrase of this document with our AI Paraphraser
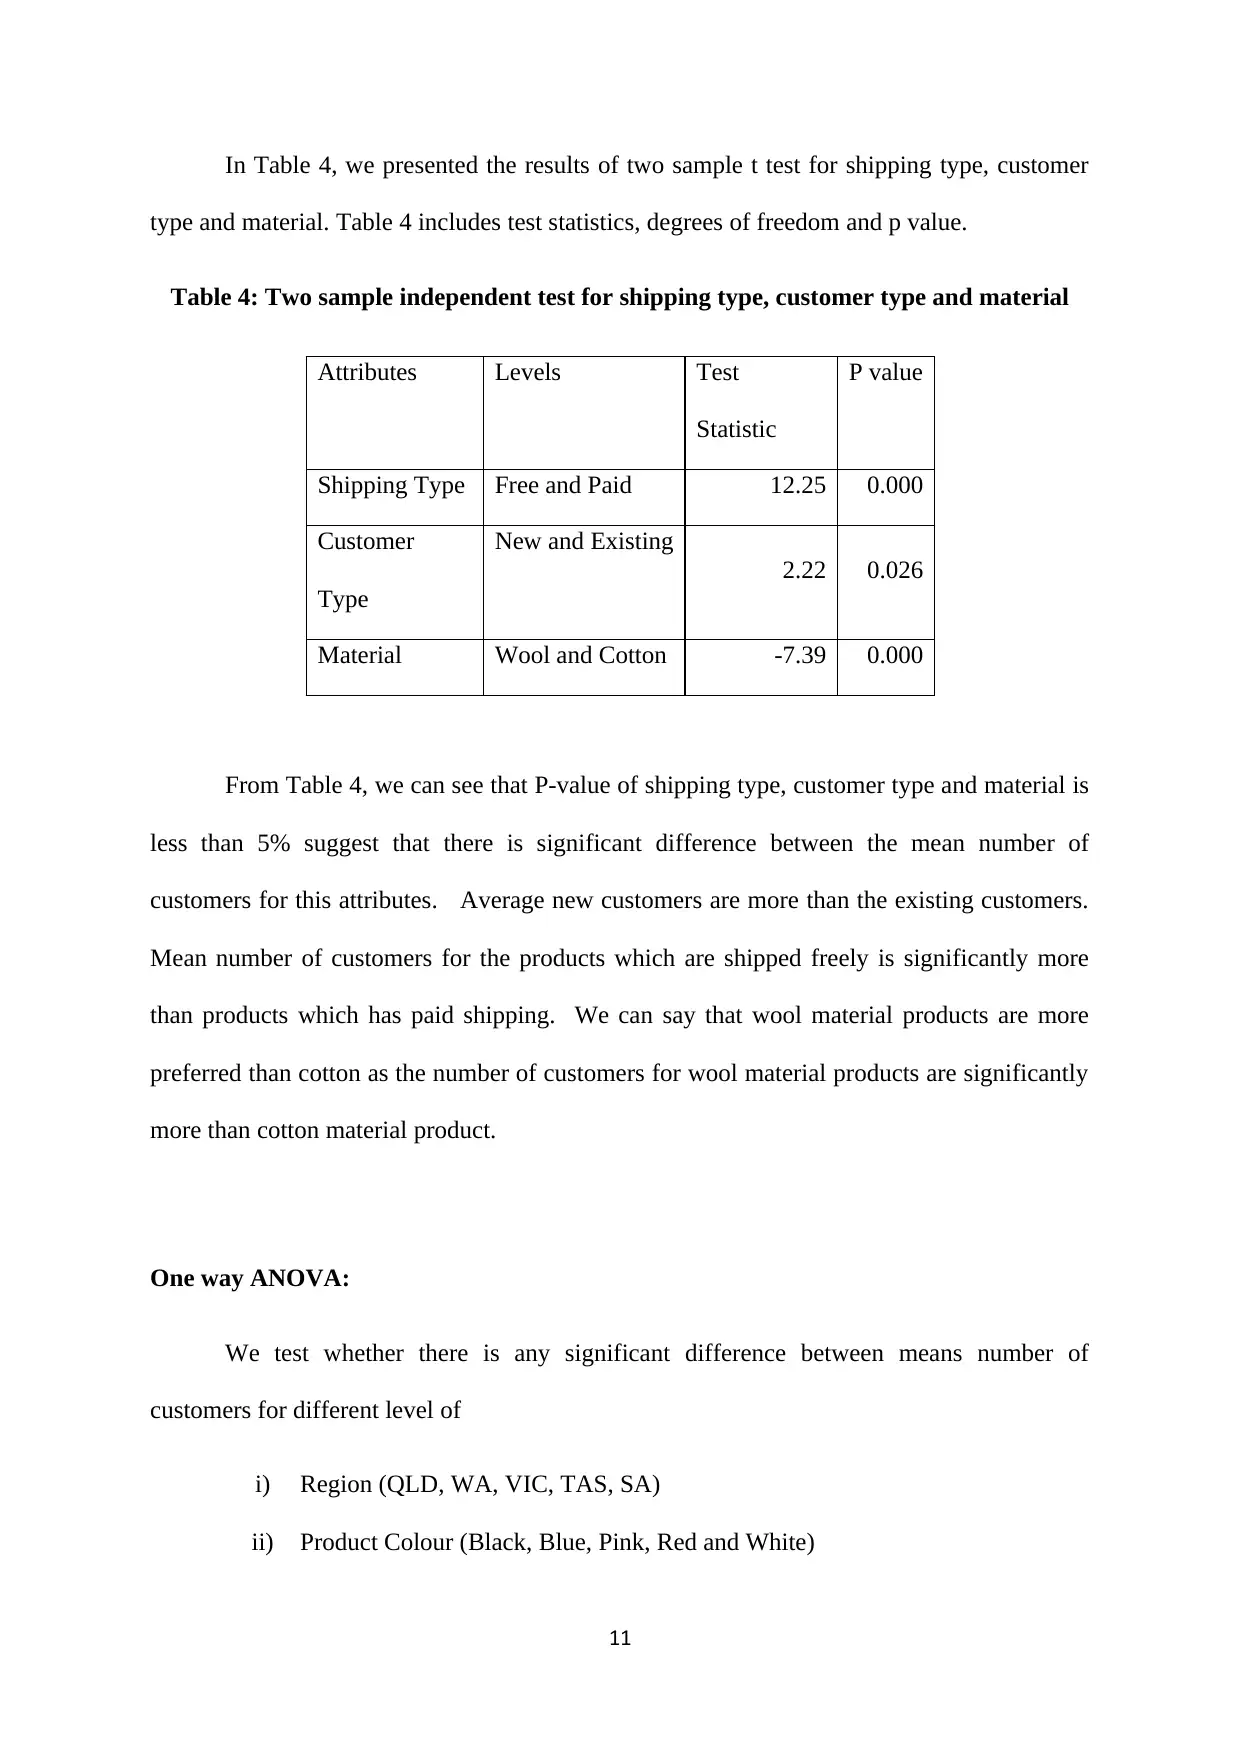
In Table 4, we presented the results of two sample t test for shipping type, customer
type and material. Table 4 includes test statistics, degrees of freedom and p value.
Table 4: Two sample independent test for shipping type, customer type and material
Attributes Levels Test
Statistic
P value
Shipping Type Free and Paid 12.25 0.000
Customer
Type
New and Existing
2.22 0.026
Material Wool and Cotton -7.39 0.000
From Table 4, we can see that P-value of shipping type, customer type and material is
less than 5% suggest that there is significant difference between the mean number of
customers for this attributes. Average new customers are more than the existing customers.
Mean number of customers for the products which are shipped freely is significantly more
than products which has paid shipping. We can say that wool material products are more
preferred than cotton as the number of customers for wool material products are significantly
more than cotton material product.
One way ANOVA:
We test whether there is any significant difference between means number of
customers for different level of
i) Region (QLD, WA, VIC, TAS, SA)
ii) Product Colour (Black, Blue, Pink, Red and White)
11
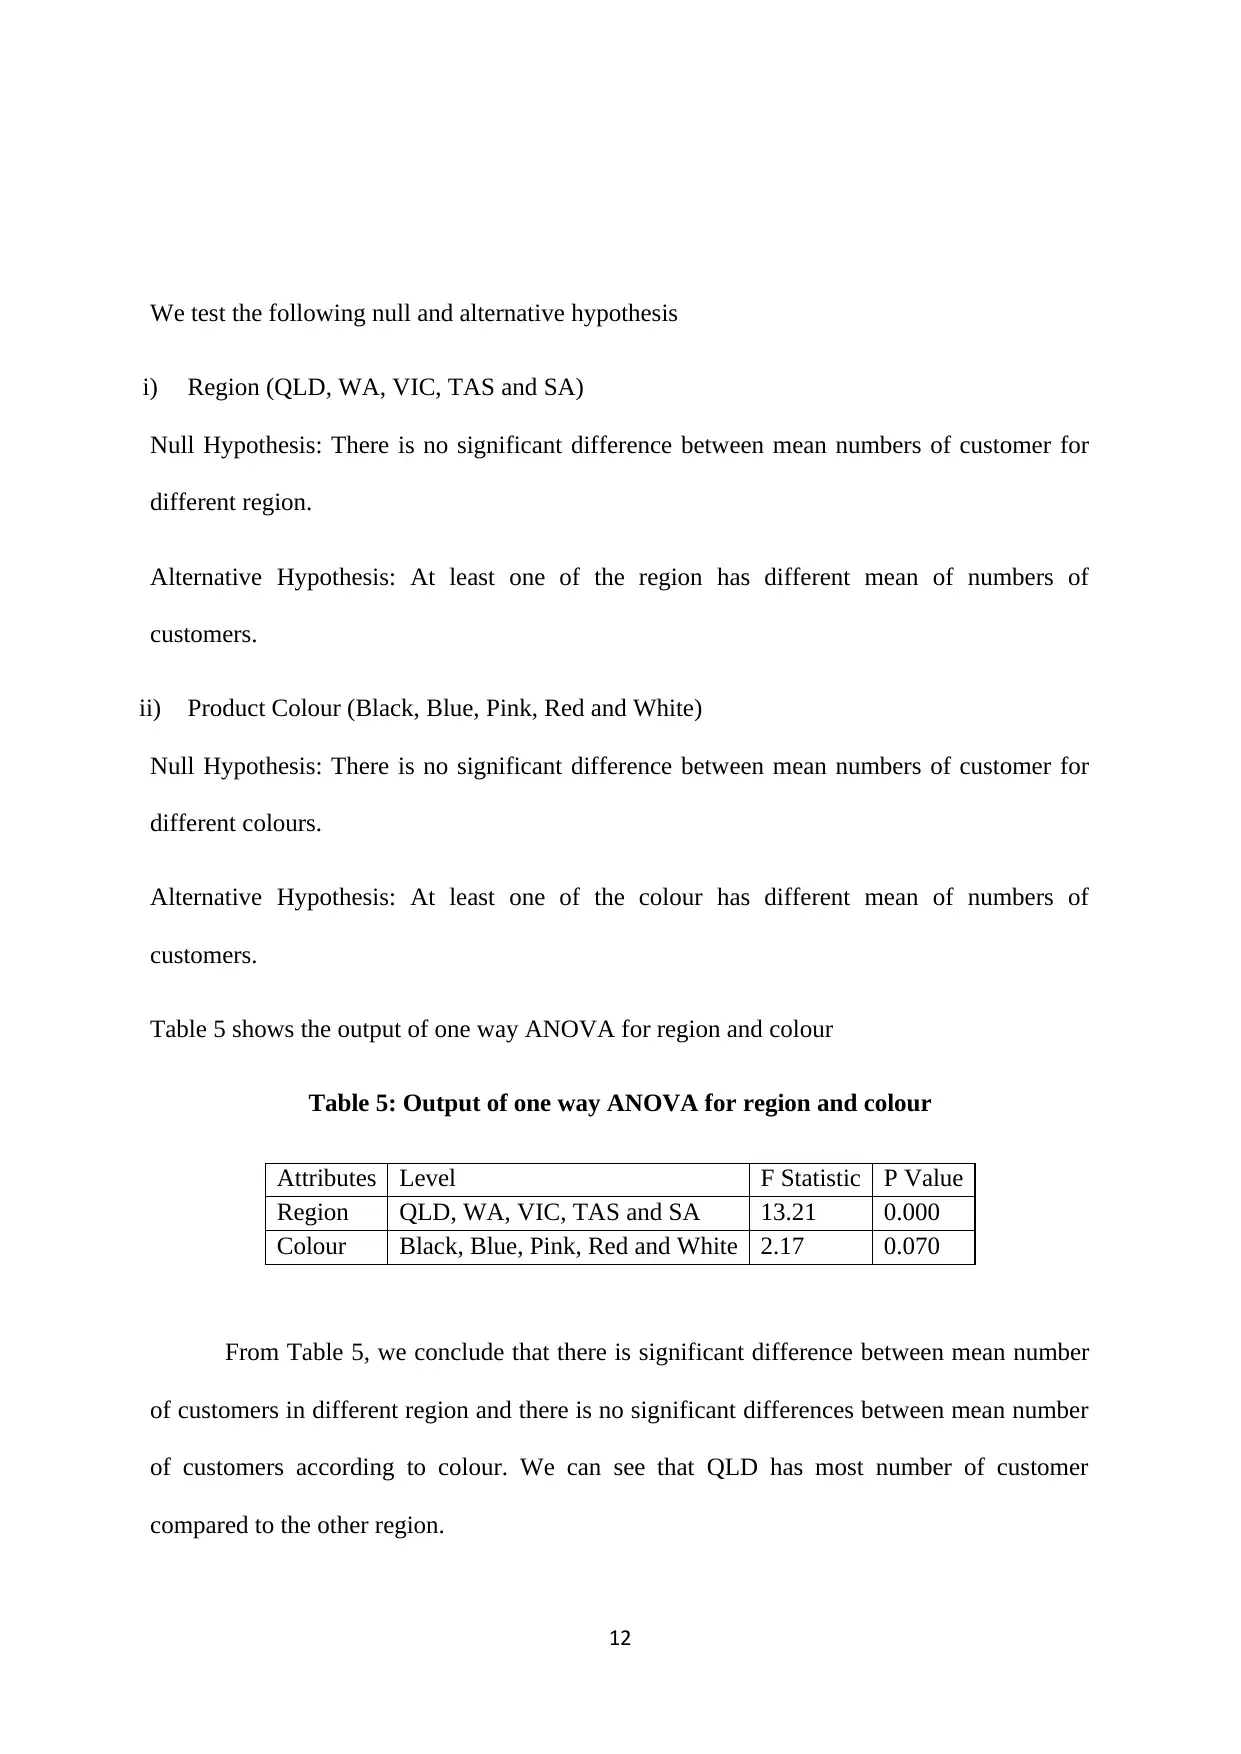
We test the following null and alternative hypothesis
i) Region (QLD, WA, VIC, TAS and SA)
Null Hypothesis: There is no significant difference between mean numbers of customer for
different region.
Alternative Hypothesis: At least one of the region has different mean of numbers of
customers.
ii) Product Colour (Black, Blue, Pink, Red and White)
Null Hypothesis: There is no significant difference between mean numbers of customer for
different colours.
Alternative Hypothesis: At least one of the colour has different mean of numbers of
customers.
Table 5 shows the output of one way ANOVA for region and colour
Table 5: Output of one way ANOVA for region and colour
Attributes Level F Statistic P Value
Region QLD, WA, VIC, TAS and SA 13.21 0.000
Colour Black, Blue, Pink, Red and White 2.17 0.070
From Table 5, we conclude that there is significant difference between mean number
of customers in different region and there is no significant differences between mean number
of customers according to colour. We can see that QLD has most number of customer
compared to the other region.
12
⊘ This is a preview!⊘
Do you want full access?
Subscribe today to unlock all pages.
Trusted by 1+ million students worldwide
1 out of 19
Related Documents


Your All-in-One AI-Powered Toolkit for Academic Success.
+13062052269
info@desklib.com
Available 24*7 on WhatsApp / Email
![[object Object]](/_next/static/media/star-bottom.7253800d.svg)
Unlock your academic potential
Copyright © 2020–2026 A2Z Services. All Rights Reserved. Developed and managed by ZUCOL.