ICT706 Data Analytics: Business Case Study on International Book Store
VerifiedAdded on 2023/06/11
|15
|3529
|269
Case Study
AI Summary
This case study presents a data analytics approach to solving business problems for an International Online Book Store, using a dataset of 1320 book sales. The analysis includes profit analysis by shipping type, customer type, region, and category; statistical testing (two-sample t-tests and ANOVA) to determine differences in mean customer numbers; correlation analysis of product price, sale price, profit, and customer numbers; and regression analysis for total monthly sales. The study concludes with recommendations for the company, such as offering free shipping and targeted marketing strategies, based on the data-driven insights. The goal of the study is to provide decision support and recommendations to the executives in the organisation.
Data Analytics: A Business Case Study
Executive Summary
For this case study, we have developed the data. We have data regarding the sale of
books (1320 books) in the month. We assume that this data is from company International
Online Book Store. We considered the following attributes Book Name, Book Price (in $),
Profit (in $), Book Sale Price (in $), Number of customers who bought this books, Shipping
Type (Free or Paid), Customer Type (New or Existing), Region (WA and SA) and Book
Category (Comics & Graphic Novels, Mystery, Thriller & Suspense, Romance and Literature
& Fiction ).
We presented the total monthly sale amount (in $) and total monthly profit (in $) for
shipping type, customer type, region and category. We have presented the descriptive
statistics for number of customers for shipping type, customer type, region, and category. We
used two sample t test and one way ANOVA for testing the difference between mean number
of customers who bought the books for shipping type, customer type, region and category.
We studied the correlation between product price, profit, sale price, number of pages and
number of customers. We try to fit the regression model for total sale amount.
We have also provided recommendations and plan for company.
1
Paraphrase This Document
Need a fresh take? Get an instant paraphrase of this document with our AI Paraphraser
Table of Contents
Sr. No. Topic Page No.
1 List of Abbreviations and assumptions made 3
2 Introduction – What is the problem? 4
3 Research Methodology 5
4 Analytical Findings 6
5 Recommendations to the company 11
6
An implementation plan based on the recommendations you
have provided
12
7 Conclusion 12
8 List of References 14
9 Appendix 16
2
List of Abbreviations and assumptions made
Max : Maximum
Min : Minimum
SA : South Australia
WA : Western Australia
3
Max : Maximum
Min : Minimum
SA : South Australia
WA : Western Australia
3
⊘ This is a preview!⊘
Do you want full access?
Subscribe today to unlock all pages.
Trusted by 1+ million students worldwide
Introduction – What is the problem?
By the definition of book, “A book is a series of pages assembled for easy portability
and reading, as well as the composition contained in it”. In everyone life book plays the
important role.
Today we can get the bool easily from online store. Book section in every online store
is main part of business. Today we purchase the most items online. We can get desired
product at home within stipulated time.
eCommerce becoming very raising and popular business in every corner of the world.
Online shopping is most popular from the all eCommerce business. eCommerce business
increasing exponentially in recent decade bring new challenges to the service provider.
Business competition and customer satisfaction are the most important factors in the
eCommerce business.
About Data:
For this case study, we have developed the data. We have data regarding the sale of
books (1320 books) in the month. We assume that this data is from company International
Online Book Store. We considered the following attributes
i) Book Name
ii) Book Price (in $)
iii) Profit (in $)
iv) Book Sale Price (in $)
v) Number of customers who bought this products
vi) Shipping Type (Free or Paid)
vii) Customer Type (New or Existing)
4
Paraphrase This Document
Need a fresh take? Get an instant paraphrase of this document with our AI Paraphraser
viii) Region (WA and SA)
ix) Book Category (Comics & Graphic Novels, Mystery, Thriller & Suspense, Romance
and Literature & Fiction )
We defined following variables for the study objectives as
Total Monthly sale amount (in $) = Book Sale Price (in $) × Number of customers
Total monthly profit (in $) = Profit (in $) × Number of customers
Project Problem:
We concentrate on the following
i) Profit analysis by shipping type, customer type, region and category.
ii) Whether the mean number of customers are significantly different for different
shipping type, customer type, region and category.
iii) Correlation analysis of variables
iv) Regression analysis for total monthly sales
Research Methodology
Statistical tool and techniques are important aspect of data analysis. In literature there
are many statistical tools and techniques are available. But use of proper tools and technique
is important part of analysis.
For the profit analysis, we presented the total monthly sale amount (in $) and total
monthly profit (in $) for shipping type, customer type, region and category. We have
presented the descriptive statistics for number of customers for shipping type, customer type,
region, and category. We used two sample t test and one way ANOVA for testing the
difference between mean number of customers who bought the books for shipping type,
5
customer type, region and category. We studied the correlation between product price, profit,
sale price, number of pages and number of customers. We try to fit the regression model for
total sale amount. We used Python 3.6.5 and MS-Excel for the data analysis. The sample
code are given in appendixes. We used Grus (2015), McKinney (2012), Pedregosa et al.
(2011) and Schutt and O'Neil (2013).
Analytical Findings
In this section, we carried the following
Profit Analysis
Description Statistics
Two sample t test
One way ANOVA
Correlation Analysis
Regression Analysis
Profit Analysis:
For the profit analysis we have given the total monthly sale amount (in $), total
monthly profit (in $) and profit percentage for shipping type, customer type, region and
category. We referred Berenson et al. (2012), Black (2009), Groebner et al. (2008), Kvanli et
al. (2000) and Mendenhall and Sincich (1993). Profit analysis is represented in Table 1.
6
⊘ This is a preview!⊘
Do you want full access?
Subscribe today to unlock all pages.
Trusted by 1+ million students worldwide
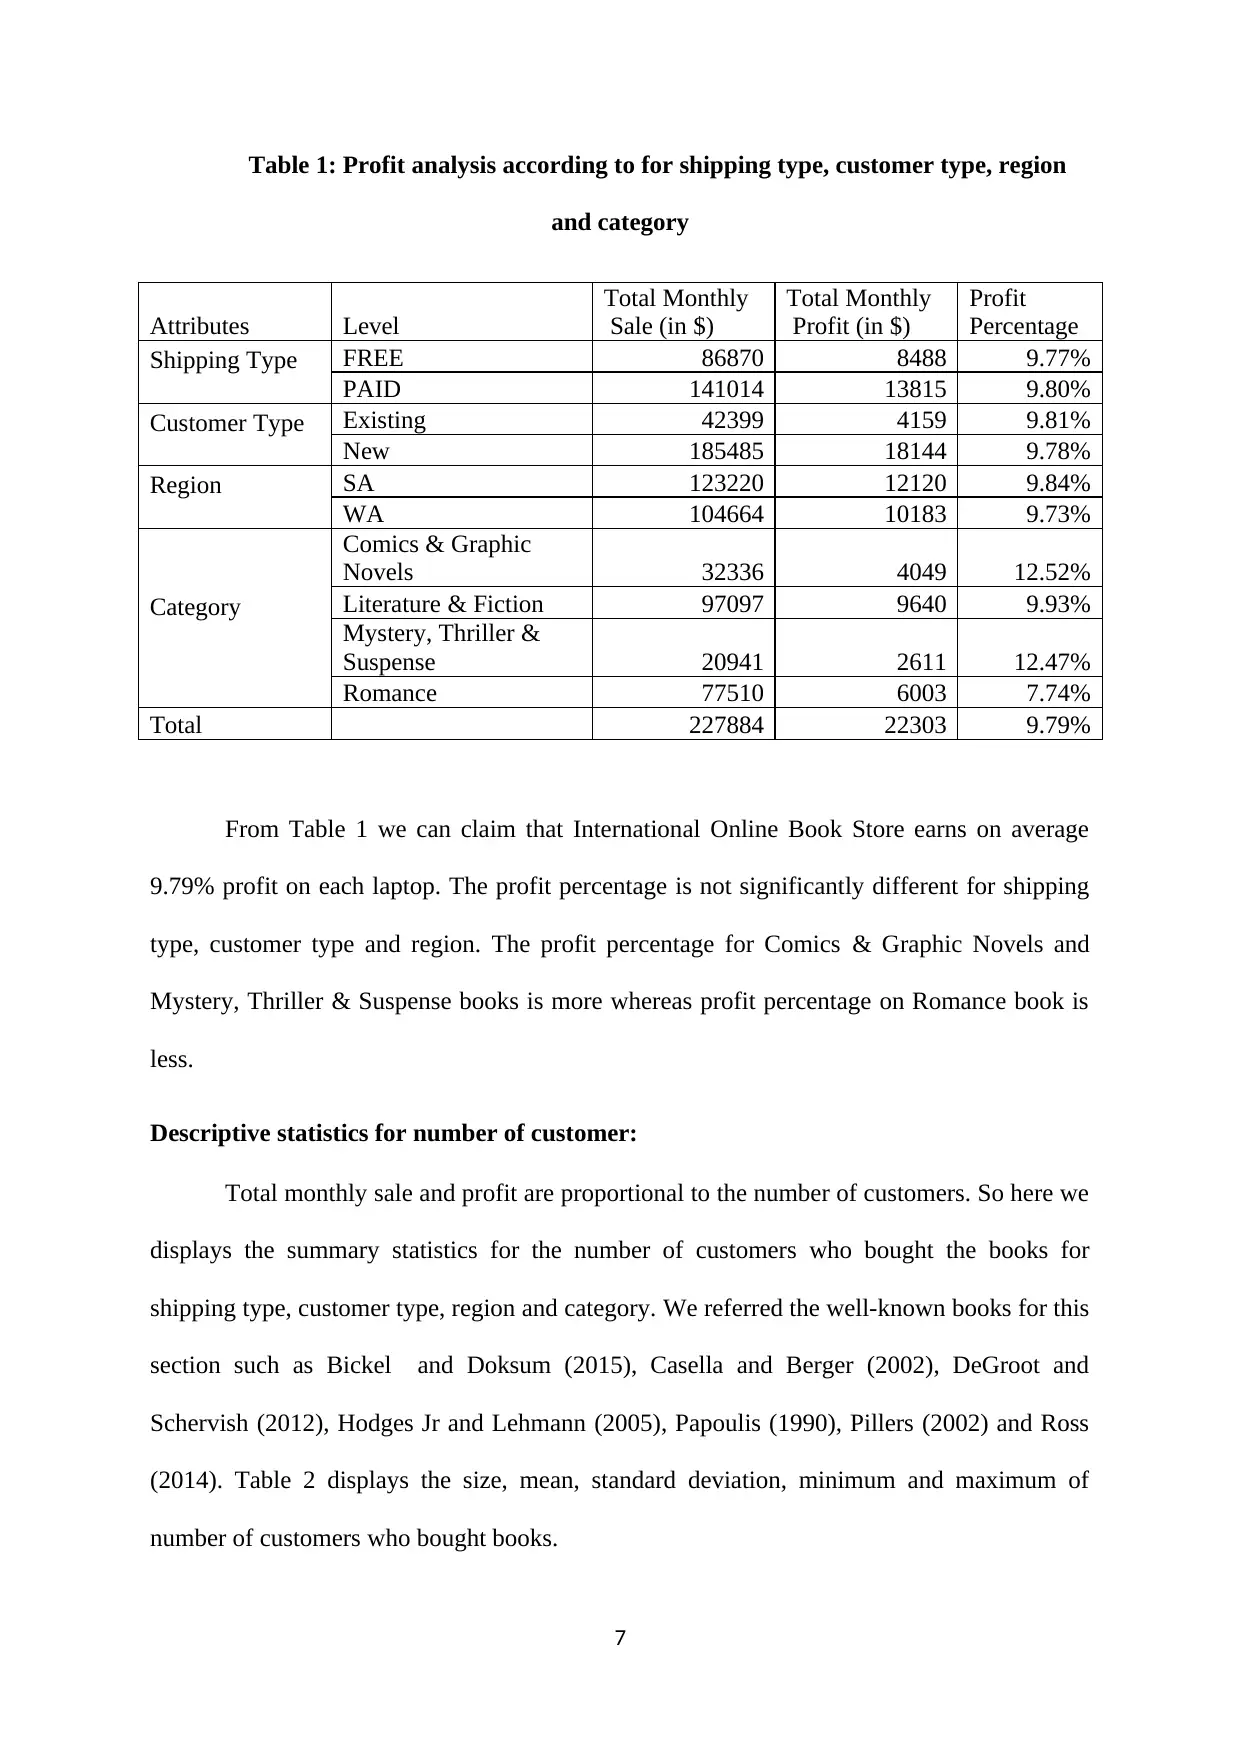
Table 1: Profit analysis according to for shipping type, customer type, region
and category
Attributes Level
Total Monthly
Sale (in $)
Total Monthly
Profit (in $)
Profit
Percentage
Shipping Type FREE 86870 8488 9.77%
PAID 141014 13815 9.80%
Customer Type Existing 42399 4159 9.81%
New 185485 18144 9.78%
Region SA 123220 12120 9.84%
WA 104664 10183 9.73%
Category
Comics & Graphic
Novels 32336 4049 12.52%
Literature & Fiction 97097 9640 9.93%
Mystery, Thriller &
Suspense 20941 2611 12.47%
Romance 77510 6003 7.74%
Total 227884 22303 9.79%
From Table 1 we can claim that International Online Book Store earns on average
9.79% profit on each laptop. The profit percentage is not significantly different for shipping
type, customer type and region. The profit percentage for Comics & Graphic Novels and
Mystery, Thriller & Suspense books is more whereas profit percentage on Romance book is
less.
Descriptive statistics for number of customer:
Total monthly sale and profit are proportional to the number of customers. So here we
displays the summary statistics for the number of customers who bought the books for
shipping type, customer type, region and category. We referred the well-known books for this
section such as Bickel and Doksum (2015), Casella and Berger (2002), DeGroot and
Schervish (2012), Hodges Jr and Lehmann (2005), Papoulis (1990), Pillers (2002) and Ross
(2014). Table 2 displays the size, mean, standard deviation, minimum and maximum of
number of customers who bought books.
7
Paraphrase This Document
Need a fresh take? Get an instant paraphrase of this document with our AI Paraphraser
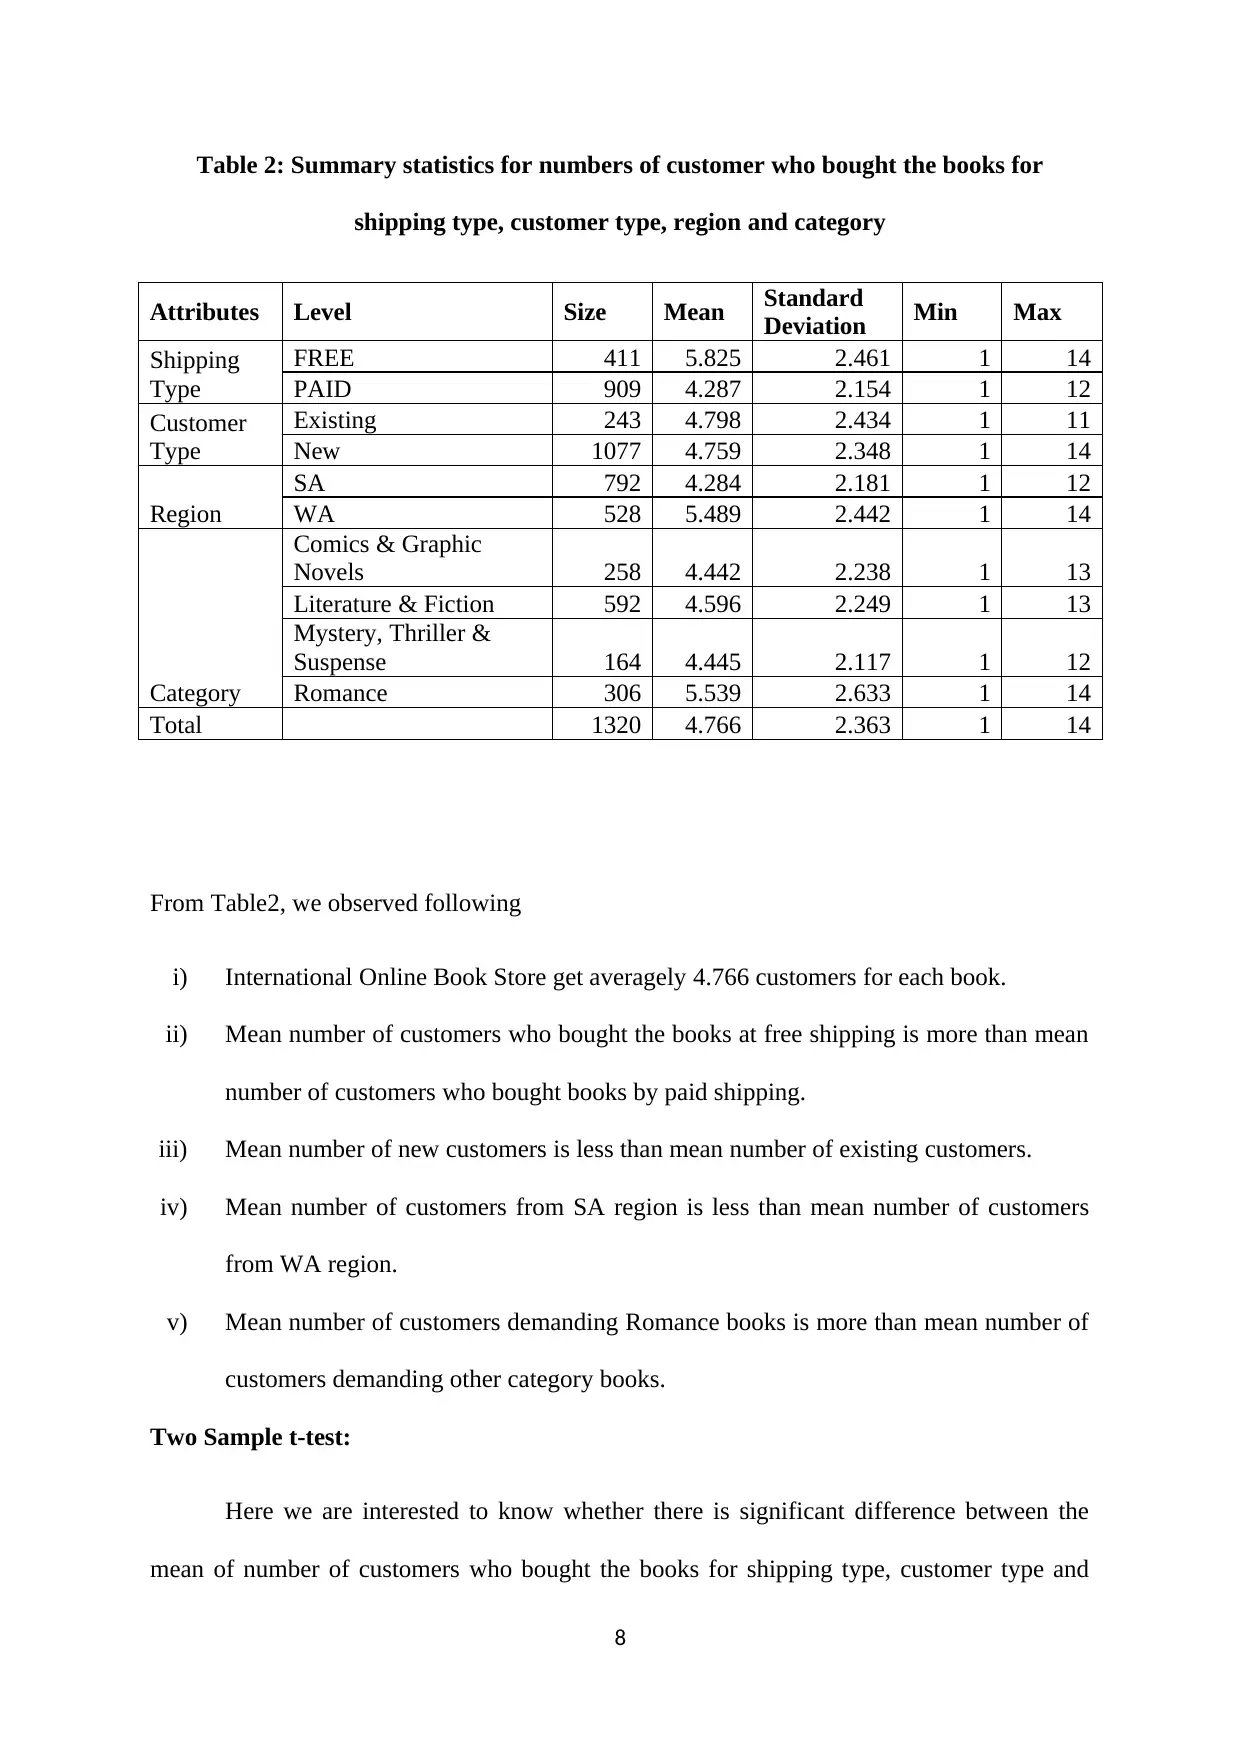
Table 2: Summary statistics for numbers of customer who bought the books for
shipping type, customer type, region and category
Attributes Level Size Mean Standard
Deviation Min Max
Shipping
Type
FREE 411 5.825 2.461 1 14
PAID 909 4.287 2.154 1 12
Customer
Type
Existing 243 4.798 2.434 1 11
New 1077 4.759 2.348 1 14
Region
SA 792 4.284 2.181 1 12
WA 528 5.489 2.442 1 14
Category
Comics & Graphic
Novels 258 4.442 2.238 1 13
Literature & Fiction 592 4.596 2.249 1 13
Mystery, Thriller &
Suspense 164 4.445 2.117 1 12
Romance 306 5.539 2.633 1 14
Total 1320 4.766 2.363 1 14
From Table2, we observed following
i) International Online Book Store get averagely 4.766 customers for each book.
ii) Mean number of customers who bought the books at free shipping is more than mean
number of customers who bought books by paid shipping.
iii) Mean number of new customers is less than mean number of existing customers.
iv) Mean number of customers from SA region is less than mean number of customers
from WA region.
v) Mean number of customers demanding Romance books is more than mean number of
customers demanding other category books.
Two Sample t-test:
Here we are interested to know whether there is significant difference between the
mean of number of customers who bought the books for shipping type, customer type and
8
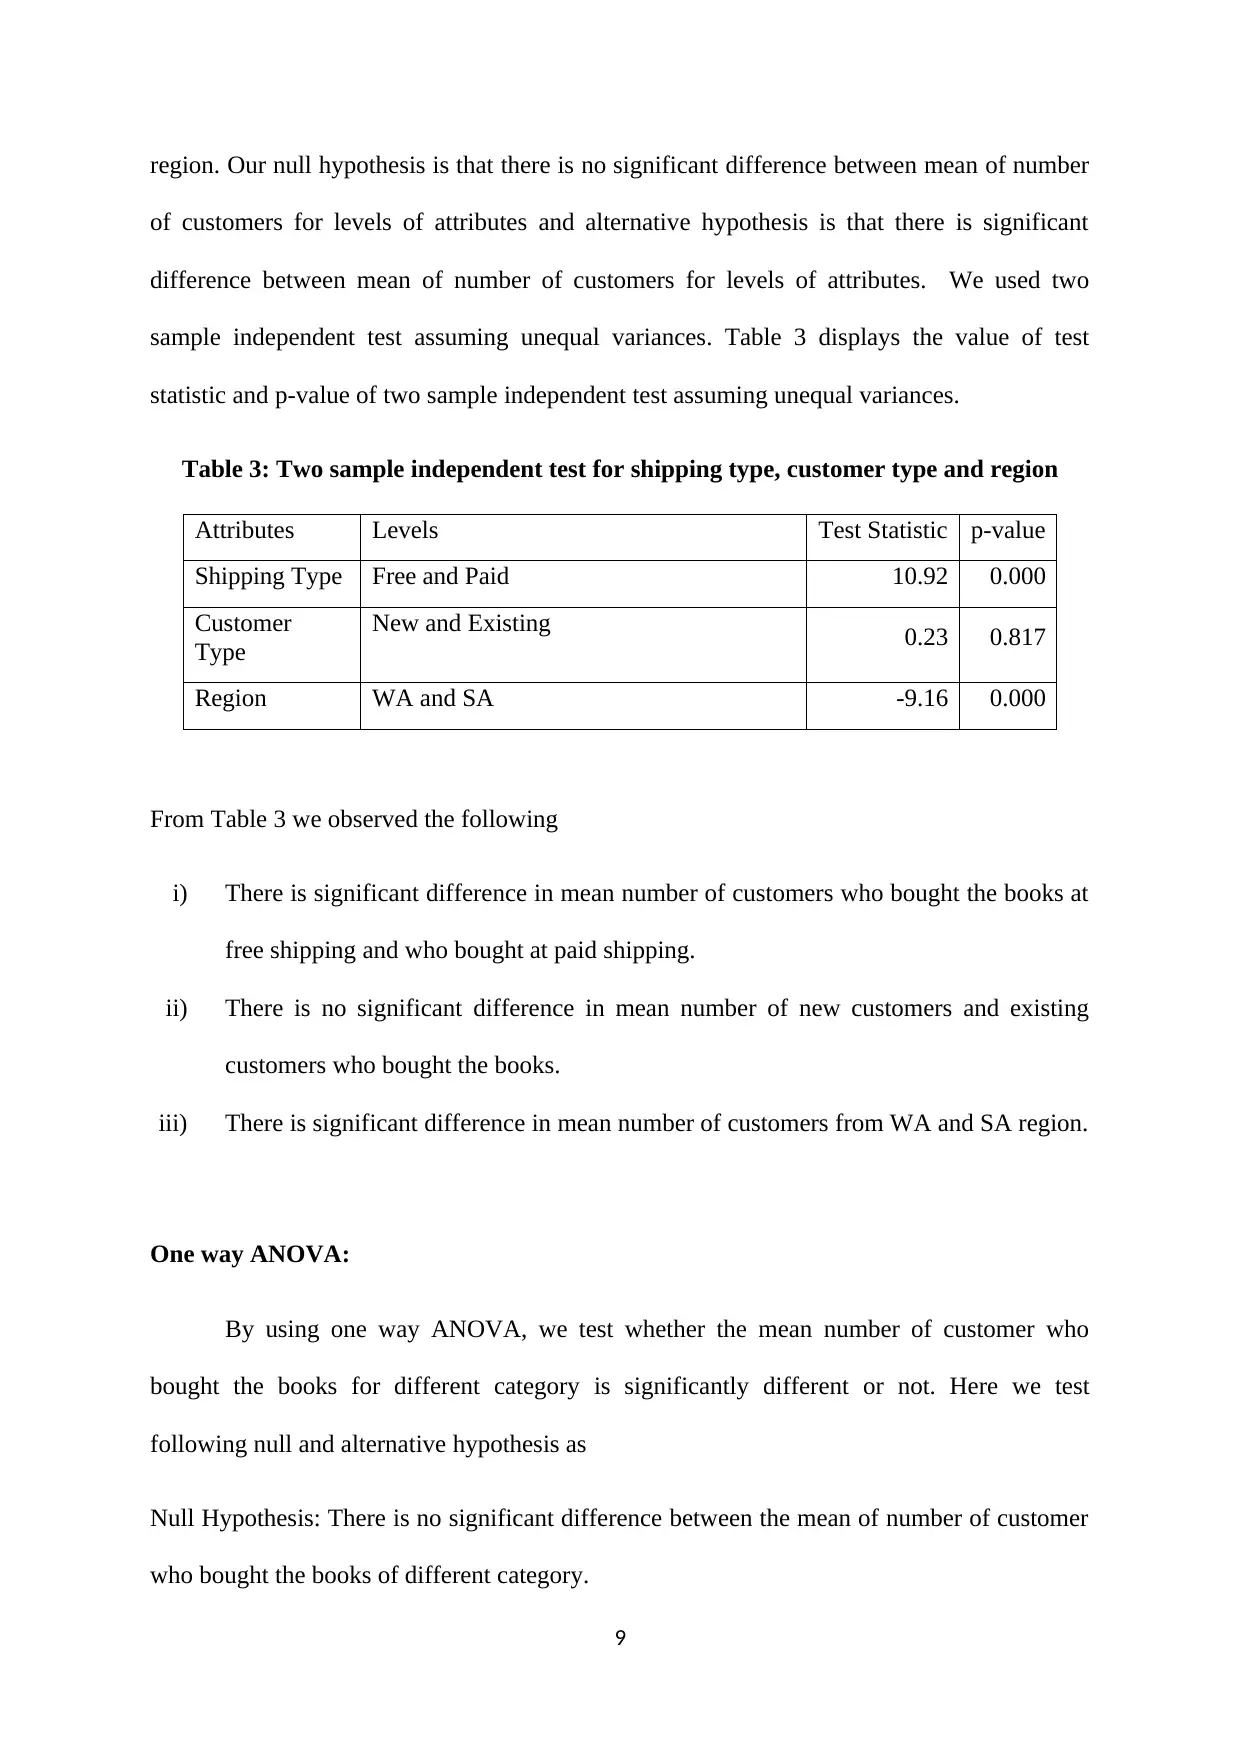
region. Our null hypothesis is that there is no significant difference between mean of number
of customers for levels of attributes and alternative hypothesis is that there is significant
difference between mean of number of customers for levels of attributes. We used two
sample independent test assuming unequal variances. Table 3 displays the value of test
statistic and p-value of two sample independent test assuming unequal variances.
Table 3: Two sample independent test for shipping type, customer type and region
Attributes Levels Test Statistic p-value
Shipping Type Free and Paid 10.92 0.000
Customer
Type
New and Existing 0.23 0.817
Region WA and SA -9.16 0.000
From Table 3 we observed the following
i) There is significant difference in mean number of customers who bought the books at
free shipping and who bought at paid shipping.
ii) There is no significant difference in mean number of new customers and existing
customers who bought the books.
iii) There is significant difference in mean number of customers from WA and SA region.
One way ANOVA:
By using one way ANOVA, we test whether the mean number of customer who
bought the books for different category is significantly different or not. Here we test
following null and alternative hypothesis as
Null Hypothesis: There is no significant difference between the mean of number of customer
who bought the books of different category.
9
⊘ This is a preview!⊘
Do you want full access?
Subscribe today to unlock all pages.
Trusted by 1+ million students worldwide
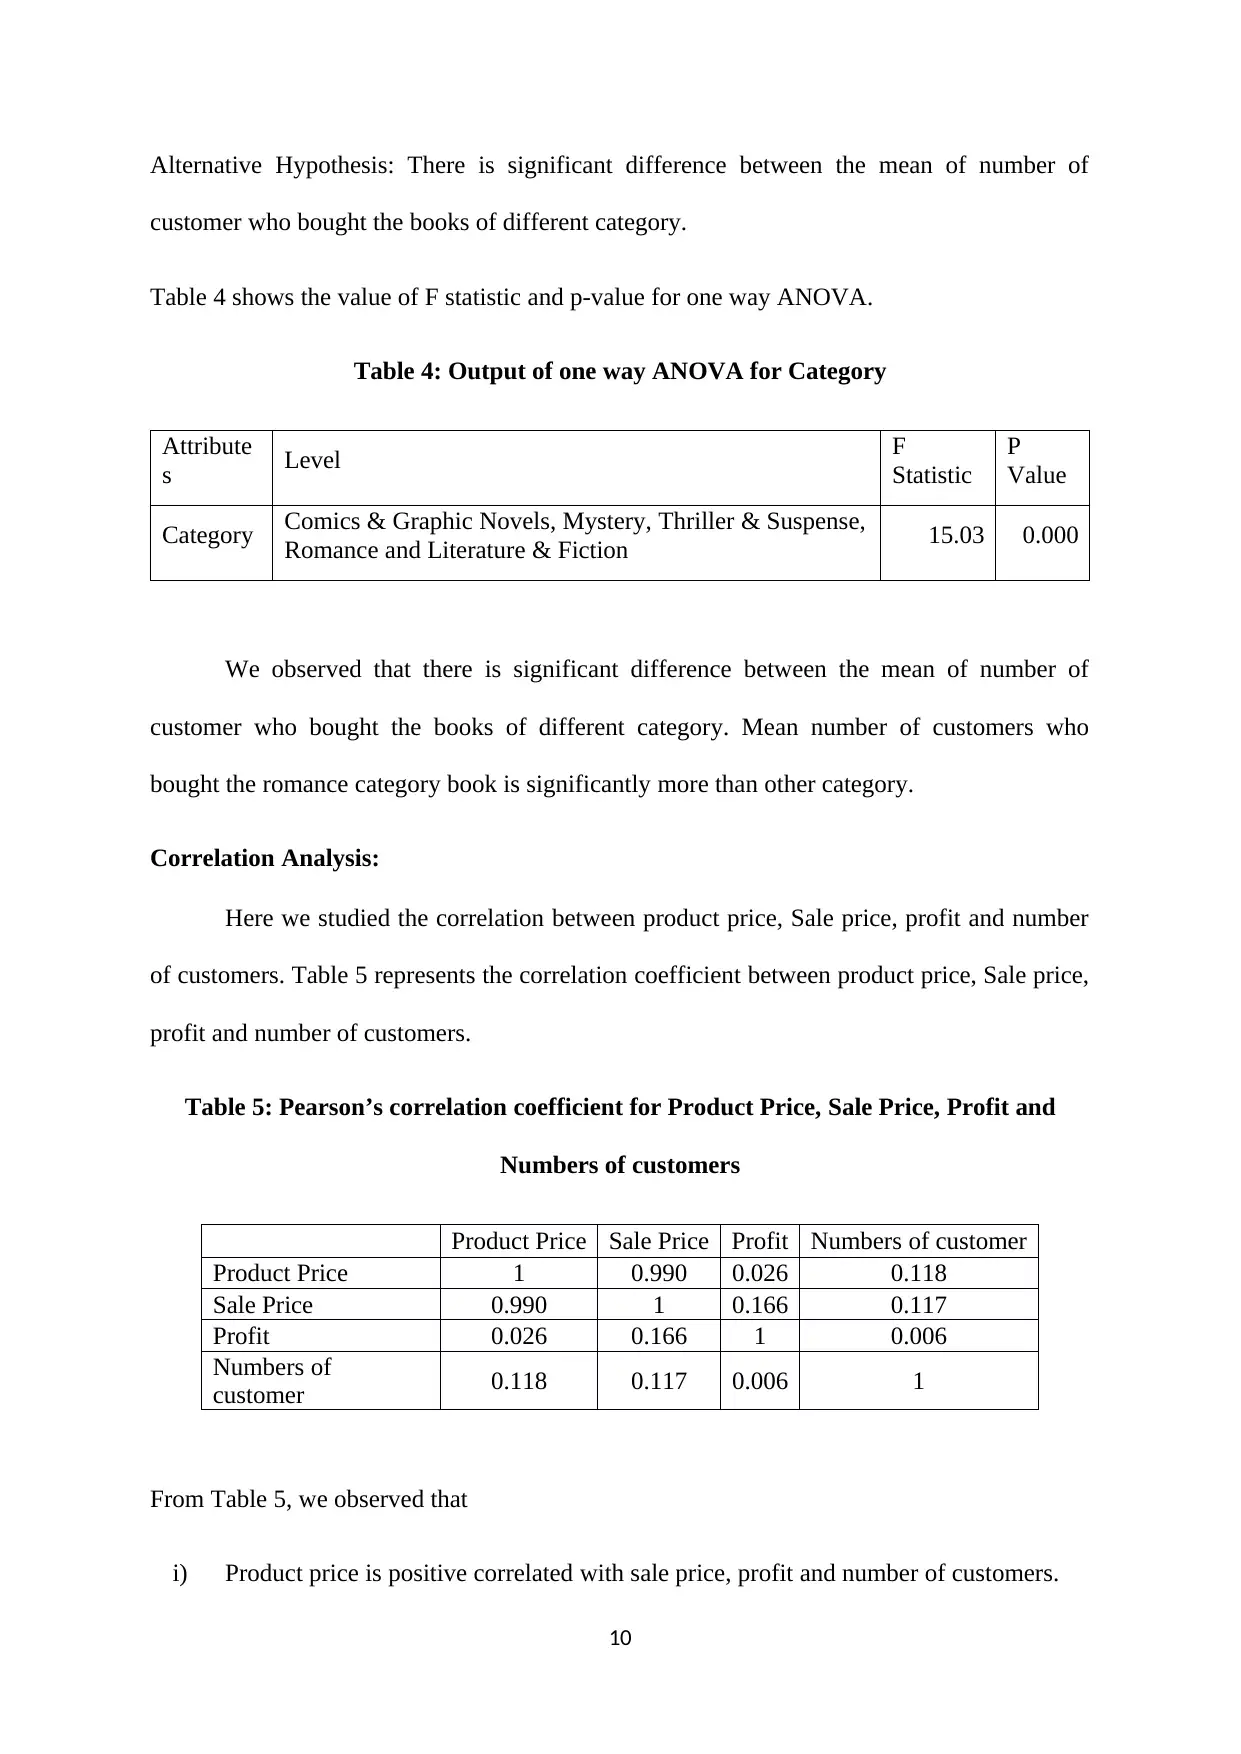
Alternative Hypothesis: There is significant difference between the mean of number of
customer who bought the books of different category.
Table 4 shows the value of F statistic and p-value for one way ANOVA.
Table 4: Output of one way ANOVA for Category
Attribute
s Level F
Statistic
P
Value
Category Comics & Graphic Novels, Mystery, Thriller & Suspense,
Romance and Literature & Fiction 15.03 0.000
We observed that there is significant difference between the mean of number of
customer who bought the books of different category. Mean number of customers who
bought the romance category book is significantly more than other category.
Correlation Analysis:
Here we studied the correlation between product price, Sale price, profit and number
of customers. Table 5 represents the correlation coefficient between product price, Sale price,
profit and number of customers.
Table 5: Pearson’s correlation coefficient for Product Price, Sale Price, Profit and
Numbers of customers
Product Price Sale Price Profit Numbers of customer
Product Price 1 0.990 0.026 0.118
Sale Price 0.990 1 0.166 0.117
Profit 0.026 0.166 1 0.006
Numbers of
customer 0.118 0.117 0.006 1
From Table 5, we observed that
i) Product price is positive correlated with sale price, profit and number of customers.
10
Paraphrase This Document
Need a fresh take? Get an instant paraphrase of this document with our AI Paraphraser
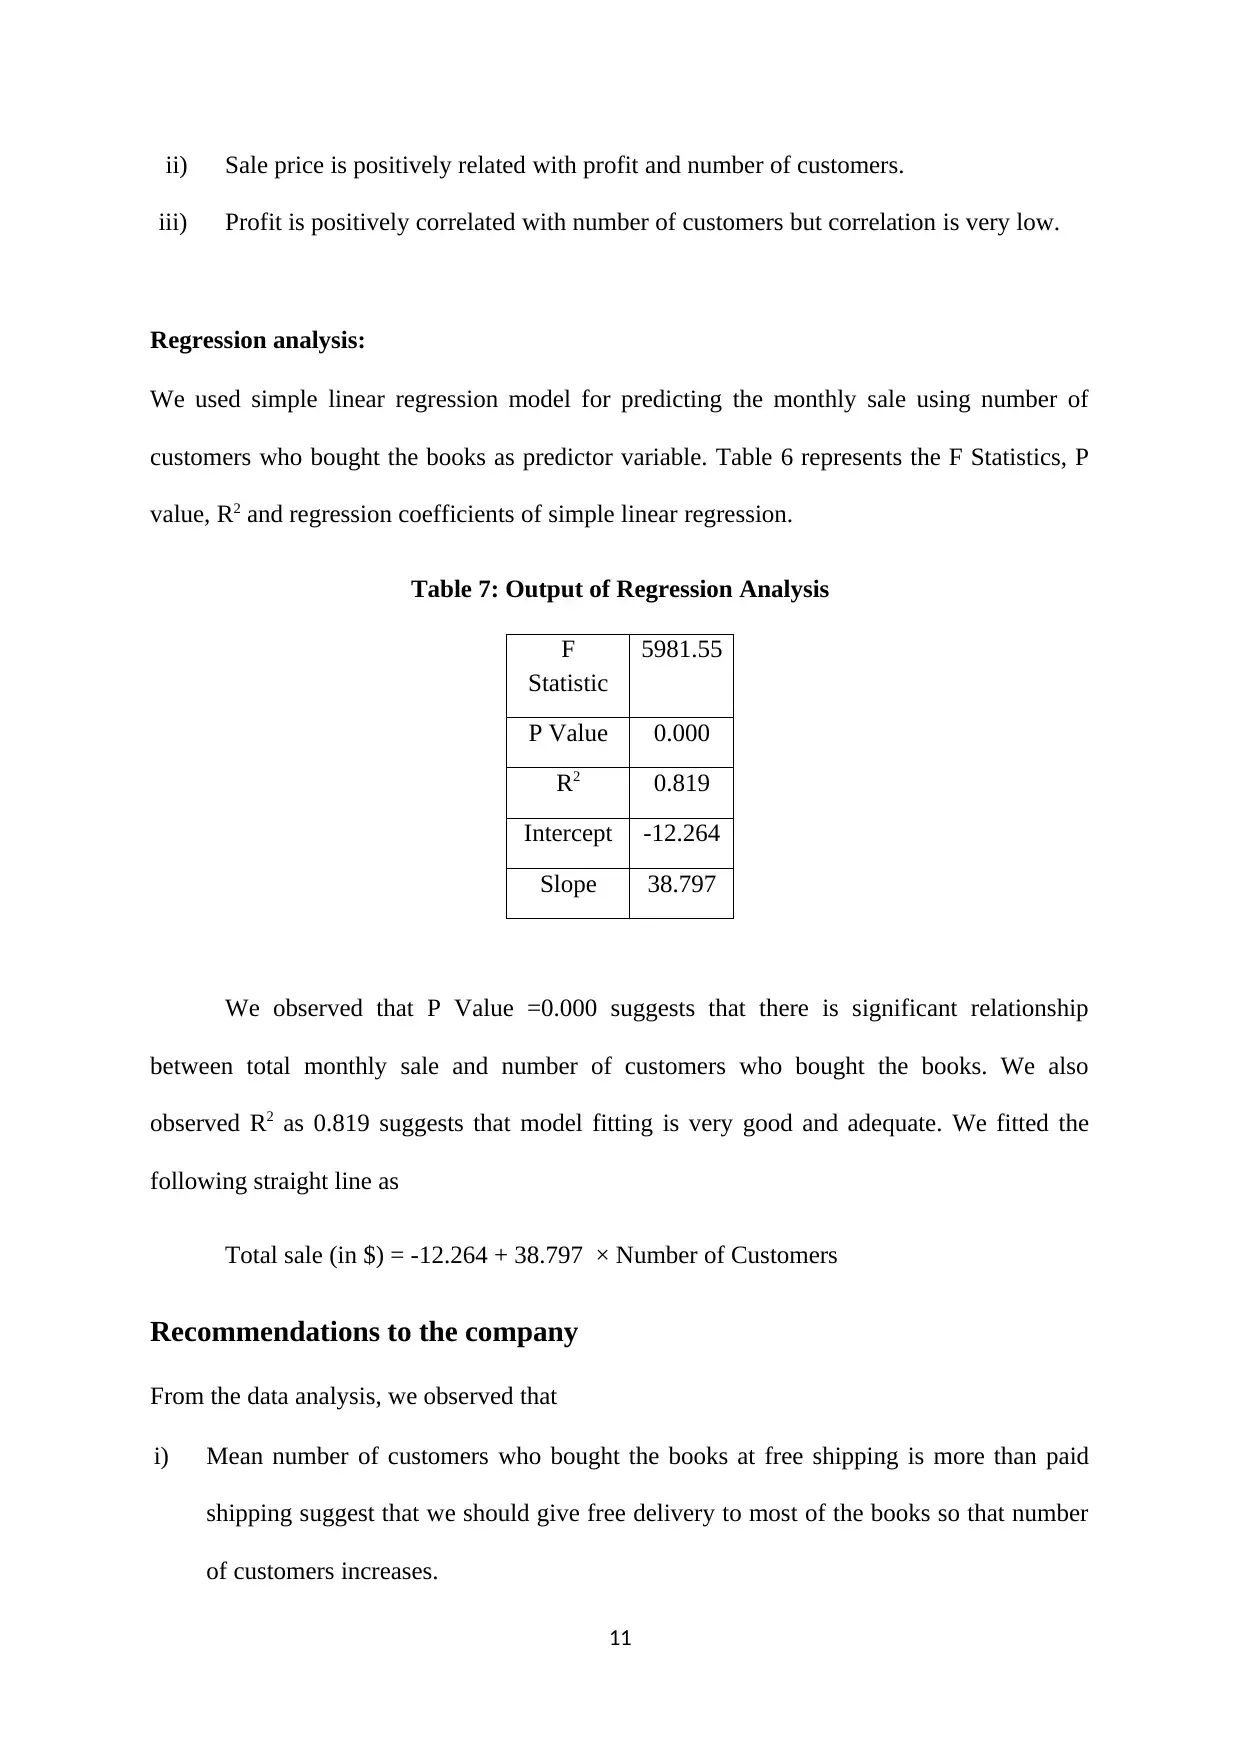
ii) Sale price is positively related with profit and number of customers.
iii) Profit is positively correlated with number of customers but correlation is very low.
Regression analysis:
We used simple linear regression model for predicting the monthly sale using number of
customers who bought the books as predictor variable. Table 6 represents the F Statistics, P
value, R2 and regression coefficients of simple linear regression.
Table 7: Output of Regression Analysis
F
Statistic
5981.55
P Value 0.000
R2 0.819
Intercept -12.264
Slope 38.797
We observed that P Value =0.000 suggests that there is significant relationship
between total monthly sale and number of customers who bought the books. We also
observed R2 as 0.819 suggests that model fitting is very good and adequate. We fitted the
following straight line as
Total sale (in $) = -12.264 + 38.797 × Number of Customers
Recommendations to the company
From the data analysis, we observed that
i) Mean number of customers who bought the books at free shipping is more than paid
shipping suggest that we should give free delivery to most of the books so that number
of customers increases.
11
ii) Mean number of customers in SA region is less than WA region suggesting that we
should use some marketing strategies in SA region.
iii) Mean number of customers for Romance books is more than other category books
suggest that every new Romance book must be available in our store and it should be
informed to all customers.
An implementation plan based on the recommendations you have provided
i) We should increase strength of shipping staff so that free shipping will be possible for
most of the books.
ii) We should adopt the marketing strategies in WA region for SA region so that number of
customers increases. We can use more advertising board in SA region.
iii) We can implement some offer or facility for SA region.
iv) We must target the other region of Australia for selling the books.
v) As the demand for Romance book is more we should advertise each Romance book.
Conclusions
From Profit analysis, claim that International Online Book Store earns on average
9.79% profit on each laptop. The profit percentage is not significantly different for shipping
type, customer type and region. The profit percentage for Comics & Graphic Novels and
Mystery, Thriller & Suspense books is more whereas profit percentage on Romance book is
less. We observed that International Online Book Store get averagely 4.766 customers for
each book. Mean number of customers who bought the books at free shipping is more than
mean number of customers who bought books by paid shipping. Mean number of new
customers is less than mean number of existing customers. Mean number of customers from
SA region is less than mean number of customers from WA region. Mean number of
12
⊘ This is a preview!⊘
Do you want full access?
Subscribe today to unlock all pages.
Trusted by 1+ million students worldwide
1 out of 15
Related Documents


Your All-in-One AI-Powered Toolkit for Academic Success.
+13062052269
info@desklib.com
Available 24*7 on WhatsApp / Email
![[object Object]](/_next/static/media/star-bottom.7253800d.svg)
Unlock your academic potential
Copyright © 2020–2026 A2Z Services. All Rights Reserved. Developed and managed by ZUCOL.