ICT706: Data Analytics for E-commerce Sales and Business Growth
VerifiedAdded on 2024/06/03
|18
|1969
|258
Report
AI Summary
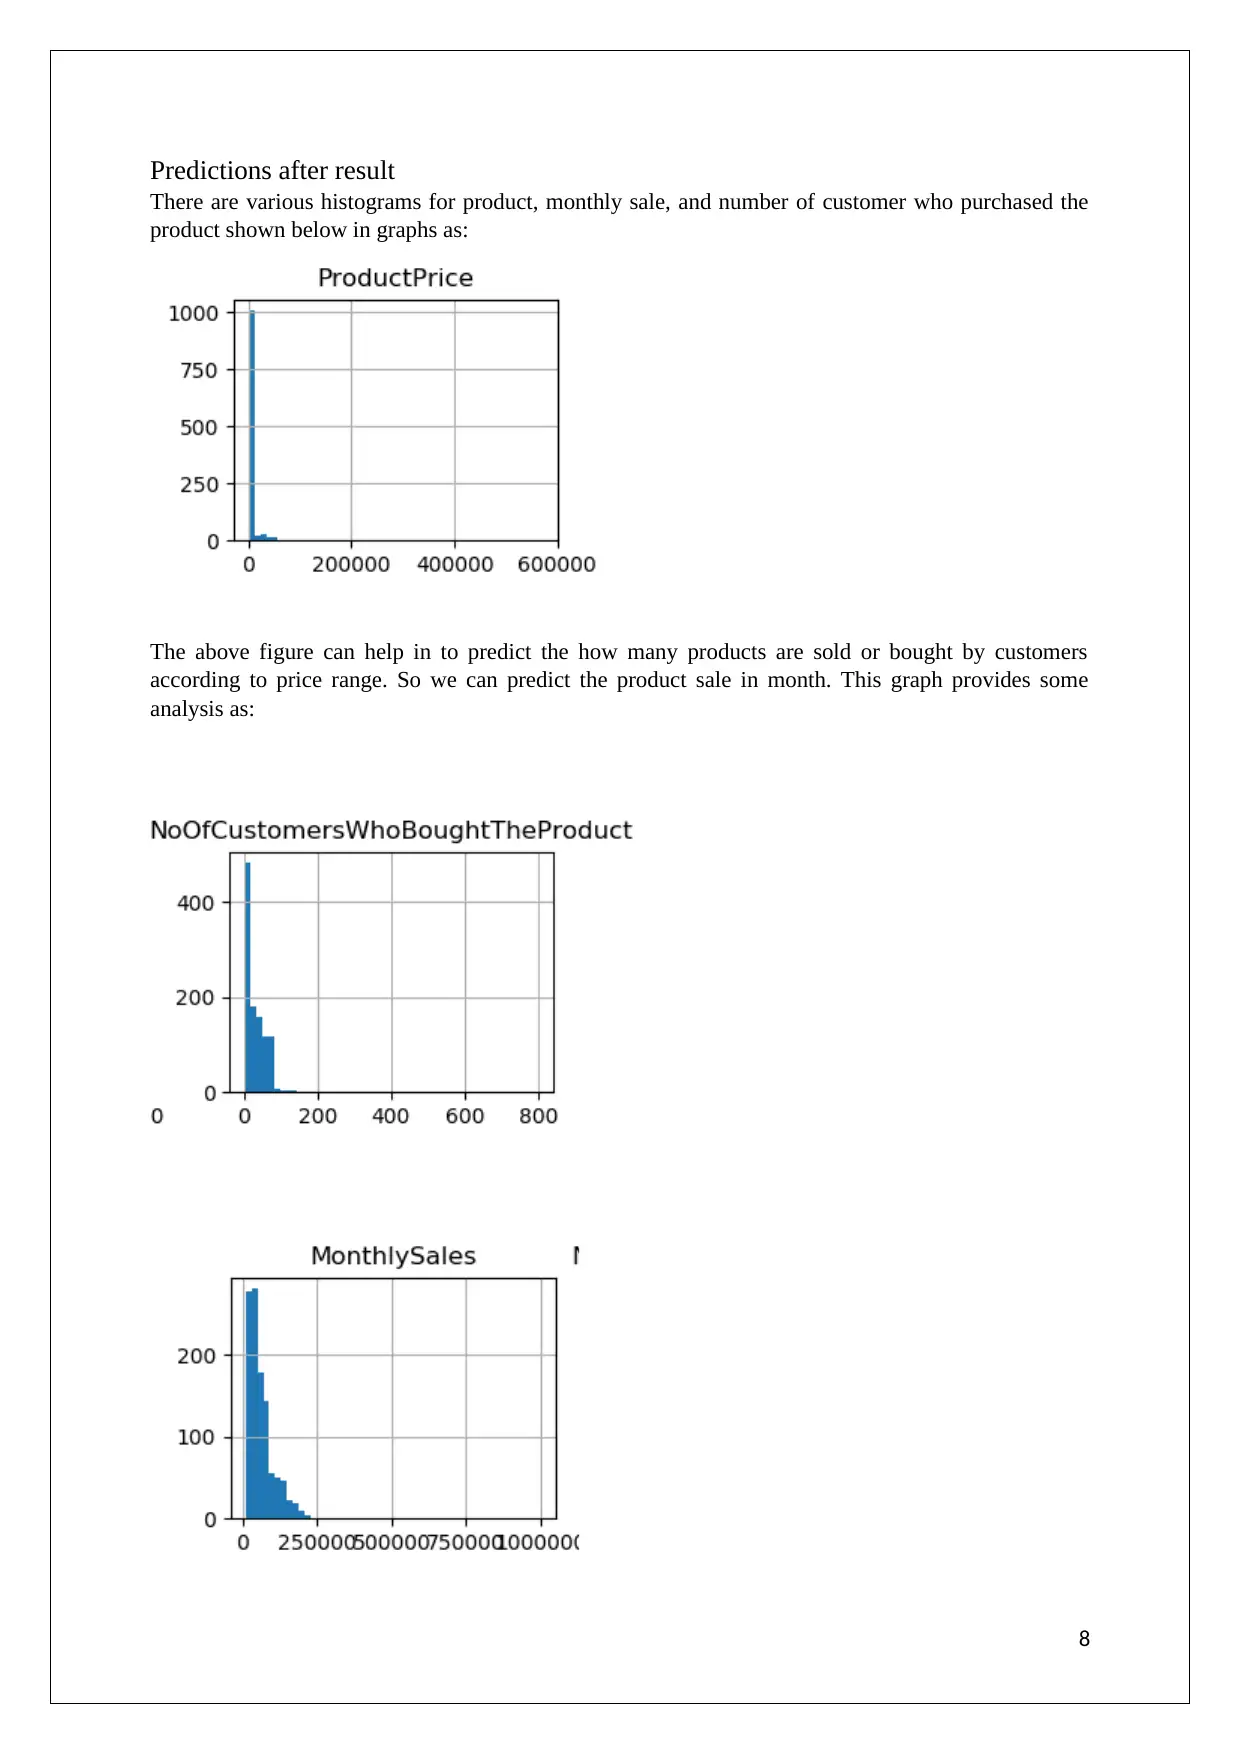
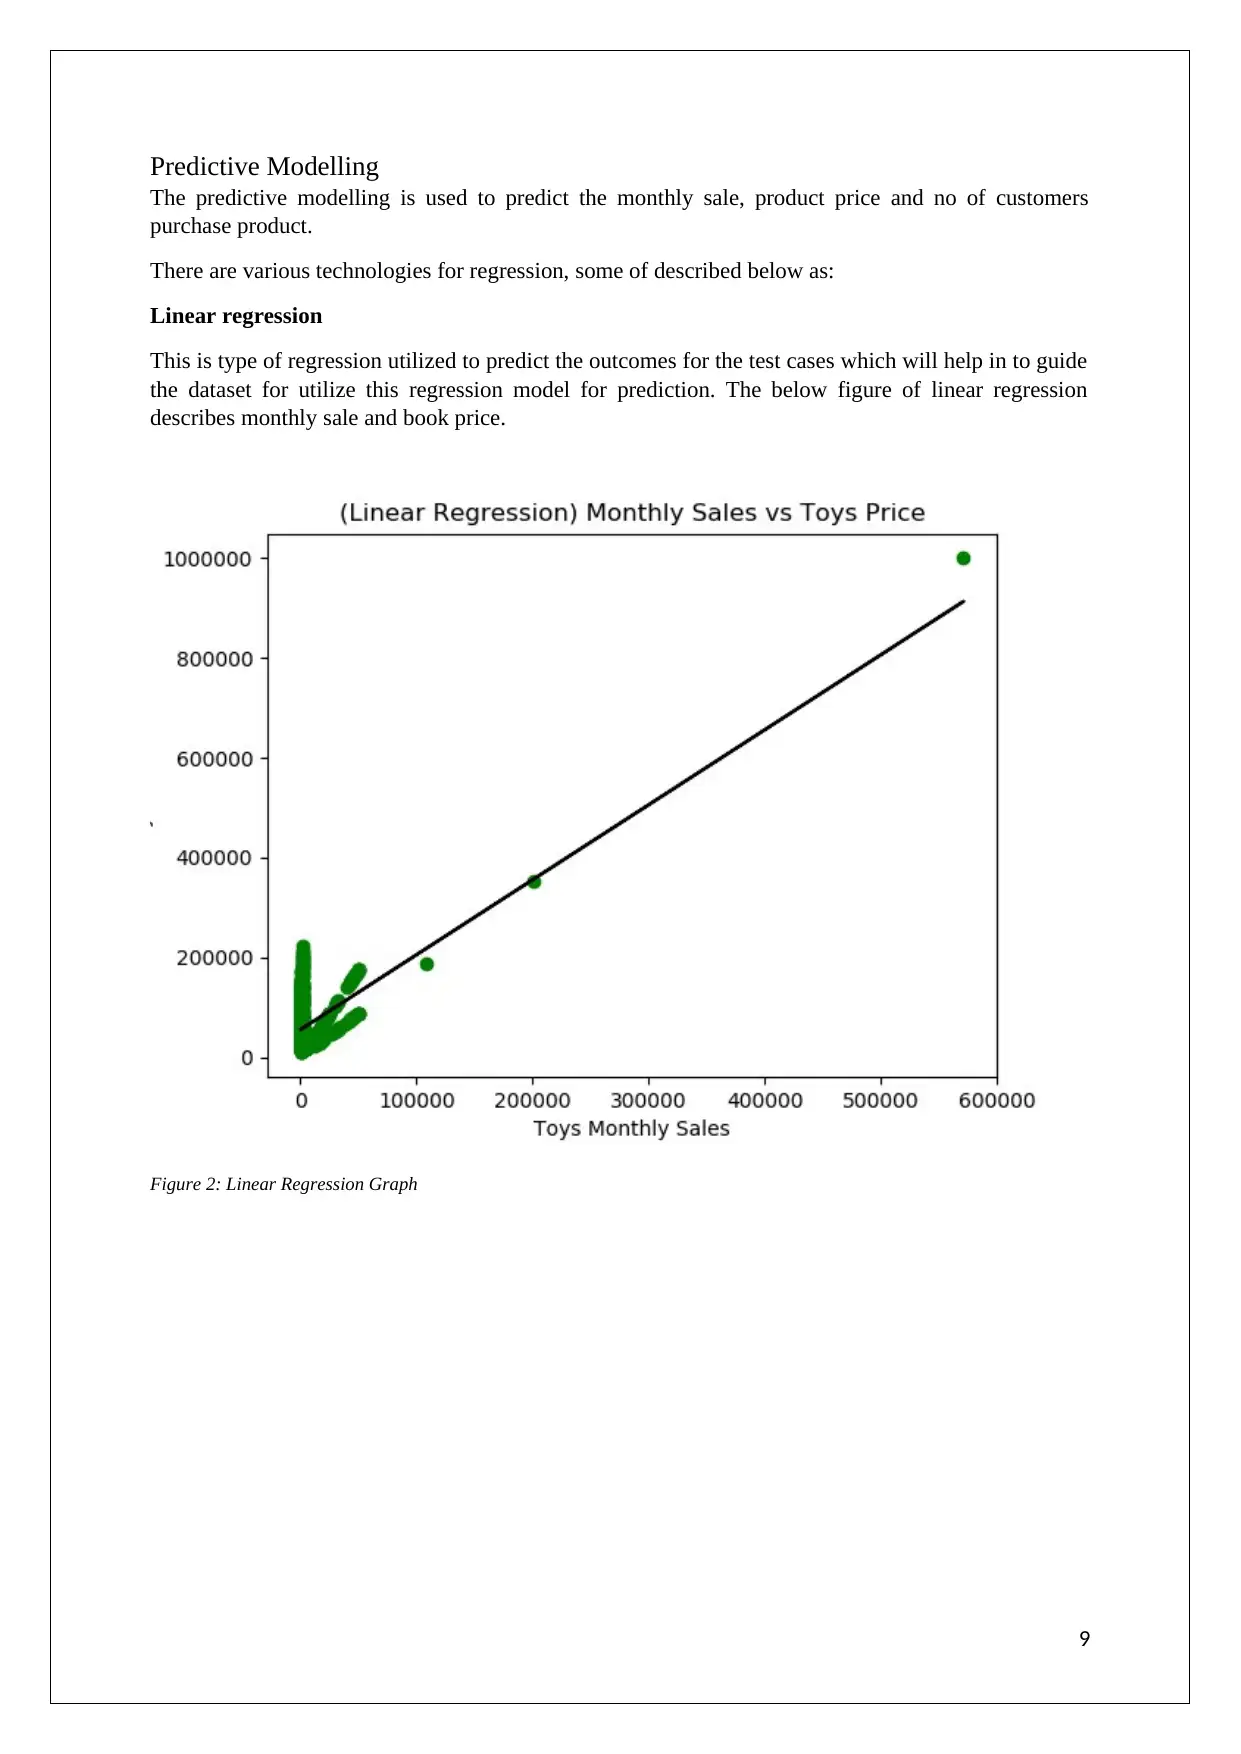
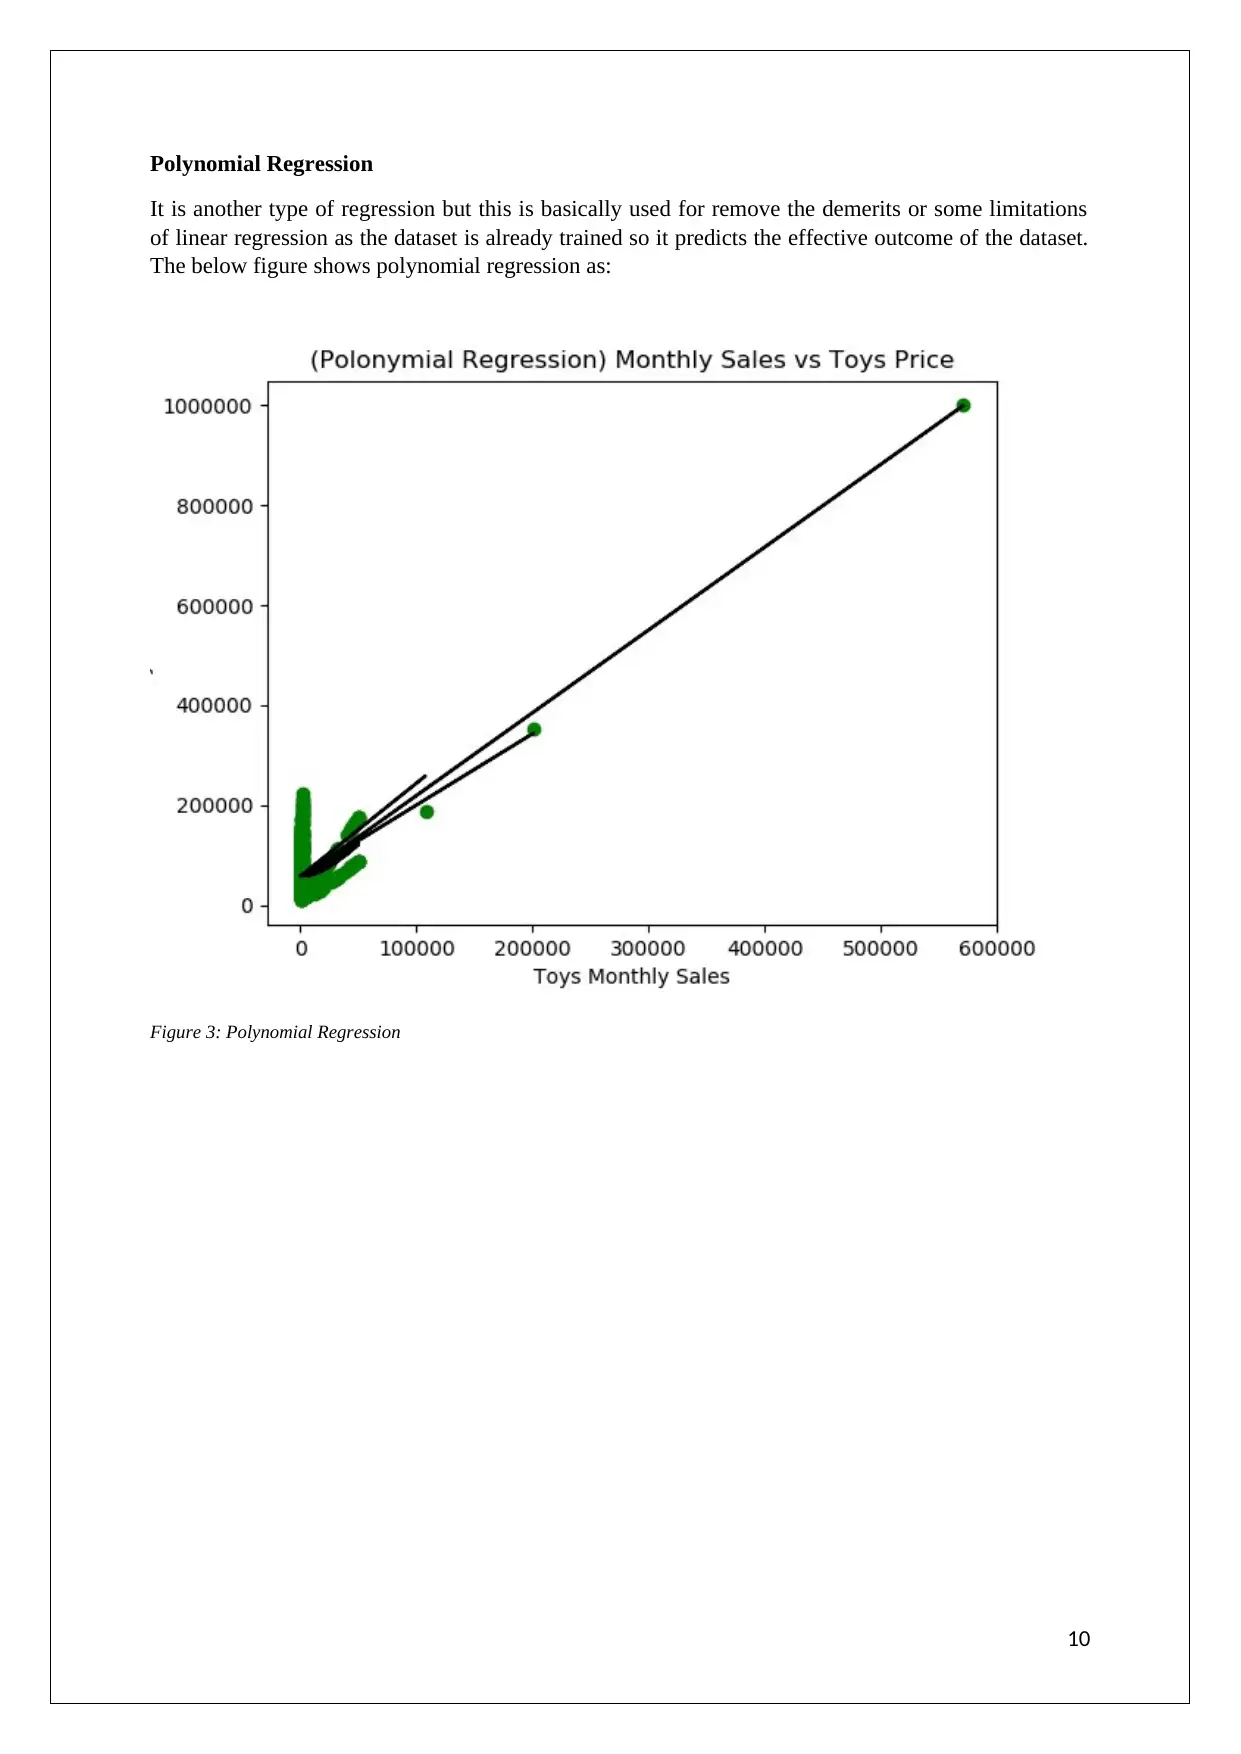
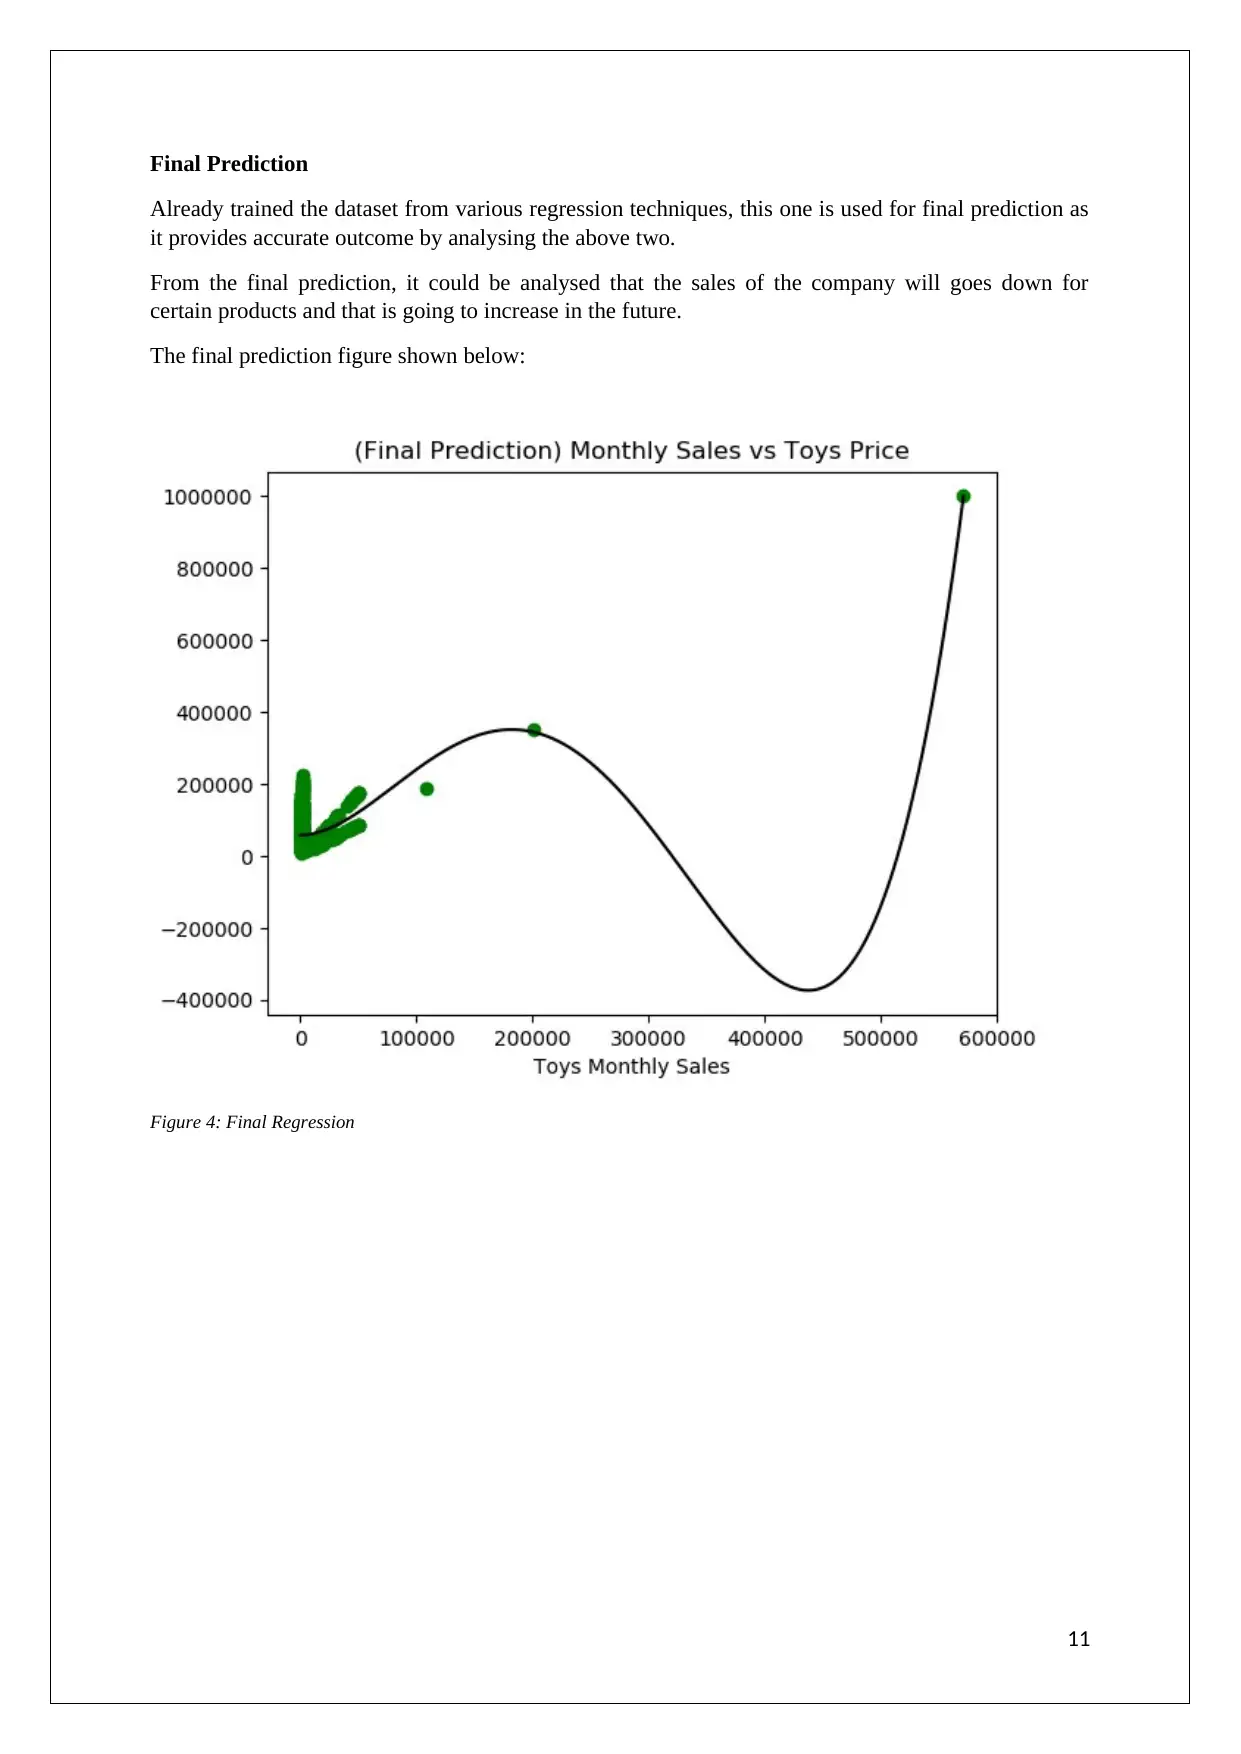
This report analyzes the sales data of an e-commerce company to identify factors affecting its performance and provide recommendations for growth. The project employs data mining techniques and regression models to predict sales trends and understand customer behavior across various produ...
Read More
Contribute Materials
Your contribution can guide someone’s learning journey. Share your
documents today.

ICT706
Data Analytics
Assignment Task 2
Research Project
Data Analytics
Assignment Task 2
Research Project
Secure Best Marks with AI Grader
Need help grading? Try our AI Grader for instant feedback on your assignments.

Executive Summary
This project is for an E-commerce company which is market leader provide various kinds of products.
Nowadays compete with the market is not an easy task so, this organisation want to grow and
compete with the market and to enhance this company hires a data scientist who analyse the sale of
company, provide business analytics to grow their business and analyse the product segments in
various geographic regions.
The aim of this document is to find the solution by giving business analytics which might be affect the
performance of organisation which is decreasing on daily basis. The data scientist analysing the
company’s sale for each product domain through dataset which contains attributes of organisations
product. For analysing the product attributes, a dataset is composed which contain at least 1000
products which will help to analyse.
1

Table of Contents
Assumptions Made................................................................................................................................4
Introduction...........................................................................................................................................5
Research Methodology..........................................................................................................................6
Quantitative Research........................................................................................................................6
Qualitative Research..........................................................................................................................6
Analytical Findings...............................................................................................................................7
Data mining.......................................................................................................................................7
Data clustering...................................................................................................................................8
Predictions after result.......................................................................................................................9
Predictive Modelling.......................................................................................................................10
Implemented Code:..........................................................................................................................13
Recommendations from analysis:........................................................................................................15
First Recommendation.....................................................................................................................15
Second Recommendation................................................................................................................15
Third recommendation.....................................................................................................................15
Fourth Recommendation.................................................................................................................15
Recommendation for the company......................................................................................................16
Implementation plan for the recommendations....................................................................................16
Conclusion...........................................................................................................................................17
Appendix.............................................................................................................................................18
List of Figures
Figure 1: Toys Dataset...........................................................................................................................8
Figure 2: Linear Regression Graph......................................................................................................10
Figure 3: Polynomial Regression.........................................................................................................11
Figure 4: Final Regression...................................................................................................................12
Figure 5: Code for Regression.............................................................................................................13
Figure 6: Histogram generation Function............................................................................................14
Figure 7: Test and Training Data.........................................................................................................14
2

Assumptions Made
There are some assumptions made for analyse the performance to accomplish better result as follows:
1. A toys Dataset is produced for analysing
2. Dataset composed on the basis of products attributes for Toys
3. Dataset comprise of different geographic regions where items are delivered through
organisation
4. Various product attributes are included in dataset
5. Delivery department delivers the products provided by organisation
3
Secure Best Marks with AI Grader
Need help grading? Try our AI Grader for instant feedback on your assignments.

Introduction
The report is composed for an e-commerce business which is a market leader but nowadays its
performance is decreasing and profits too. This e-commerce provides various products as books,
gadgets, toys and many more with delivery option. The organisation hires a data scientist for
analysing the sale of various products to compete with the market and grow their performance after
analyses the aspects. In this project, data mining methodologies and regression properties applying for
getting the knowledge to plan strategies and apply to accomplish performance with profit. This report
analyse the researches and analytical finding which help in measure the results.
4

Research Methodology
The methodologies for research are a main task to accomplish requirements through gathering of
information which will retrieve the data from various resources and analyse it for identifying the
issues occurs.
The following are types of methodology as follows:
Quantitative Research
1. To evaluate data and sum up comes about because of an example to the number of inhabitants
in intrigue
2. To gauge the rate of diverse perceptions and feelings in a selected test
Pros and cons:
The pros and cons of quantitative research are as it provides more objectives to analyse and for
testing, it can utilize hypothesis and its main disadvantage is it is more complex in nature.
Qualitative Research
1. To choice a understanding of important explanations and encouragements.
2. To provide bits of information into the setting of an issue, constructing thoughts as well as
theories for future quantitative research
3. To expose major designs in thought and emotion
Pros and Cons:
The pros and cons of this as it can manage more complex data and utilize hypothesis much better then
quantitative but its main disadvantage is it requires more time and sometime create an issue of
overloading.
5

Analytical Findings
These findings will help to determine the output in analytical way as this methodology contains
various functions to analyse the outputs. There are some functions which explain in better way as:
Dataset
It is collection which consists of various data and metadata also such as:
1. Name of Product,
2. Price of Product,
3. Type of Shipping (free or customer paid),
4. Monthly Sales ($),
5. Region in Geographical way,
6. No. Of customers who bought the product,
7. Customer type (New or existing),
8. Production Year
In this assignment, I used the toy dataset for prediction.
Data mining
This technique sis utilized for fetching the data which is required from dataset and removes the
unwanted data. It has 5 phases for fetching as:
1. Identifying the information of source
2. For analysing, gather the data and pass to next step
3. From gathered data, required data extracting
4. From extracted data identify the values which are required
5. Provide the final output
The analyst can predict the data by following these steps of data mining and the purpose of this
technique is to extract required data and apply for better results.
6
Paraphrase This Document
Need a fresh take? Get an instant paraphrase of this document with our AI Paraphraser

Figure 1: Toys Dataset
Data clustering
The technique of clustering is utilized to maintain the tolerance of fault, balance load, multi-
processing and more based on the objects which are in group. Data mining is applied on various
schemas of this project which specifies clustering of data for analysing using python language
understands through graph as:
7

Predictions after result
There are various histograms for product, monthly sale, and number of customer who purchased the
product shown below in graphs as:
The above figure can help in to predict the how many products are sold or bought by customers
according to price range. So we can predict the product sale in month. This graph provides some
analysis as:
8

Predictive Modelling
The predictive modelling is used to predict the monthly sale, product price and no of customers
purchase product.
There are various technologies for regression, some of described below as:
Linear regression
This is type of regression utilized to predict the outcomes for the test cases which will help in to guide
the dataset for utilize this regression model for prediction. The below figure of linear regression
describes monthly sale and book price.
Figure 2: Linear Regression Graph
9
Secure Best Marks with AI Grader
Need help grading? Try our AI Grader for instant feedback on your assignments.

Polynomial Regression
It is another type of regression but this is basically used for remove the demerits or some limitations
of linear regression as the dataset is already trained so it predicts the effective outcome of the dataset.
The below figure shows polynomial regression as:
Figure 3: Polynomial Regression
10
It is another type of regression but this is basically used for remove the demerits or some limitations
of linear regression as the dataset is already trained so it predicts the effective outcome of the dataset.
The below figure shows polynomial regression as:
Figure 3: Polynomial Regression
10

Final Prediction
Already trained the dataset from various regression techniques, this one is used for final prediction as
it provides accurate outcome by analysing the above two.
From the final prediction, it could be analysed that the sales of the company will goes down for
certain products and that is going to increase in the future.
The final prediction figure shown below:
Figure 4: Final Regression
11

Implemented Code:
The screenshots of implemented code as follows:
Figure 5: Code for Regression
12
The screenshots of implemented code as follows:
Figure 5: Code for Regression
12
Paraphrase This Document
Need a fresh take? Get an instant paraphrase of this document with our AI Paraphraser

Figure 6: Histogram generation Function
Figure 7: Test and Training Data
13
Figure 7: Test and Training Data
13

Recommendations from analysis:
There are various recommendations which are decided upon analysis in the regression models. The
recommendations are which is very high and can be utilized by the organisation.
First Recommendation
The organisation should centre on those areas where they have fewer users and this will help to build
the sales for their growth and profit as it increases customers gradually by reaching to most of the
regions.
Second Recommendation
The toys should be provided with less or normal price as they’re gone because of high cost and
provided in 2009. Nowadays if company want to grow in the market then produce new toys with
effective cost to compete with others and make some profit.
Third recommendation
There are customers of two types as old and new and if company wants to increase their sale then
provide free shipping which will gradually affect the performance of sale and gives better result than
before. As of now the ratio of delivery charges vs free shipping as 732:439 and to reflect this by vice
versa then company should provide free shipping in various regions.
Fourth Recommendation
1. The company should provide their products in various regions where chances are more for
profit and purchasing.
2. They should deliver product to customer as soon as possible i.e., fast delivery or speed
delivery.
3. Company should provide methods for payment or payment model in their site along with
tracking of their order which will help to increase their customer because of these some
features.
4. Company should clear their stock or replace with new one as these products are not ordered
or purchased by anyone in past few days.
14

Recommendation for the company
There is some recommendation for company for their growth and profit as:
They should provide offers on their products as per season
They should provide free shipping in various regions
They should provide interactive user interface for easier to handle by customers.
They also introduce return policy which will help in making trust for customers.
For enhancement of performance of company, they should provide speed delivery option.
Company should take care of stock in warehouse as per the need of customer by estimation
on past orders.
Implementation plan for the recommendations
The above recommendation provides implementation plan and strategies to perform as:
They should give this project tender to some developer who can provide fully functional
system and interactive user interface.
They need to maintain warehouse with required stock as per need of customers which can be
analysed.
Company need to deliver the order as soon as possible or within 2 days as speed delivery.
They need to start marketing and sale of products through advertisements and provide
facilities in most of the various.
Company should provide return and payment methods which will help to customer for 99%
confirmation of order that customer will take.
15
Secure Best Marks with AI Grader
Need help grading? Try our AI Grader for instant feedback on your assignments.

Conclusion
This report concludes that the e-commerce business provides a platform to customers for purchasing
their products which will increase their performance of production and predict the sales. As these days
company decreases their performance a not providing some beneficial facilities and not giving new
stock. So this company hire a data scientist who can analyse the sale and performance and can provide
methodologies to enhance their performance and growth. This report consist of various regression
techniques which help to predict the outcomes and sale of products along with recommendation for
enhancing the business and reach out to various geographical regions. This report give
recommendation to company for implementation accordingly to recommendation and make new plan
and strategies by setting goal to accomplish target and increase their performance and sale for profit
and compete with market.
16

Appendix
17
17
1 out of 18
Related Documents

Your All-in-One AI-Powered Toolkit for Academic Success.
+13062052269
info@desklib.com
Available 24*7 on WhatsApp / Email
Unlock your academic potential
© 2024 | Zucol Services PVT LTD | All rights reserved.