Developing Global Management Competencies: Data Analysis in Football

Verified

Added on  2021/01/01

|17
|2401
|102
Report
AI Summary
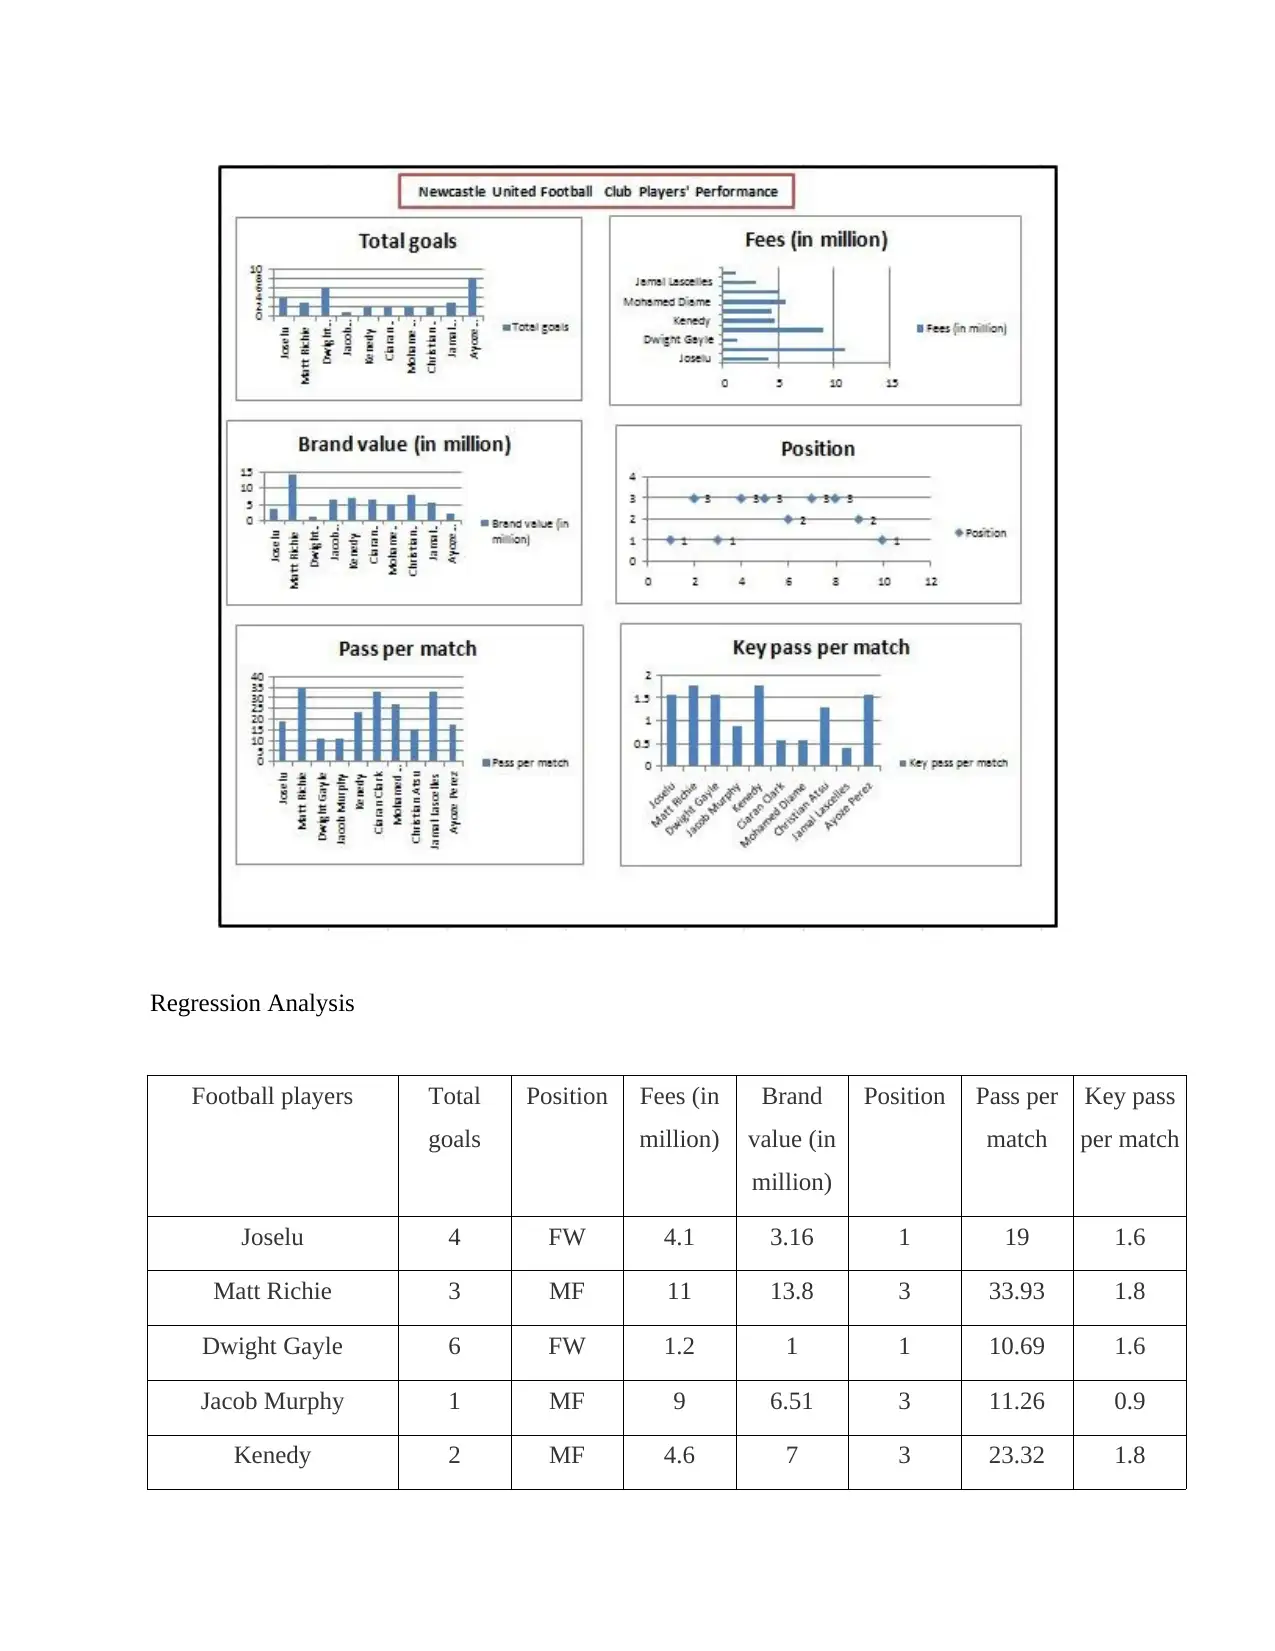
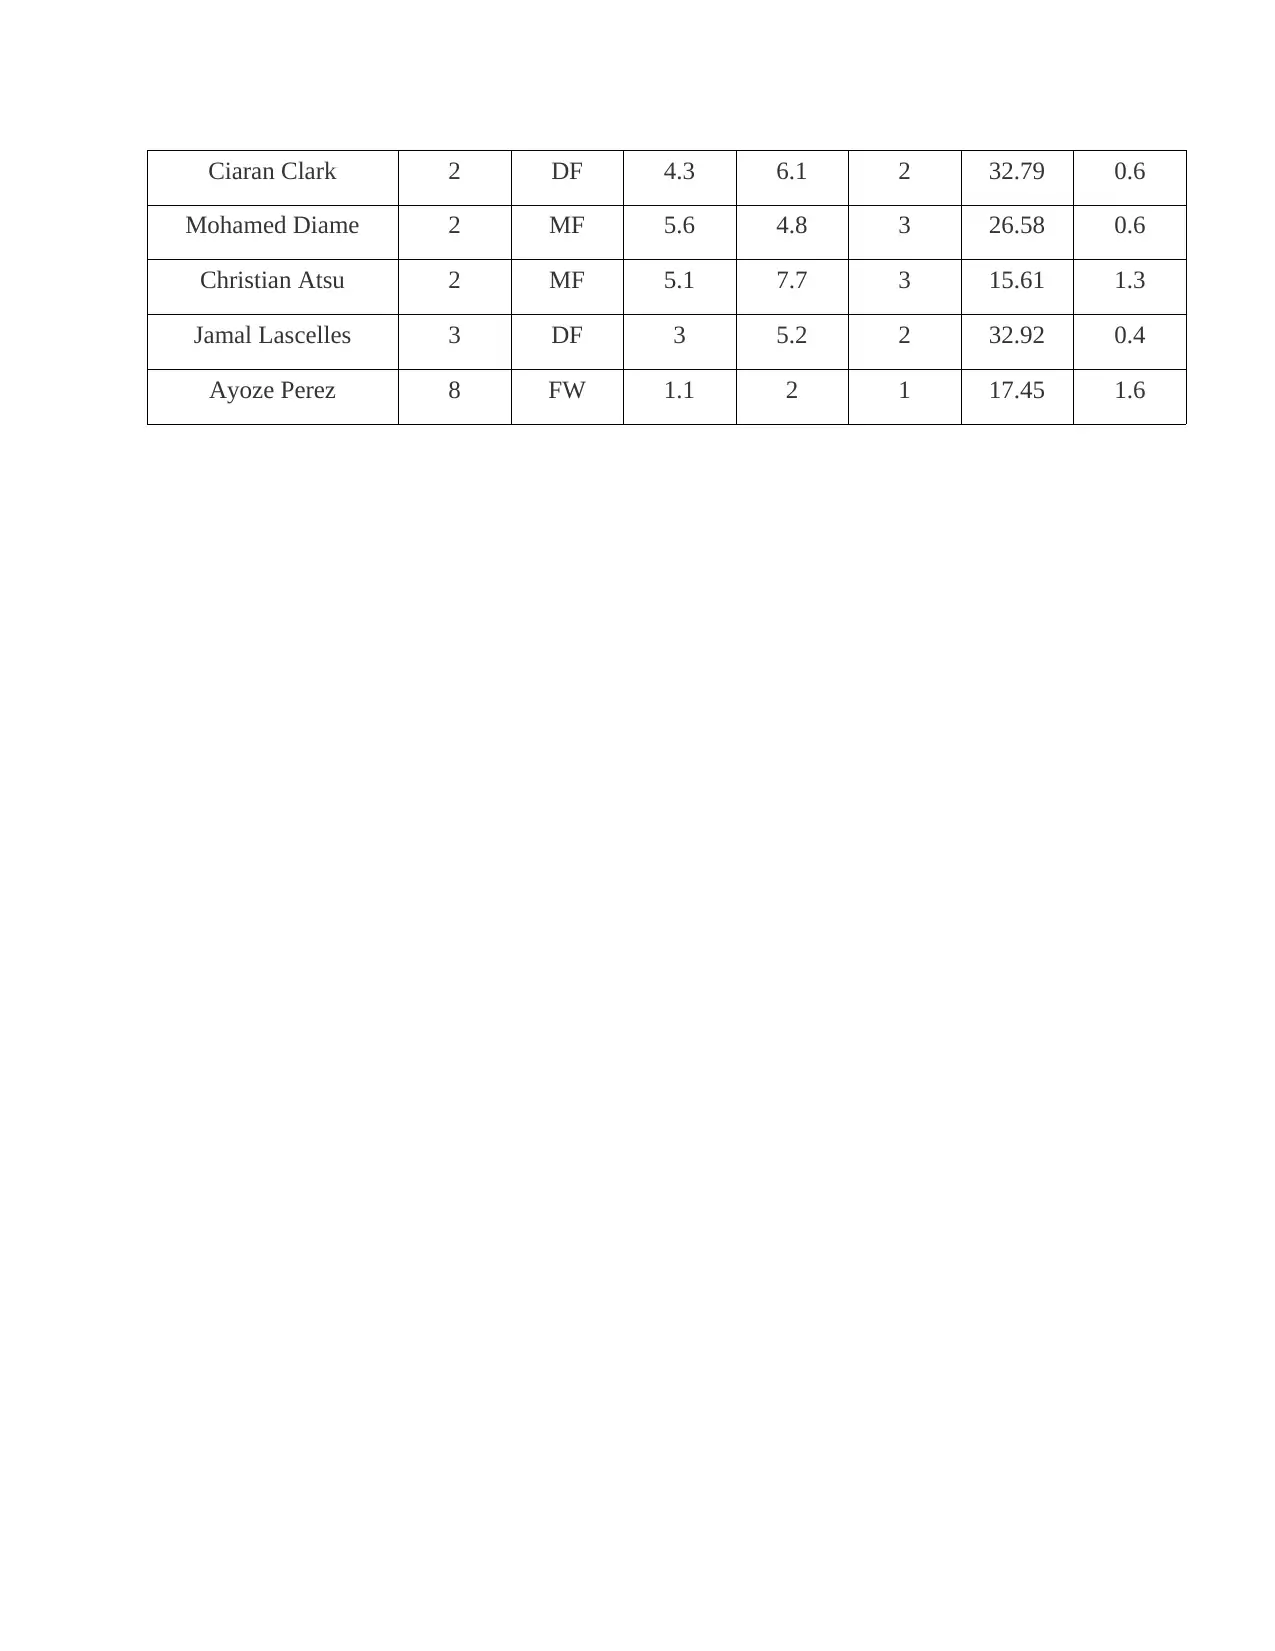
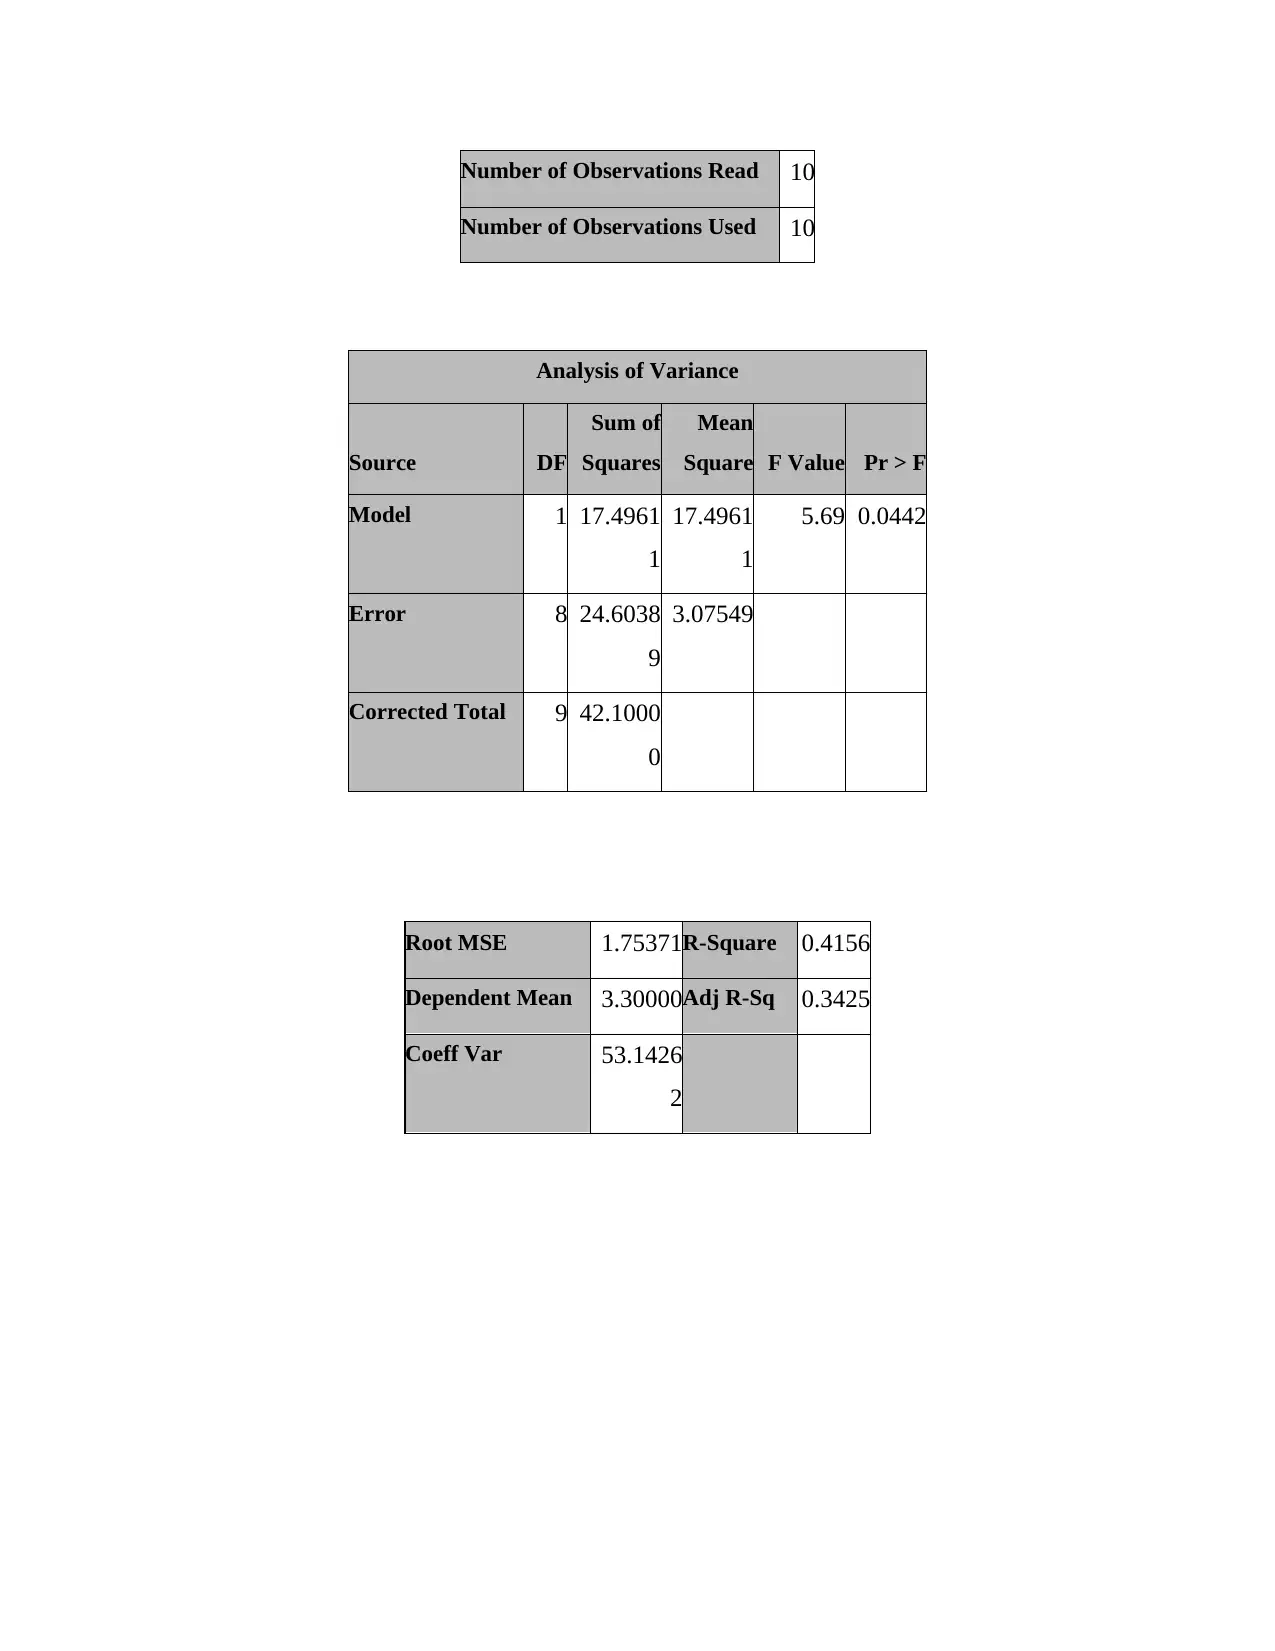
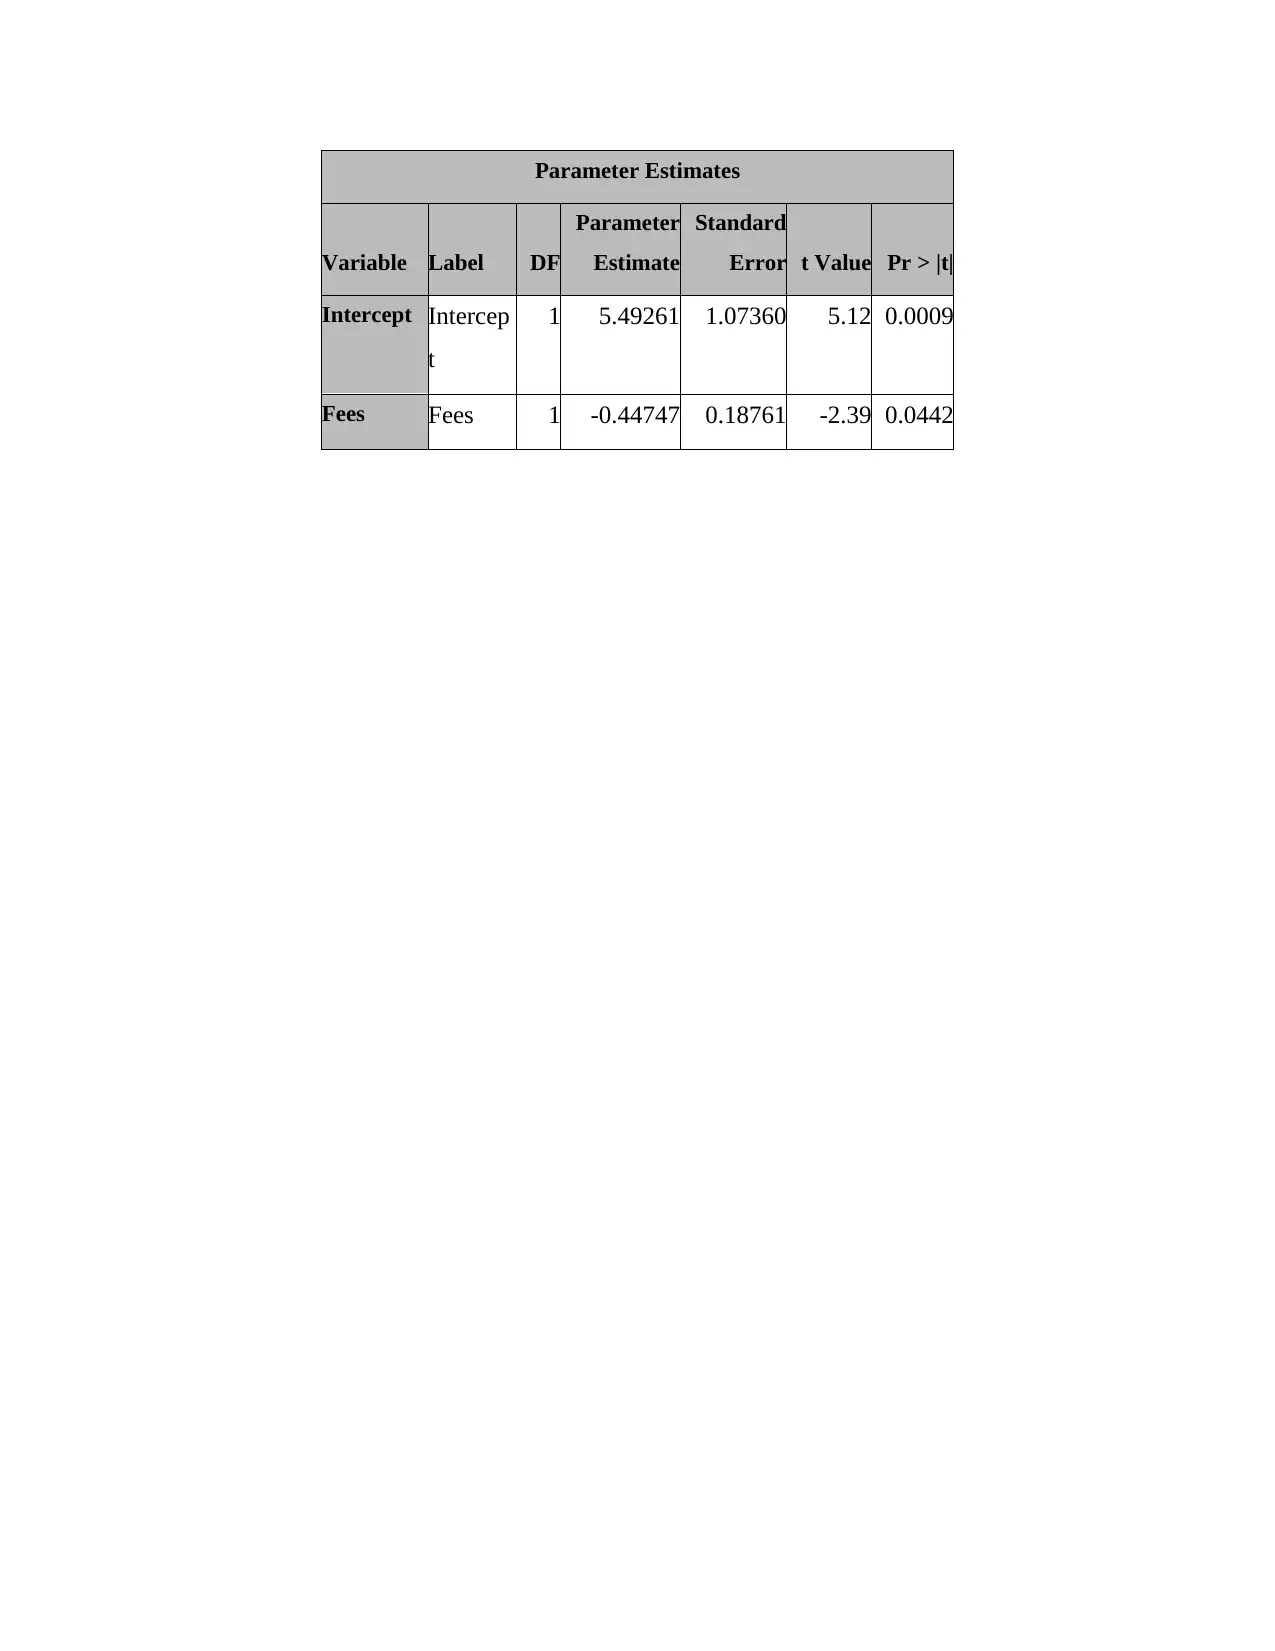
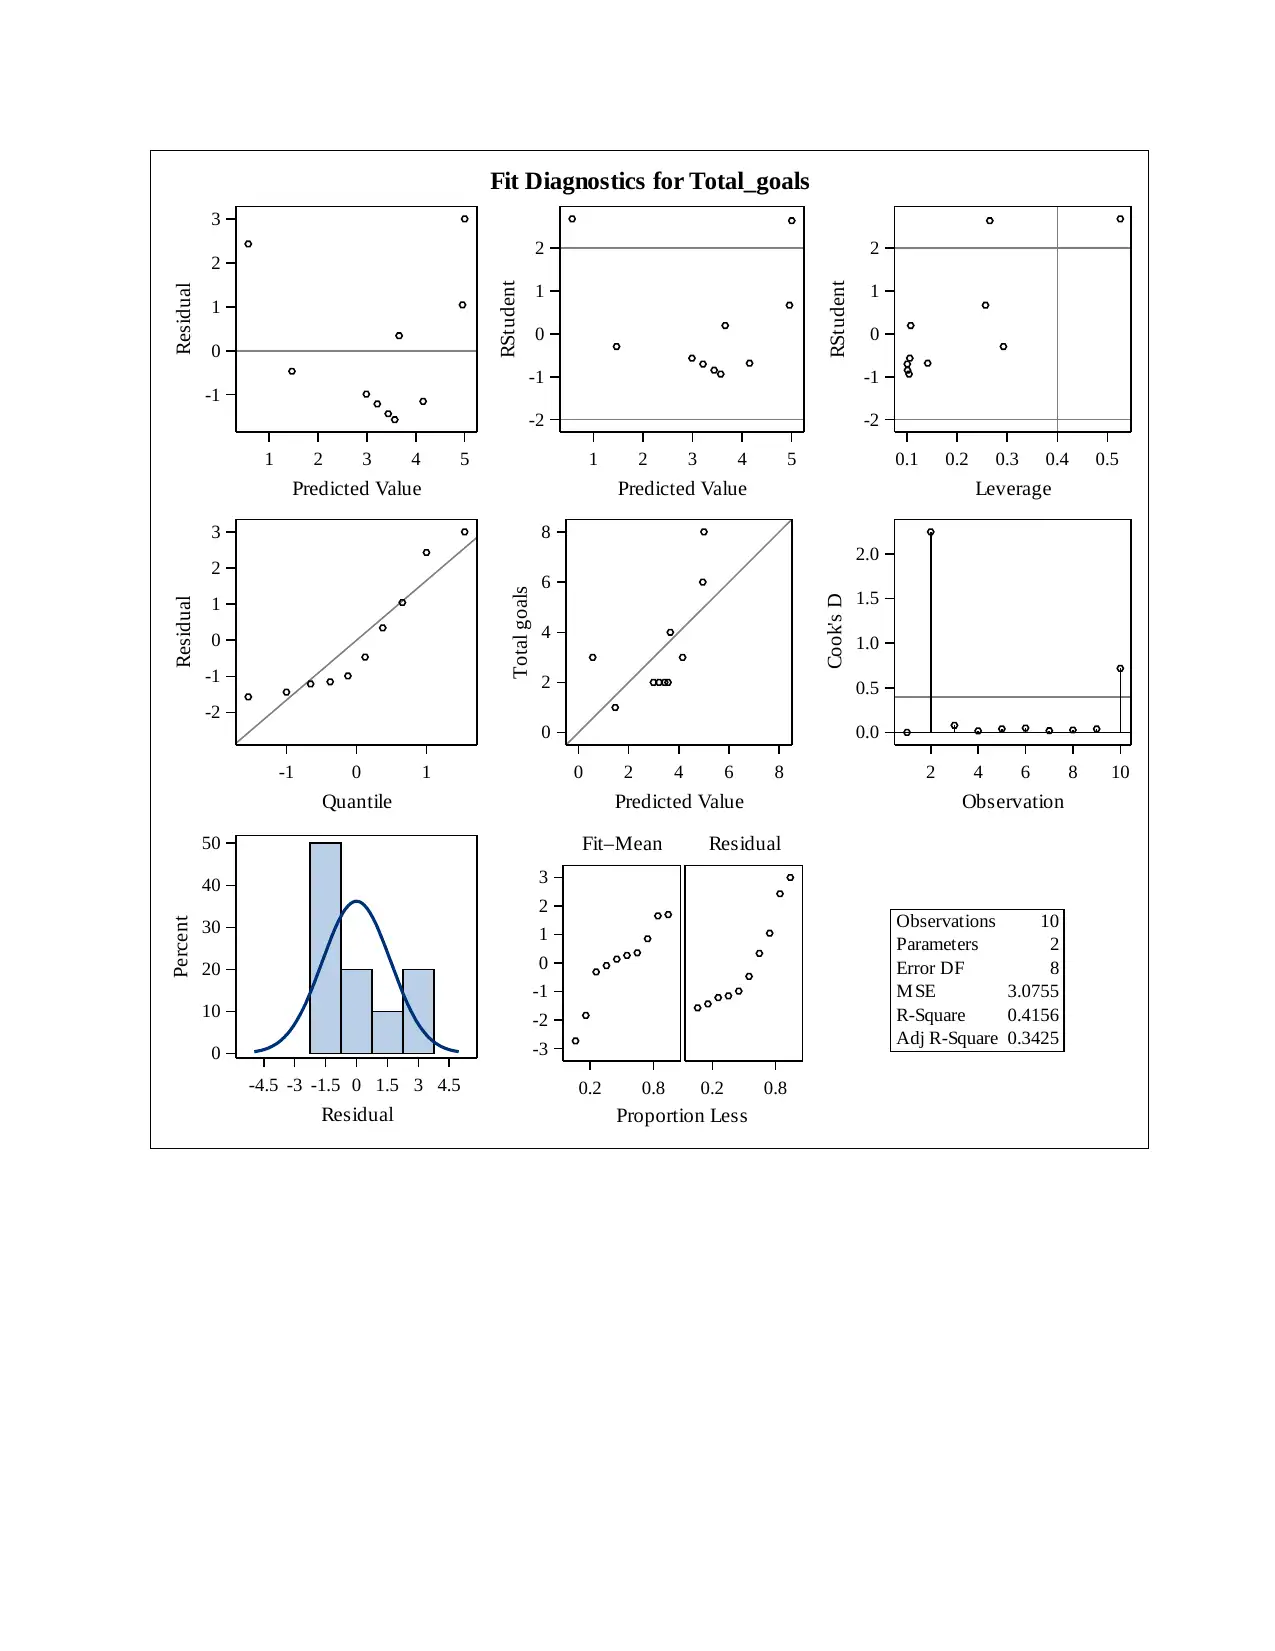
This report examines the application of data analytics and business intelligence within Newcastle United Football Club. The analysis begins by identifying the problem of optimizing player fees based on performance and the opportunity to leverage data analytics for improved decision-making. The report justifies the use of data analytics and business intelligence, highlighting tools like dashboards, regression analysis, and cluster analysis to evaluate player performance metrics such as goals scored, fees paid, brand value, and key passes. Through the use of dashboards, the report visualizes the relationship between player performance and compensation, and identifies areas for improvement in the fee structure. The analysis includes regression analysis to assess the impact of fees on goals scored and cluster analysis to group players based on similar characteristics. The report critically analyzes the findings, emphasizing the need to align player fees with performance and to penalize fouls to enhance productivity. The conclusion recommends the implementation of business intelligence and data analysis to optimize player performance and financial management within the club.
Document Page
Developing global
Management Competencies I
tabler-icon-diamond-filled.svg

Paraphrase This Document

Need a fresh take? Get an instant paraphrase of this document with our AI Paraphraser
Document Page
TABLE OF CONTENTS
INTRODUCTION...........................................................................................................................3
1. Statement of problem or opportunity along with system of Data Analytics and Business
Intelligence..................................................................................................................................3
2. Justifying an theoretical framework for relating statement of opportunity and problem along
with system of data analytics and business intelligence.............................................................4
3. Enumerating knowledge evidence with the help of Business Intelligence/ Data Analysis....5
4. Critical analysing and justifying usage of Business Intelligence/ Data Analysis...................9
5. Conclusion and recommendation regarding implementation of Business Intelligence/ Data
Analysis in Newcastle United Football club.............................................................................10
REFERENCES..............................................................................................................................11
Document Page
INTRODUCTION
Newcastle United Football club is considered as an English professional club which was
originated from merger in year 1982 (Newcastle United F.C, 2018). The duration of 1904 to
1910 is replicated as very successful as it had achieved victory of FA cup. In early 2000 had
gained its premiership by identifying its struggling period after gaining championship in season
of year 2017 -18. The present report would be providing huge insight with context of various
problems and performance which give impact of high level on football club's performance. It
would be also providing aspects of data analytics and business intelligence which helps in
assisting huge aspect in prominent manner. There is presence of various exhibits which provides
efficient and effective utilisation of Data analytics and business intelligence with reference to
Newcastle Football club.
1. Statement of problem or opportunity along with system of Data Analytics and Business
Intelligence
Football is known as very popular game in Europe as it viewed by numerous population.
As per each sector especially for football clubs all players are remunerated by considering level
of performance. By rule, if players have very good performance then they are paid by evaluating
this concept. But in present scenario, all players are playing in efficient aspect so there will
presence of new rule such as deduction on basis of foul of their own team. Hence, it could be
stated by considering skills and performance and differences in structure of payment of fees
through specific club to different low and high performers. So in the same series, fee structure
had to be developed by considering requirement of club for maintaining proper record of
performance along with foul in each game of particular players. The performance of each player
must be tracked and it should prepare appropriate structure of fees which is required in essential
format (Mendenhall and et. al., 2017).
The main objective of this study is to track that if huge monetary advantages had been
offered to superior players and to charge penalty because of foul so in this context they are
encouraged for limiting foul and to put the best efforts. Thus, the main problem which had been
observed by team of football association which is directly linked towards proper development of
Document Page
structure of fees. So in the same series, for evaluating problem, there will be creation of
dashboard with the help of excel as it would be providing an appropriate assistance for its
understanding through different aspects in graphical format. While comparing this theoretical
framework, format of graph had been considered as very attractive which leads for proper
understanding of specific data set in more effective aspect. So in the same series, business
intelligence also consist of wide tool range along with there methodology and application which
would be enabling particular business unit for collecting the data set from external and internal
sources as well and it is also analysed in specific format. The analytical system and business
intelligence is considered as very useful tool for forming reports along with dashboards and it is
also articulated in appropriate aspect of the situation which had been concerned.
SWOT Analysis
2. Justifying an theoretical framework for relating statement of opportunity and problem along
with system of data analytics and business intelligence
The system of data analytics and business intelligence is referred as very effective as it
would be giving an appropriate assistance for the purpose of evaluating problem and to provide
specific aid in process of decision making. In the present era, various institutions and
organisations gives special focus on undertaking any system of data analytics as it creates
efficiency in prospective of understanding and for evaluating issue in efficient aspect. There is
presence of different system of business analytic and its tools whose availability could be
implicated for preparation of dashboard is attractive manner like Excel, Tableau etc. The tool of
tabler-icon-diamond-filled.svg

Paraphrase This Document

Need a fresh take? Get an instant paraphrase of this document with our AI Paraphraser
Document Page
data visualisation could be implied through dashboard as it would be assisting for display present
status for key performance indicators and metrics in context of any particular business entity. It
is known as very effective system which would be creating help in arranging and displaying
various metrics, balance scorecard of performance and numbers on single screen. In the same
series, system of data analytics and SAS business intelligence helps in transforming specific data
set in better aspect of decision (Paley and et. al., 2017). It also consists of various techniques like
cluster analysis, regression etc. as these would be deriving appropriate value with reference to
specific data set.
So by considering Newcastle Football club, system of data analytic and business
intelligence like dashboard is replicated as very significant and along with this it clearly views
the exhibit about player's performance along with its penalty of foul. In the same series,
dashboard is also justifying structure of fees which had been paid along with deduction to
players by Newcastle football club. There has been appropriate presentation of graphs which are
providing deep understandings with context of specific data set along with particular aid for
making effective decisions. Hence, dashboard had been referred by association of football club
for developing an appropriate structure of fees with the following duration of contract. So in this
context, tool of regression analysis with reference to SAS justify the proper level in which one
factor or any variable is highly dependent on another one. So, in this specific software of SAS or
studio had been implied for evaluating impact of fees which had been paid on performance of
goal of specific player. With reference of cluster analysis, method of multivariate is helping for
the purpose of classifying a group or sample for abstract objects in particular classes of similar
aspect. Further, these specific statistical tool helps in providing a specific level of assistance
which is directly assessing that objects belongs to particular group which is similar in high
context instead of objects which are varied from other.
3. Enumerating knowledge evidence with the help of Business Intelligence/ Data Analysis
Dashboard
Document Page
Regression Analysis
Football players Total
goals
Position Fees (in
million)
Brand
value (in
million)
Position Pass per
match
Key pass
per match
Joselu 4 FW 4.1 3.16 1 19 1.6
Matt Richie 3 MF 11 13.8 3 33.93 1.8
Dwight Gayle 6 FW 1.2 1 1 10.69 1.6
Jacob Murphy 1 MF 9 6.51 3 11.26 0.9
Kenedy 2 MF 4.6 7 3 23.32 1.8
Document Page
Ciaran Clark 2 DF 4.3 6.1 2 32.79 0.6
Mohamed Diame 2 MF 5.6 4.8 3 26.58 0.6
Christian Atsu 2 MF 5.1 7.7 3 15.61 1.3
Jamal Lascelles 3 DF 3 5.2 2 32.92 0.4
Ayoze Perez 8 FW 1.1 2 1 17.45 1.6
tabler-icon-diamond-filled.svg

Paraphrase This Document

Need a fresh take? Get an instant paraphrase of this document with our AI Paraphraser
Document Page
Number of Observations Read 10
Number of Observations Used 10
Analysis of Variance
Source DF
Sum of
Squares
Mean
Square F Value Pr > F
Model 1 17.4961
1
17.4961
1
5.69 0.0442
Error 8 24.6038
9
3.07549
Corrected Total 9 42.1000
0
Root MSE 1.75371R-Square 0.4156
Dependent Mean 3.30000Adj R-Sq 0.3425
Coeff Var 53.1426
2
Document Page
Parameter Estimates
Variable Label DF
Parameter
Estimate
Standard
Error t Value Pr > |t|
Intercept Intercep
t
1 5.49261 1.07360 5.12 0.0009
Fees Fees 1 -0.44747 0.18761 -2.39 0.0442
Document Page
Fit Diagnostics for Total_goals
0.3425Adj R-Square
0.4156R-Square
3.0755M SE
8Error DF
2Parameters
10Observations
Proportion Less
0.2 0.8
Residual
0.2 0.8
Fit–Mean
-3
-2
-1
0
1
2
3
-4.5 -3 -1.5 0 1.5 3 4.5
Residual
0
10
20
30
40
50
Percent
2 4 6 8 10
Observation
0.0
0.5
1.0
1.5
2.0
Cook's D
0 2 4 6 8
Predicted Value
0
2
4
6
8
Total goals
-1 0 1
Quantile
-2
-1
0
1
2
3
Residual
0.1 0.2 0.3 0.4 0.5
Leverage
-2
-1
0
1
2
RStudent
1 2 3 4 5
Predicted Value
-2
-1
0
1
2
RStudent
1 2 3 4 5
Predicted Value
-1
0
1
2
3
Residual
tabler-icon-diamond-filled.svg

Paraphrase This Document

Need a fresh take? Get an instant paraphrase of this document with our AI Paraphraser
Document Page
2.5 5.0 7.5 10.0 12.5
Brandvalue
-2
0
2
4
Residual
Residuals for Fee
Document Page
2.5 5.0 7.5 10.0 12.5
Brandvalue
-2
0
2
4
Residual
Residuals for Fee
Regression Analysis
H0: There is no difference between goals made and fees paid to players
H1: There is difference between goals made and fees paid to players
It can be interpreted that value of P-value is 0.004 and of R Square is 0.41 which
highlights that there is significant difference between goals made and fees paid. These means
that when fees are increased, goals are also maximized leading to acceptance of null hypothesis.
Cluster Analysis
chevron_up_icon
1 out of 17
circle_padding
hide_on_mobile
zoom_out_icon
[object Object]