MITS6002 Business Analytics Assignment 1: Video Game Industry Analysis

Verified

Added on  2022/09/18

|7
|492
|29
Case Study
AI Summary
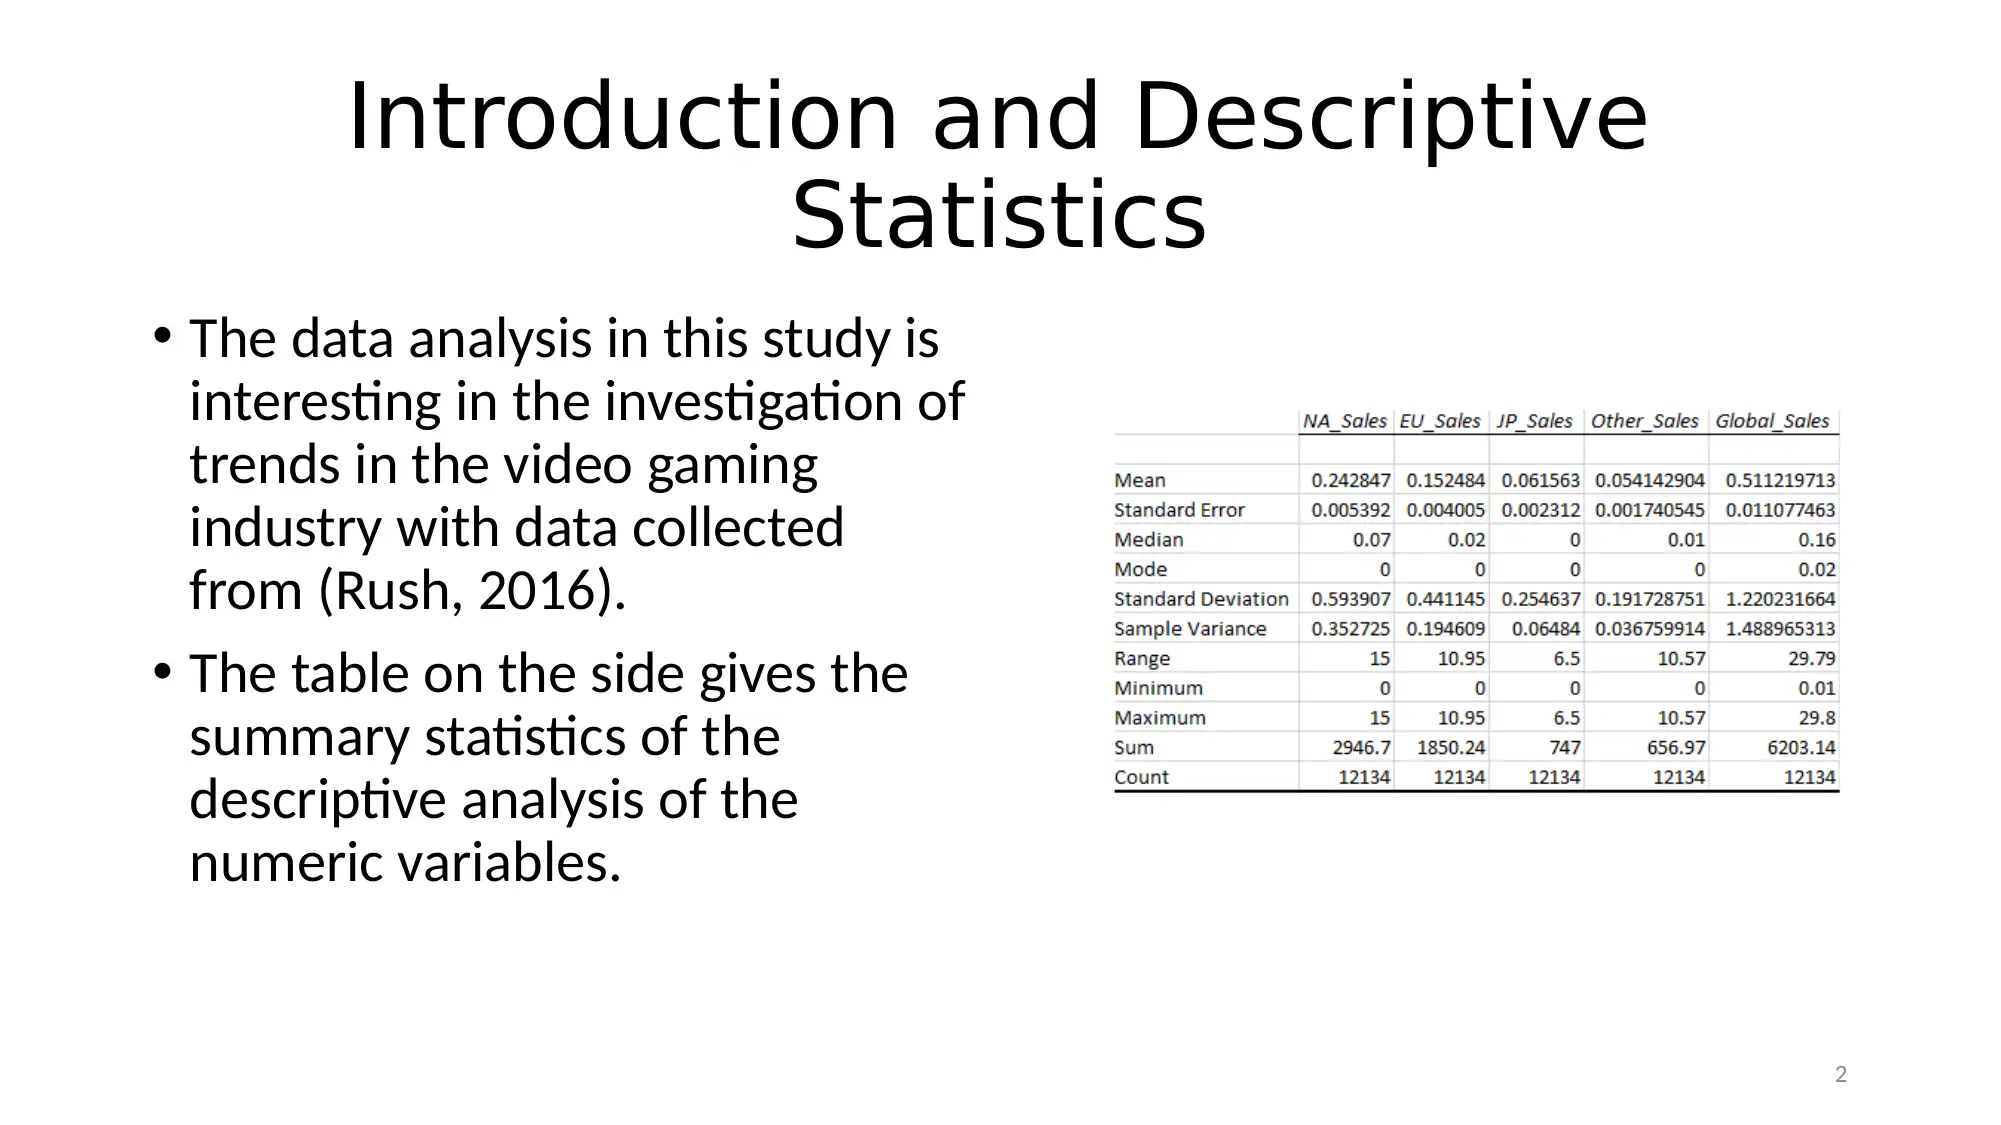
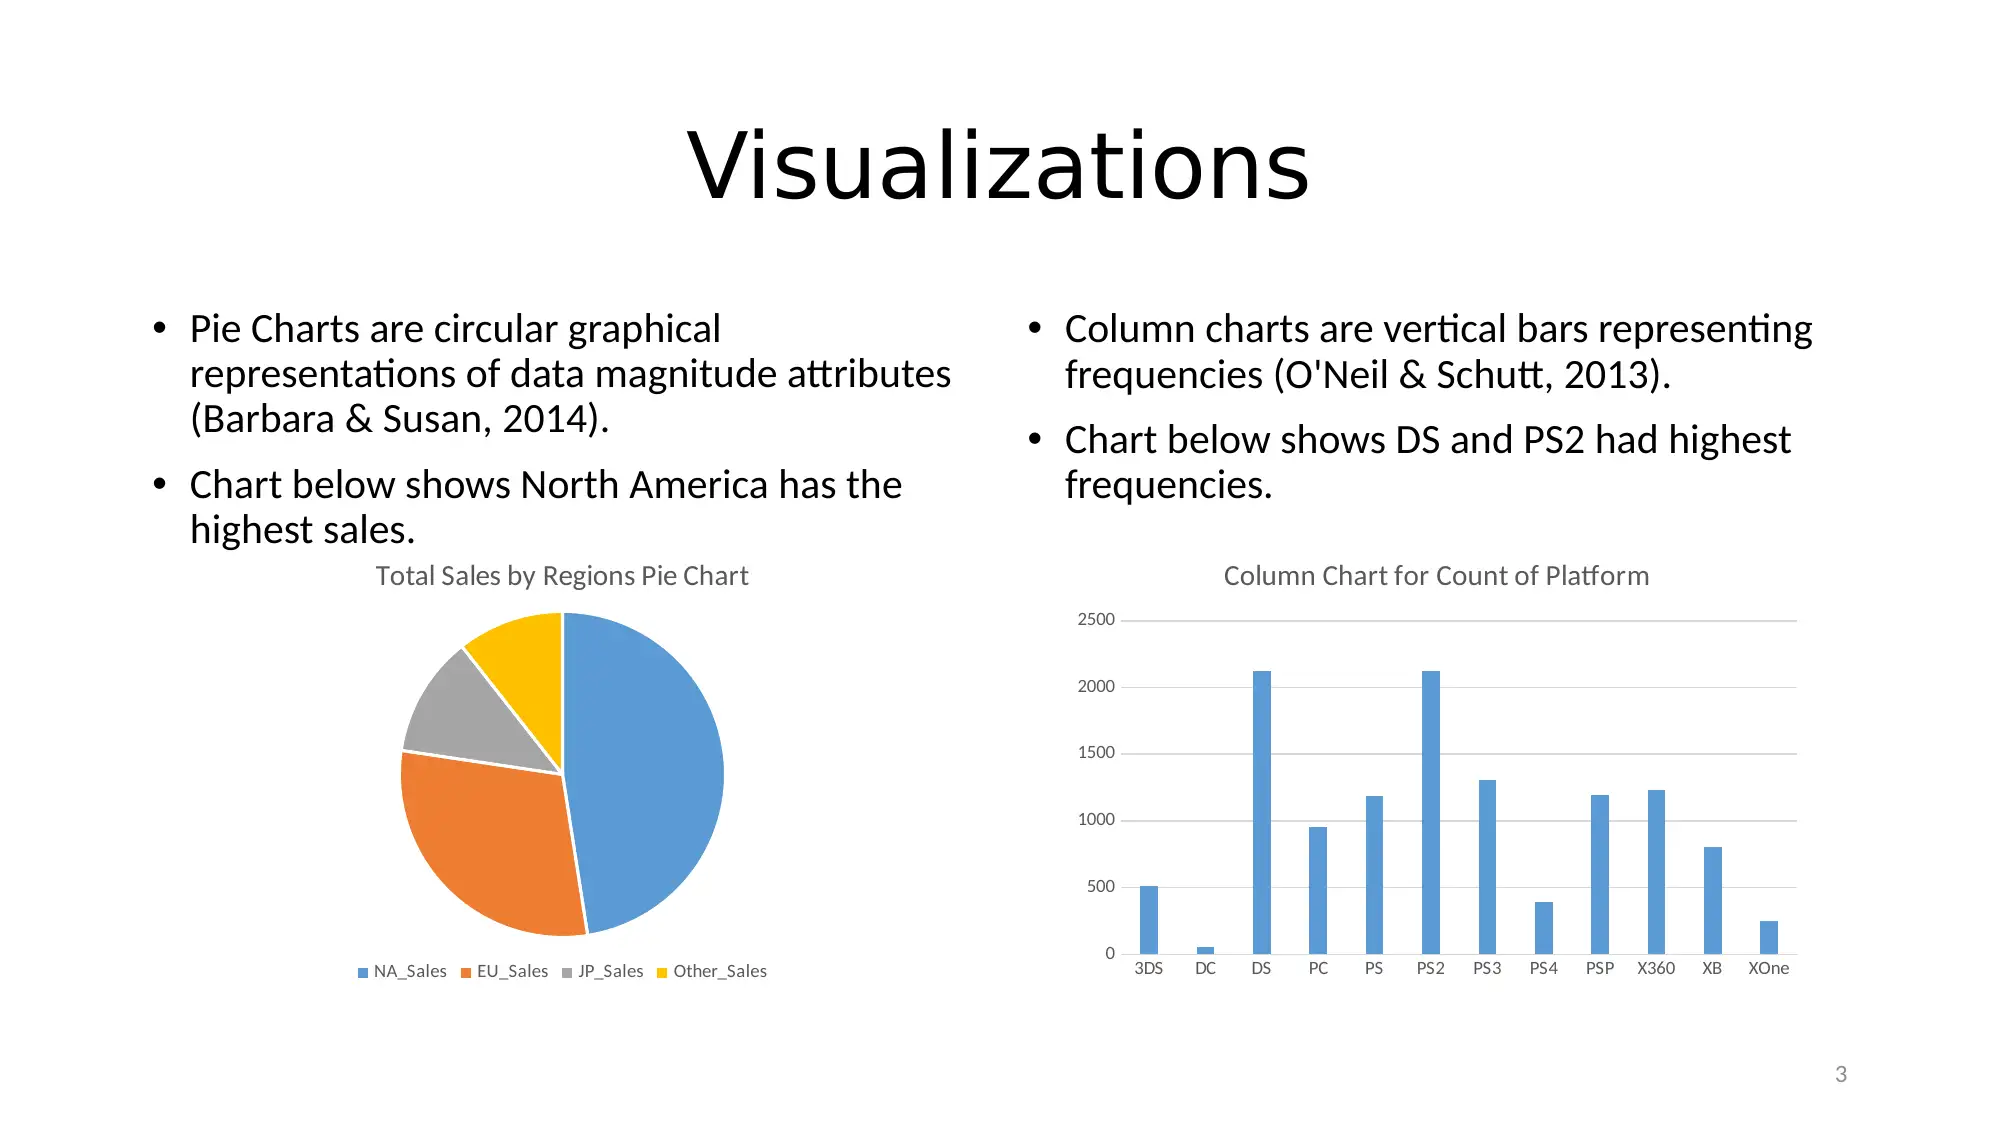
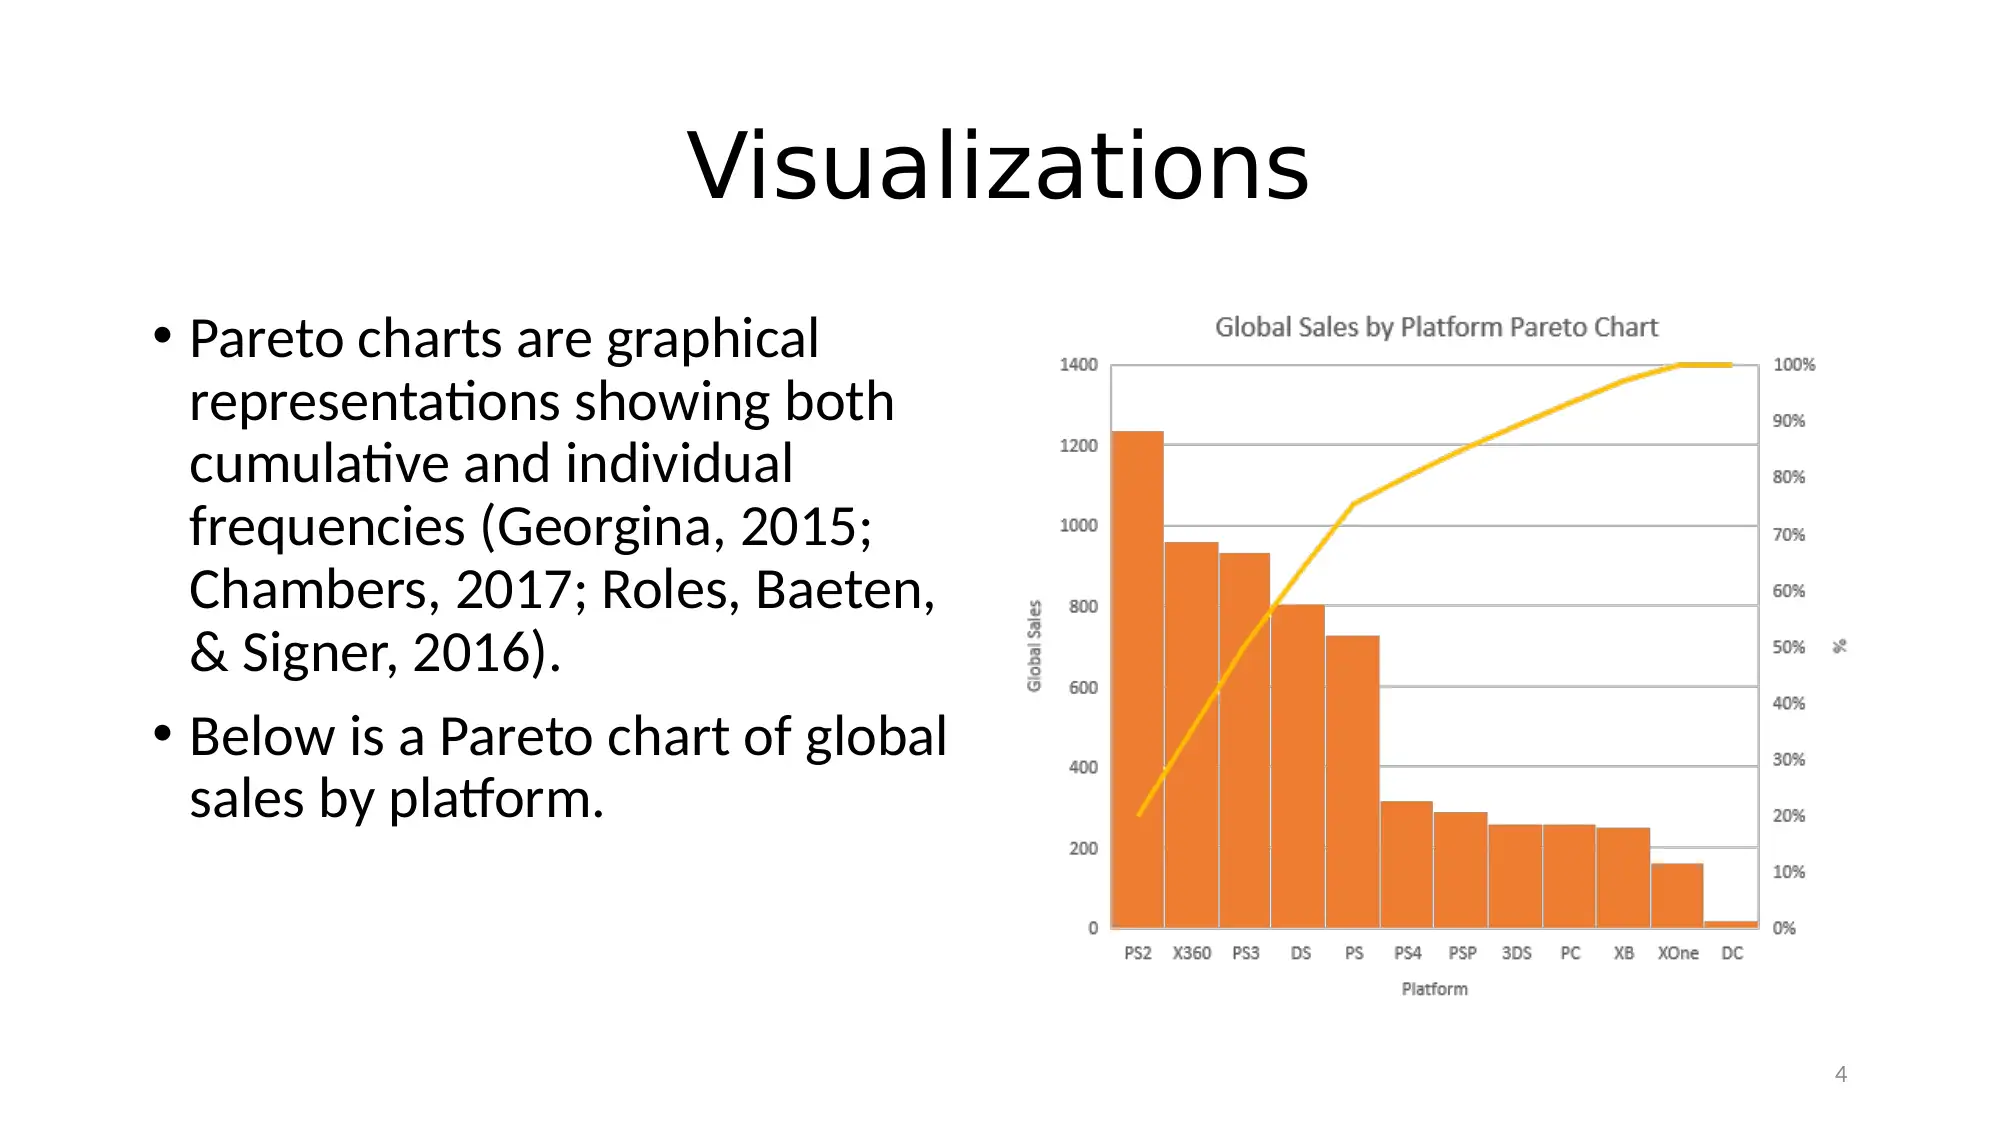
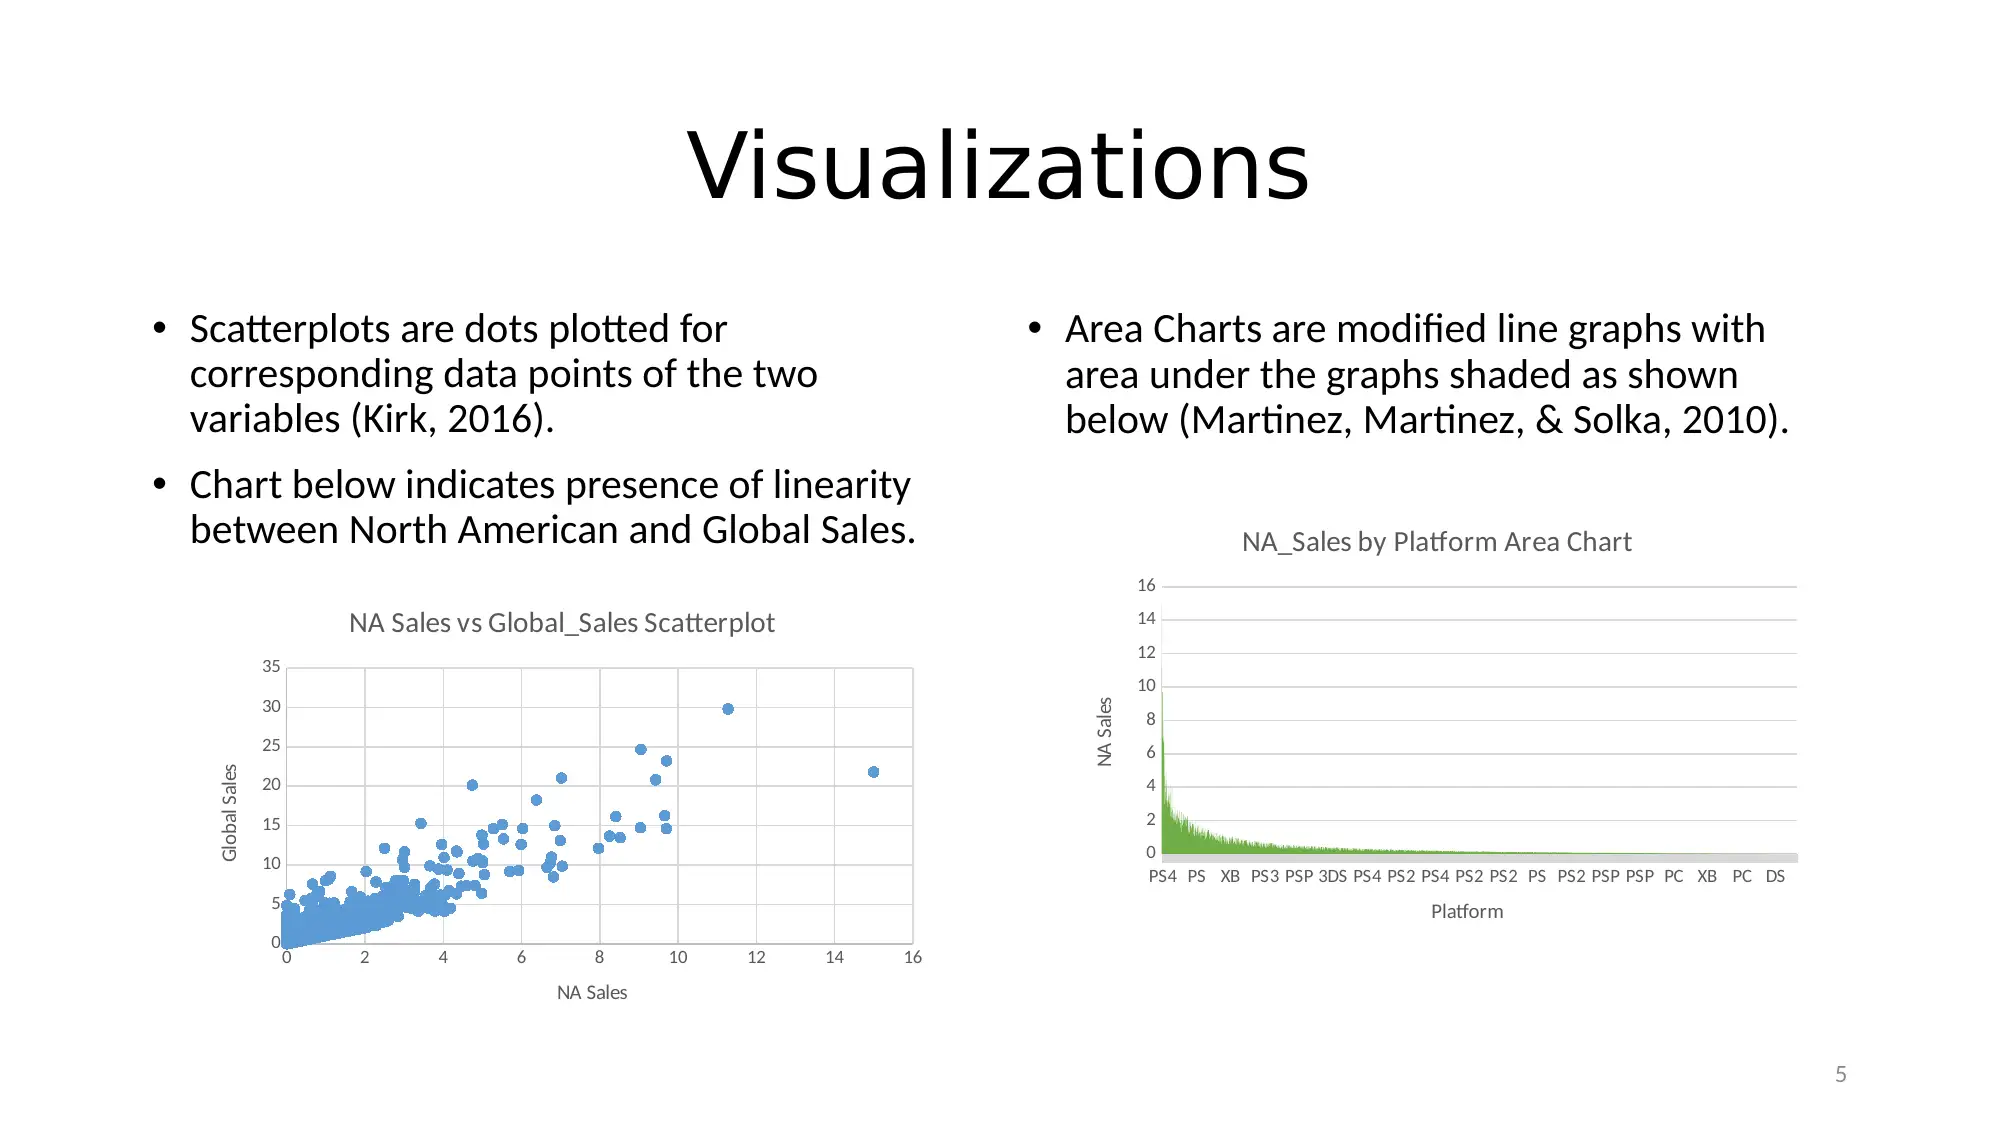
This case study analyzes the video gaming industry using a dataset from Rush (2016). It begins with descriptive statistics, providing a summary of numeric variables. The analysis incorporates various visualizations, including pie charts to show sales distribution by region, column charts illustrating platform frequencies, Pareto charts displaying global sales by platform, scatterplots revealing the relationship between North American and global sales, and area charts. The study concludes that North America is the most lucrative market, and the PS2 and DS platforms are highly popular. The analysis highlights the application of analytical methods and techniques to extract useful insights from large datasets, as per the MITS6002 assignment brief, which emphasizes the importance of data visualization and the ability to interpret data to recommend business directions. References to key statistical methods and data visualization techniques are included to support the analysis.
Document Page
Data Analytics and Business Intelligence (Case
Study of Video Gaming Industry)
Student Name
tabler-icon-diamond-filled.svg

Secure Best Marks with AI Grader

Need help grading? Try our AI Grader for instant feedback on your assignments.
Document Page
2
Introduction and Descriptive
Statistics
The data analysis in this study is
interesting in the investigation of
trends in the video gaming
industry with data collected
from (Rush, 2016).
The table on the side gives the
summary statistics of the
descriptive analysis of the
numeric variables.
Document Page
3
Visualizations
Pie Charts are circular graphical
representations of data magnitude attributes
(Barbara & Susan, 2014).
Chart below shows North America has the
highest sales.
Column charts are vertical bars representing
frequencies (O'Neil & Schutt, 2013).
Chart below shows DS and PS2 had highest
frequencies.
Total Sales by Regions Pie Chart
NA_Sales EU_Sales JP_Sales Other_Sales 3DS DC DS PC PS PS2 PS3 PS4 PSP X360 XB XOne
0
500
1000
1500
2000
2500
Column Chart for Count of Platform
Document Page
4
Visualizations
Pareto charts are graphical
representations showing both
cumulative and individual
frequencies (Georgina, 2015;
Chambers, 2017; Roles, Baeten,
& Signer, 2016).
Below is a Pareto chart of global
sales by platform.
tabler-icon-diamond-filled.svg

Secure Best Marks with AI Grader

Need help grading? Try our AI Grader for instant feedback on your assignments.
Document Page
5
Visualizations
Scatterplots are dots plotted for
corresponding data points of the two
variables (Kirk, 2016).
Chart below indicates presence of linearity
between North American and Global Sales.
Area Charts are modified line graphs with
area under the graphs shaded as shown
below (Martinez, Martinez, & Solka, 2010).
0 2 4 6 8 10 12 14 16
0
5
10
15
20
25
30
35
NA Sales vs Global_Sales Scatterplot
NA Sales
Global Sales
PS4 PS XB PS3 PSP 3DS PS4 PS2 PS4 PS2 PS2 PS PS2 PSP PSP PC XB PC DS
0
2
4
6
8
10
12
14
16
NA_Sales by Platform Area Chart
Platform
NA Sales
Document Page
6
Conclusions
The analysis in this study indicate that the North America market is
the most lucrative market for video games, with its sales reasonably
correlated with the global sales.
The PS2 and DS are also identified as the most popular platforms.
Document Page
7
References
Barbara, I., & Susan, D. (2014). Introductory Statistics (1st ed.). New York: OpenStax CNX.
Chambers, J. M. (2017). Graphical Methods for Data Analysis: (1st ed.). New York: Chapman and Hall/CRC.
Georgina, P. (2015). How Business Works: A Graphic Guide to Business Success (1st ed.). London: DK Publishing.
Kirk, A. (2016). Data Visualization: A Handbook for Data Driven Design (2nd ed.). Thousand Oaks, CA: Sage Publications,
Ltd.
Martinez, W. L., Martinez, A. R., & Solka, J. (2010). Exploratory Data Analysis With MATLAB, 2nd Edition (1 ed.). London:
CRC/Chapmann & Hall.
O'Neil, C., & Schutt, R. (2013). Doing Data Science (3rd ed.). London: O'Reily.
Roles, R., Baeten, Y., & Signer, B. (2016). Interactive and Narrative Data Visualization for Presentation-Based Knowledge
Transfer. Communication in Computer and Information Science, 4(6), 739.
Rush, K. (2016). rush4ratio. Retrieved from https://www.kaggle.com/rush4ratio/video-game-sales-with-ratings/data
chevron_up_icon
1 out of 7
circle_padding
hide_on_mobile
zoom_out_icon
logo.png

Your All-in-One AI-Powered Toolkit for Academic Success.

Available 24*7 on WhatsApp / Email

[object Object]