Final Project Report: Data Analytics, IBM Watson, and Business
VerifiedAdded on 2020/02/24
|27
|5958
|128
Project
AI Summary
This project report details a business improvement plan centered on data analytics, with a specific focus on IBM Watson Analytics. It begins with an executive summary highlighting the importance of data analytics in modern business and the shift from manual to software-driven processes. The report outlines the problem statement, project objectives, and relevant academic and commercial research, including the Technology Acceptance Model (TAM) framework. The methodology involves a questionnaire survey to gather user experiences with data analytics tools, particularly IBM Watson. Data collection methods, including literature reviews and surveys, are described, followed by data analysis, comparing literature and survey data to validate hypotheses. The report then discusses the IBM Watson Analytics tool, summarizing findings, limitations, and recommendations. The project concludes by emphasizing the benefits of IBM Watson in enhancing business operations, as demonstrated by various organizations that have integrated the tool into their systems. The report highlights the significance of data analytics in achieving business progress and provides insights into the practical application of data analytics tools.
Running Head: FINAL PROJECT REPORT
Final Project Report: Business Improvement Plan/Data Analytics
Name of the Student
Name of the University
Final Project Report: Business Improvement Plan/Data Analytics
Name of the Student
Name of the University
Paraphrase This Document
Need a fresh take? Get an instant paraphrase of this document with our AI Paraphraser
1FINAL PROJECT REPORT
Executive Summary
Data analytics is an important aspect of any business that wants significant progress in today’s
market. Initially, the analytics operations were done manually and as a result, there were
numerous errors in the calculations. However, after the arrival of the softwares, this process has
now become much more easier. The data analytics softwares can now efficiently carry out any
analytics operations within a matter of microseconds. The software data analytics tools must be
implemented by the business organizations in order to progress in modern market. There are a
number of software tools available for data analytics including IBM Watson Analytics, Pentaho,
Clic Data, Tap Clicks and others. Most business organizations utilize these analytics tools for
business operations that are related to the use of numerous pieces of data and information. This
report is based on the research conducted on data analytics in business with special emphasis on
IBM Watson Analytics tool.
2FINAL PROJECT REPORT
Table of Contents
1.0 Introduction................................................................................................................................4
2.0 Problem Statement.....................................................................................................................5
2.1 Definition of the Problems.....................................................................................................5
2.2 Identification of the Stakeholders..........................................................................................5
3.0 Project Objectives......................................................................................................................6
4.0 Related Academic and Commercial Research...........................................................................6
5.0 Relevant Theories and Frameworks..........................................................................................8
6.0 Methodology..............................................................................................................................8
7.0 Data Collection and Analysis..................................................................................................10
7.1 Data Collection....................................................................................................................10
7.2 Data Analysis.......................................................................................................................10
8.0 Discussion of the Artefact (IBM Watson Analytics)...............................................................16
9.0 Summary of Findings, Limitations, Recommendations..........................................................18
9.1 Summary of Findings..........................................................................................................18
9.2 Limitations...........................................................................................................................20
9.3 Recommendations................................................................................................................21
References......................................................................................................................................23
Appendix........................................................................................................................................27
⊘ This is a preview!⊘
Do you want full access?
Subscribe today to unlock all pages.
Trusted by 1+ million students worldwide
3FINAL PROJECT REPORT
1.0 Introduction
The client for this particular project is Vista Concept Dimensions who are looking to
implement a data analytics tool in their system. They are currently facing problems due to their
manual data analytics process and hence, they require a new automated analytics system. The
main objective of this particular project is to identify only one data analytics tool that is the best
option for all the business organizations. Hence, in order to conduct the project, questionnaire
survey method was used. Collection of secondary data from the organizational records of the
analytics tools was rejected due to one particular reason: biasing. Developers of each of these
tools always claim their product to be the best in the market. Hence, the target in this research
was to capture actual user experience data to identify the best analytics tool available. The
decided method to undertake the survey was by using questionnaires where 15 questions were
asked. The target audiences of the survey were different organizational leaders for small scale
organizations and organizational management staff for the large scale ones. The interview was
conducted in form of direct interviews (if possible), video calls and online distribution of
questionnaire copy.
This report is based on the project conducted on data analytics in business with special
emphasis on IBM Watson Analytics tool. The survey data has been analyzed in order to identify
the specific feedbacks on the IBM Watson Analytics tool as it is the main point of focus in this
particular research. In addition, other analytics tools were also analyzed in order to determine
whether IBM Watson is better than them in terms of services and features or not.
Paraphrase This Document
Need a fresh take? Get an instant paraphrase of this document with our AI Paraphraser
4FINAL PROJECT REPORT
2.0 Problem Statement
2.1 Definition of the Problems
The main problems that need to be addressed in course of the project are as follows.
P1: The existing data analytics system has very low efficiency as it is mostly handled
manually.
P2: Currently, Microsoft Excel is used to store business data that has large number of
limitations.
P3: In the client’s existing manual analytics system, due to lack of sufficient data
analytics results, the designs cannot be produced of the best quality.
2.2 Identification of the Stakeholders
The stakeholders of the project have been identified as follows.
Project Manager – To manage the different aspects of the project
Project Supervisor – To supervise and monitor the progress of the project
Financial Support – To provide sufficient financial support for the project
Sponsor – To provide the overall budget for the project
Software Developer – To develop the chosen analytics tool in the system
Software Tester – To test the developed software for bugs and glitches
5FINAL PROJECT REPORT
3.0 Project Objectives
The objectives of the project are as follows.
To suggest a new system to replace the existing manually handled data analytics
system
To replace the excel storage technique with some software powered techniques
To prepare an implementation plan for the new data analytics tool as well as
training the employees regarding the use of this tool
4.0 Related Academic and Commercial Research
Data Analytics is a process by which different pieces of data are analyzed in order to
extract a particular piece of information from it. Before the availability of advanced technology,
data analytics were done manually. However, after the advancement of software technology, data
analytics is now software driven. There are a number of software tools available for data
analytics including IBM Watson Analytics, Pentaho, Clic Data, Tap Clicks and others.
According to Tsoi et al. (2017), data analytics is an important aspect of any business that
wants significant progress in today’s market. Initially, the analytics operations were done
manually and as a result, there were numerous errors in the calculations. However, after the
arrival of the softwares, this process has now become much more easier. The data analytics
softwares can now efficiently carry out any analytics operations within a matter of microseconds.
Hoyt et al. (2016) said that the software data analytics tools must be implemented by the
business organizations in order to progress in modern market. Most business organizations
⊘ This is a preview!⊘
Do you want full access?
Subscribe today to unlock all pages.
Trusted by 1+ million students worldwide
6FINAL PROJECT REPORT
utilize these analytics tools for business operations that are related to the use of numerous pieces
of data and information.
Guidi et al. (2016) promoted the use of Pentaho by publishing data sets that it can utilize
Big Data completely and its values are accelerated by NoSQL, Hadoop and other big data
platforms. This tool integrates all the data collected on a specific subject and then classifies it
using its customization analytics tool. It then analyzes the data and provide reliable business
insights and suggestions based on the information contained in the data.
Lak et al. (2016) discussed about other tools like Clic Data and Tap Clicks. According to
them, Clic Data has different and unique features than the other existing ones. Clic Data also acts
as a data visualization and business intelligence tool that also collects, analyzes and cleans the
data according to the requirements set by the user. It can also set up visual indicators in the data
as well as KPIs and other key metrics so that the user can easily share the result data with the
clients and colleagues. They also said that Tap Clicks is designed to provide marketing analysis
services rather than only data analytics i.e. it is specific to marketing data for the analytic
functions. Moreover, it is also used to create a workflow plan and order management plan that
are some of the most essential parts of some business organizations.
Aggarwal and Madhukar (2016) recommended the use of IBM Watson by saying that it is
by far the best tool available in today’s market. According to them, IBM Watson can efficiently
determine a pattern or sequence within a specific set of data without any difficulty. IBM also has
IBMSPSS predictive analytics and data science experience tools that further enhance the features
of the data analytics tool.
Paraphrase This Document
Need a fresh take? Get an instant paraphrase of this document with our AI Paraphraser
7FINAL PROJECT REPORT
5.0 Relevant Theories and Frameworks
In order to conduct this research, the use of some relevant theories and frameworks were
necessary. The main framework that was utilized in this research was Technology Acceptance
Model (TAM). The use of this particular framework helped to analyze how a data analytics tool
like IBM Watson will benefit the given company under the field of the research.
6.0 Methodology
In order to conduct the research, questionnaire survey method was used. Collection of
secondary data from the organizational records of the analytics tools was rejected due to one
particular reason: biasing. Developers of each of these tools always claim their product to be the
best in the market. Hence, the target in this research was to capture actual user experience data to
identify the best analytics tool available. The decided method to undertake the survey was by
using questionnaires where 15 questions were asked. The target audiences of the survey were
different organizational leaders for small scale organizations and organizational management
staff for the large scale ones. The interview was conducted in form of direct interviews (if
possible), video calls and online distribution of questionnaire copy. Before starting the interview,
the organizational members and leaders were contacted and prior appointments were made. Most
of the organizational leaders actively helped by answering the questions accurately as per the
requirements of the survey.
This survey was conducted among 150 members from different organizations and it has
been found in the result that 70% votes were in favor of IBM Watson Analytics i.e. 70% of the
people said they are currently using IBM Watson Analytics as they find it the most helpful for
their data analytics operations. Moreover, from this survey, it has been found that the following
8FINAL PROJECT REPORT
reputed organizations are actively using IBM Watson Analytics in their data analytics
department.
a) 1-800-Flowers
b) Macy’s
c) H&R Block
d) Staples
e) Autodesk
f) Chevrolet
g) The North Face
h) TD Ameritrade
i) Rare Carat
j) The Weather Company
It has also been found that the business operations of these companies have been
significantly enhanced by the use of IBM Watson Analytics tool. However, this is not due to
only the use of this tool in the data analytics department. These organizations innovated their
own virtual systems and connected it to the analytics tool that has revolutionalized their
businesses. For instance, Staples provides a red button in their order processing system. By
pressing this button, one simply has to utter “order me some red pens” or “order me some blue
pens”. The IBM Analytics tool will instantly process this voice message and will order for the
pens immediately. Similarly, the IBM tool enhanced the business processes of all the
organizations by linking up the business processes and data analytics operations.
⊘ This is a preview!⊘
Do you want full access?
Subscribe today to unlock all pages.
Trusted by 1+ million students worldwide
9FINAL PROJECT REPORT
7.0 Data Collection and Analysis
7.1 Data Collection
As discussed in the methodology section, the main data collection has been done from the
survey interviews of different organizational members and leaders. However, before proceeding
with the survey, an in-depth analysis of literature has been conducted. During this phase, the
works of researchers based on the data analytics and the influence of software in data analytics
have been studied. When sufficient data had been collected, the survey was conducted to capture
data regarding user experiences on using software driven data analytics tools. Conducting both
the data collection methods helped to reduce biasing of opinions as well as verification of the
hypotheses that were proposed before the start of the research.
7.2 Data Analysis
The data collected included the processes of manual data analytics, software driven data
analytics, different analytic tools available in the market and the types of services and advantages
they provide. In order to collect sufficient data for literature survey, online databases like google
scholar and other online libraries. After the data collection for literature survey was complete, the
survey was started. The interview was conducted in form of direct interviews (if possible), video
calls and online distribution of questionnaire copy. Before starting the interview, the
organizational members and leaders were contacted and prior appointments were made. Most of
the organizational leaders actively helped by answering the questions accurately as per the
requirements of the survey.
When all the data was collected from literature review and the survey, analysis was
conducted using all the data. Firstly, a comparison was made between the literature data and
Paraphrase This Document
Need a fresh take? Get an instant paraphrase of this document with our AI Paraphraser
10FINAL PROJECT REPORT
survey data for verification of the hypotheses proposed before the starting of the project. After
that, the survey data was analyzed in order to identify the specific feedbacks on the IBM Watson
Analytics tool as it is the main point of focus in this particular research. In addition, other
analytics tools were also analyzed in order to determine whether IBM Watson is better than them
in terms of services and features or not. The data analysis results are as follows.
From the data analysis process, it has been seen there are a number of data analytics tool
currently available in the market. Some of the most popular ones are discussed as follows.
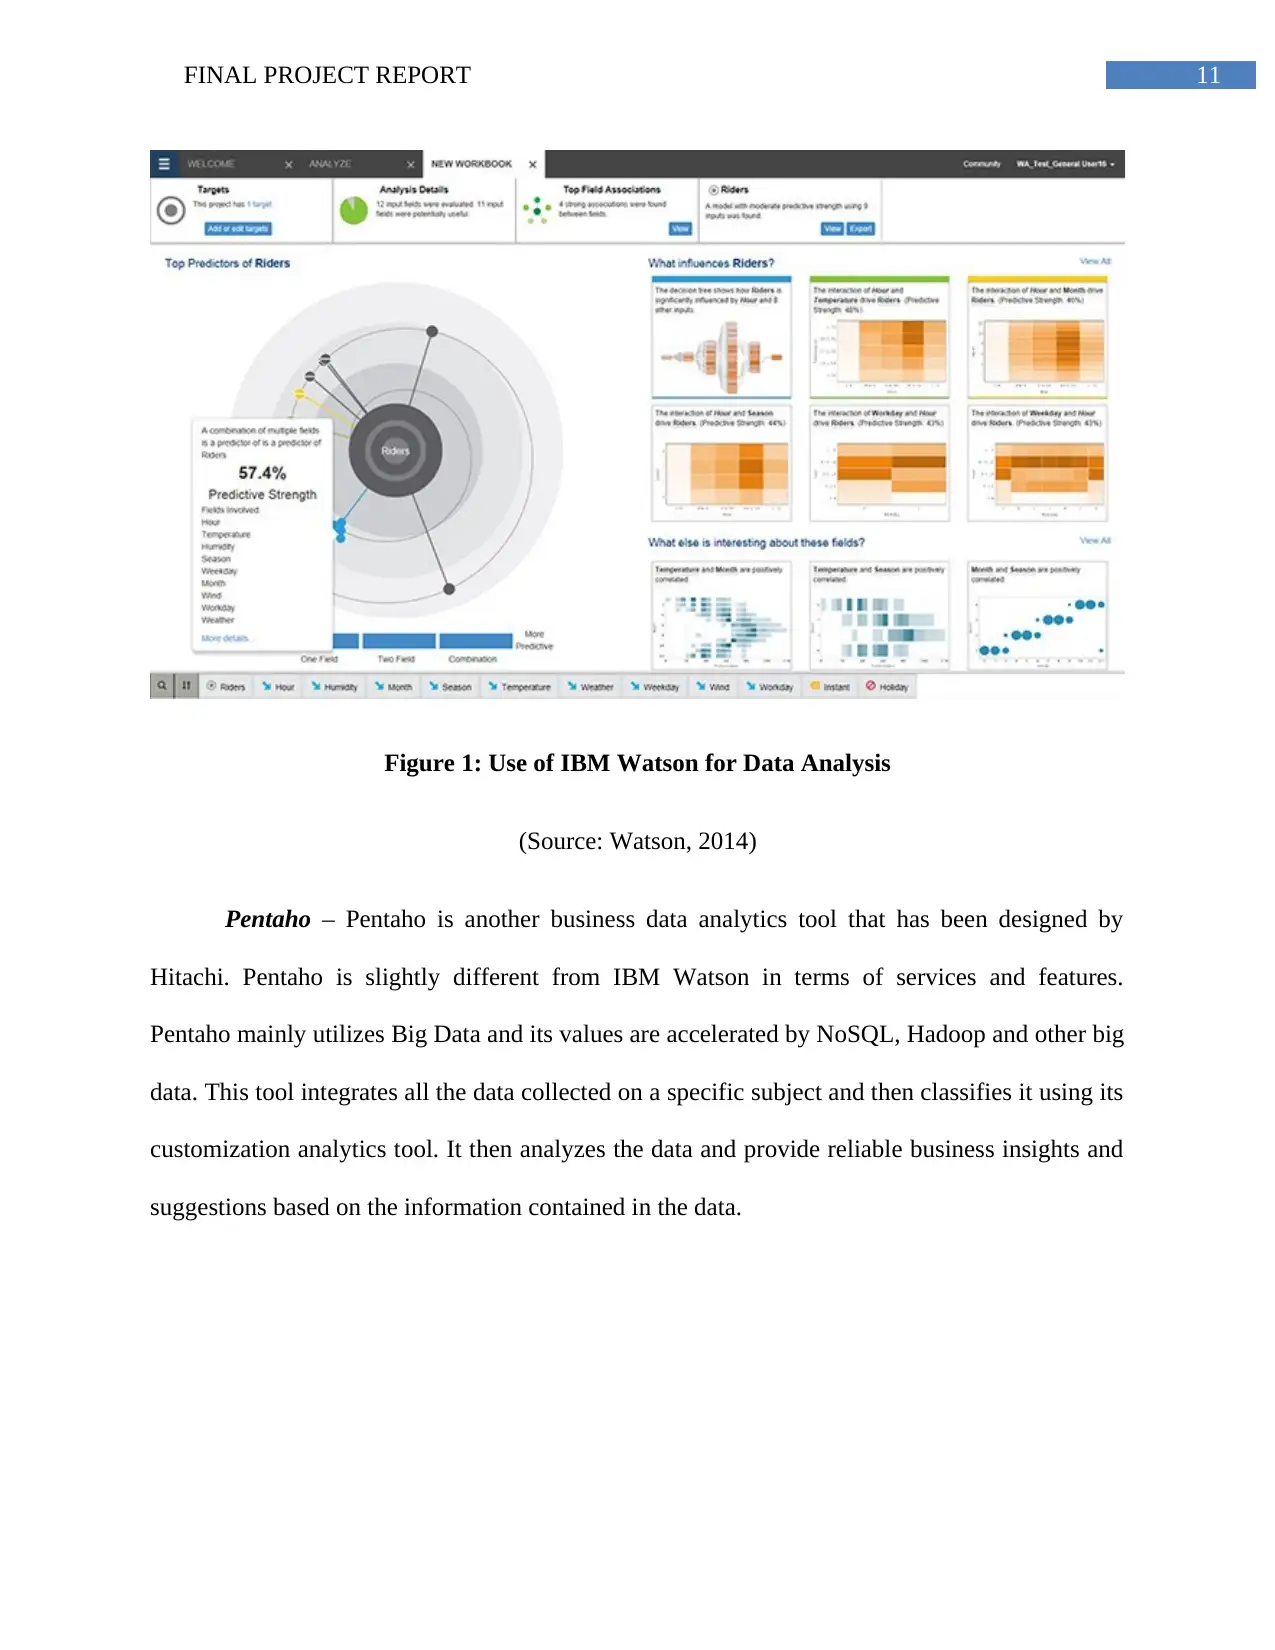
IBM Watson Analytics – This has been found to be the most popular of all the data
analytics tools available in the market. This tool was invented by IBM and has the features of
data analysis and visualization within a cloud based virtual interface. IBM Watson analytics can
refine, explore, predict and assemble the data. IBM Watson can efficiently determine a pattern or
sequence within a specific set of data without any difficulty. It also provides complex cloud
based services along with guidance and data prediction. IBM also has IBMSPSS predictive
analytics and data science experience tools that further enhance the features of the data analytics
tool. It also has cognos analytics in which it provides services as hosted solution via IBM cloud.
In addition to achieving vista concept dimensions’ business client through the free choice,
Watson Analytics additionally guarantees availability through representation and self-benefit
usefulness.
survey data for verification of the hypotheses proposed before the starting of the project. After
that, the survey data was analyzed in order to identify the specific feedbacks on the IBM Watson
Analytics tool as it is the main point of focus in this particular research. In addition, other
analytics tools were also analyzed in order to determine whether IBM Watson is better than them
in terms of services and features or not. The data analysis results are as follows.
From the data analysis process, it has been seen there are a number of data analytics tool
currently available in the market. Some of the most popular ones are discussed as follows.
IBM Watson Analytics – This has been found to be the most popular of all the data
analytics tools available in the market. This tool was invented by IBM and has the features of
data analysis and visualization within a cloud based virtual interface. IBM Watson analytics can
refine, explore, predict and assemble the data. IBM Watson can efficiently determine a pattern or
sequence within a specific set of data without any difficulty. It also provides complex cloud
based services along with guidance and data prediction. IBM also has IBMSPSS predictive
analytics and data science experience tools that further enhance the features of the data analytics
tool. It also has cognos analytics in which it provides services as hosted solution via IBM cloud.
In addition to achieving vista concept dimensions’ business client through the free choice,
Watson Analytics additionally guarantees availability through representation and self-benefit
usefulness.
11FINAL PROJECT REPORT
Figure 1: Use of IBM Watson for Data Analysis
(Source: Watson, 2014)
Pentaho – Pentaho is another business data analytics tool that has been designed by
Hitachi. Pentaho is slightly different from IBM Watson in terms of services and features.
Pentaho mainly utilizes Big Data and its values are accelerated by NoSQL, Hadoop and other big
data. This tool integrates all the data collected on a specific subject and then classifies it using its
customization analytics tool. It then analyzes the data and provide reliable business insights and
suggestions based on the information contained in the data.
⊘ This is a preview!⊘
Do you want full access?
Subscribe today to unlock all pages.
Trusted by 1+ million students worldwide
1 out of 27
Related Documents


Your All-in-One AI-Powered Toolkit for Academic Success.
+13062052269
info@desklib.com
Available 24*7 on WhatsApp / Email
![[object Object]](/_next/static/media/star-bottom.7253800d.svg)
Unlock your academic potential
Copyright © 2020–2026 A2Z Services. All Rights Reserved. Developed and managed by ZUCOL.