Data Analytics Report: MBA504 Data Analysis of Poo-Pourri Campaign
VerifiedAdded on 2022/11/15
|17
|2504
|66
Report
AI Summary
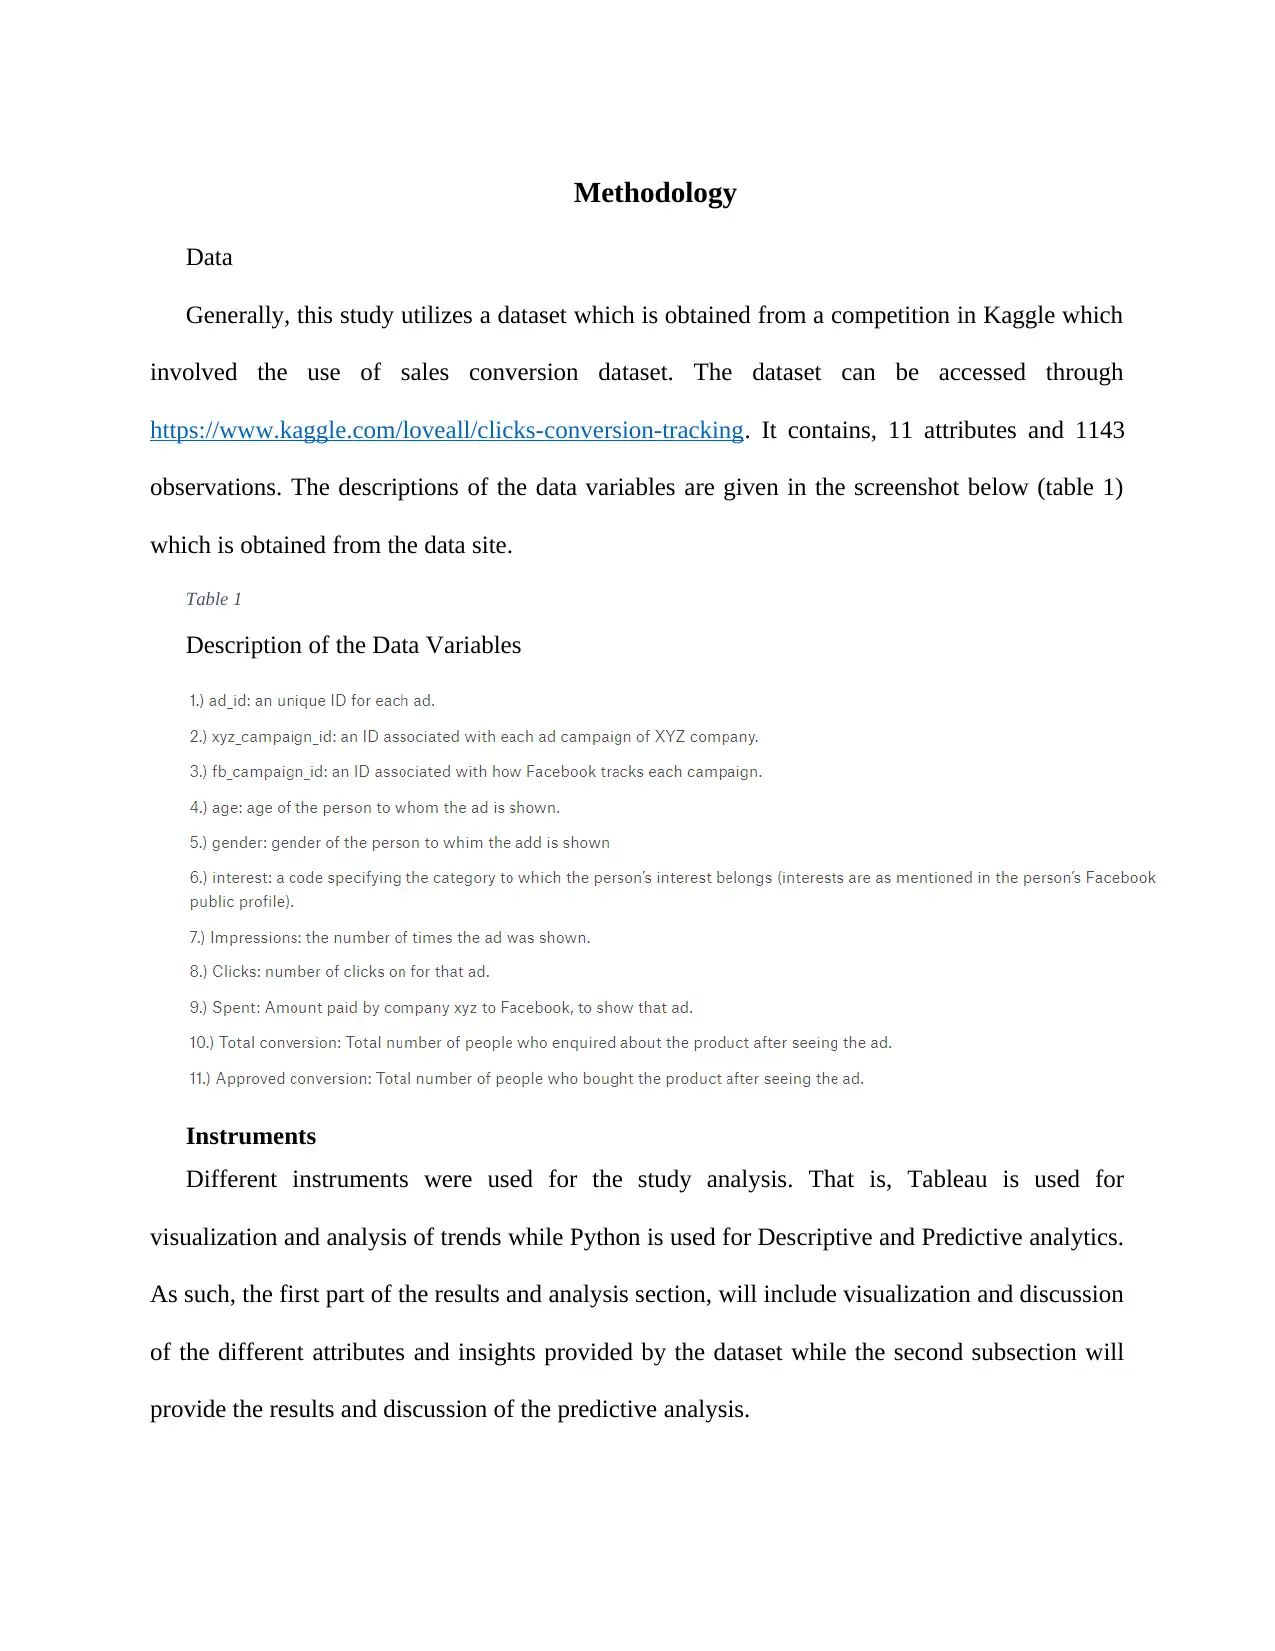
This report presents a data analytics case study focused on evaluating the performance of Poo-Pourri's social media marketing campaign. The analysis utilizes a dataset from a Kaggle competition, containing 11 attributes and 1143 observations related to sales conversions. The study employs both visual and predictive analytics, using Tableau for visualizations and Python for descriptive and predictive modeling, including correlation and linear regression analyses. The report explores the distribution of various variables, such as age, gender, and ad clicks, and their relationships with conversion rates. Key findings include the impact of ad spending, impressions, and interests on approved conversions, with the regression model explaining 56% of the variance. The analysis provides insights for stakeholders, particularly in financial decision-making, suggesting potential increases in marketing budgets based on the positive correlations between spending and conversion metrics. The conclusion emphasizes the importance of data-driven decision-making in optimizing marketing strategies and improving business outcomes.

Table of Contents
Introduction...........................................................................................................................................2
Business Problem..............................................................................................................................3
Objective...........................................................................................................................................3
Study Questions................................................................................................................................3
Methodology.........................................................................................................................................4
Instruments........................................................................................................................................4
Data Cleaning....................................................................................................................................5
Regression and Correlation...............................................................................................................5
Analysis.................................................................................................................................................5
Visual Analysis.................................................................................................................................5
Distribution of Age and Number of Ad Clicks.............................................................................6
Distribution between Gender and the Number of Ad Clicks.........................................................7
Distribution of Amount Spent on Ads by Gender.........................................................................7
Distribution of Amount Spent per Age Group..............................................................................8
Distribution of Age and Total Conversion....................................................................................9
Gender and Total Conversions....................................................................................................10
Age and Approved Conversions.................................................................................................10
Gender and Approved Conversions............................................................................................11
Analysis Dashboard....................................................................................................................12
Predictive Analysis..........................................................................................................................12
Correlation analysis....................................................................................................................13
Linear Regression.......................................................................................................................14
Relevance of The Results to Stakeholders.......................................................................................15
Conclusion...........................................................................................................................................15
References...........................................................................................................................................17
Paraphrase This Document
Need a fresh take? Get an instant paraphrase of this document with our AI Paraphraser

Introduction
Two decades ago, the relationship between business marketing and social media was
somewhat mundane (WU, 2018). Fast forward to a decade later, this relationship has changed
tremendously with the entry of different social media platforms into the social space. Over the
recent years, business have sought different ways through which they can understand their
market. In particular, these has been made possible through the evolution of analysis, a view
shared by (Khanna, 2018), who notes that, “…companies create strategies after they analyze and
understand the target consumer’s demands, likes and dislikes through Social Media. Social
media has had a major effect on the world and business.”
Therefore, the question that tends to surface each time that digital marketing is to be adopted
or is adopted as a marketing strategy by the company is whether there is any relationship
between sales and the social media marketing that has been selected for adoption (Yifang & Rui,
2013). This insight is particularly crucial to the firm’s executive since some of the marketing
campaign require funding hence, the performance of such marketing strategies will determine if
the executive should keep using them or otherwise adopt new ones (Yan & Junxuan, 2014).
Business Problem
By the close of 2018, Poo-Pourri adopted integrated social media marketing (specifically
Social Media Ad Campaign) which according to (Voorveld, et al., 2018), is one of the leading
sources of sales conversion. After approximately one and a half years, the executive is interested
in reviewing the performance of the marketing campaign as a base on which to make decisions
regarding the company’s cycle policy of changing and adopting emerging marketing strategies.

Objective
The objective of this paper is to explore the use of data analytics in tackling the firm’s
business problem. These will include, visual (as a quantitative analysis method), descriptive and
predictive analytics.
Study Questions
The study objective will be addressed through answering the following questions:
i. What is the distribution of the respective variables in the dataset?
ii. Is there a relationship between the predictor variables and the response attribute as
defined in the analysis and results section?
iii. If there is a relationship, what kind of relationship is it?
In order to meet the paper’s objective, the rest of the paper will be divided into sections each
with a brief description of what it covers followed by the relevant content. The sections include,
methodology (data and instruments), analysis results and discussion as well as conclusion.
⊘ This is a preview!⊘
Do you want full access?
Subscribe today to unlock all pages.

Trusted by 1+ million students worldwide

Methodology
Data
Generally, this study utilizes a dataset which is obtained from a competition in Kaggle which
involved the use of sales conversion dataset. The dataset can be accessed through
https://www.kaggle.com/loveall/clicks-conversion-tracking. It contains, 11 attributes and 1143
observations. The descriptions of the data variables are given in the screenshot below (table 1)
which is obtained from the data site.
Table 1
Description of the Data Variables
Instruments
Different instruments were used for the study analysis. That is, Tableau is used for
visualization and analysis of trends while Python is used for Descriptive and Predictive analytics.
As such, the first part of the results and analysis section, will include visualization and discussion
of the different attributes and insights provided by the dataset while the second subsection will
provide the results and discussion of the predictive analysis.
Paraphrase This Document
Need a fresh take? Get an instant paraphrase of this document with our AI Paraphraser

Data Cleaning
The original dataset is obtained from a reliable source. Therefore, before uploading it to the
data repository the data collector had cleaned it appropriately hence data cleaning will not be
necessary for this study. Despite the fact that the study will not involve data cleaning, some of
the features of the dataset are not useful to predictive analysis. As such, after conducting visual
analysis, it is necessary that feature selection is conducted before predictive analysis is done.
Regression and Correlation
Originally, the study objective was to conduct visual analysis as well as predictive analytics.
Whereas visual analytics do not necessarily require a model, predictive analytics requires that a
model is developed which is then applied to the dataset so as to determine the relationship that
exists between the response and predictor variables. In this study, the response variable is, the
Approved conversions i.e. the sales conversions which led to actual sales. In practice, there are
several predictive modelling techniques. However, the most commonly used techniques are:
decision trees, regression and neural networks (SAS, 2017).
In this paper, regression analysis is used as a predictive modelling tool, which is preceded by
correlation analysis which is used to examine if there is any association between the different
variables in the dataset. Moreover, correlation is used as a prerequisite for feature selection.
Analysis
Visual Analysis
In this section, different relationships between the data attributes are explored. This will also
involve descriptive analysis which shows the quantitative distribution of the data statistics.

Distribution of Age and Number of Ad Clicks
Figure 1: Number of Ad clicks according to age group
From figure 1, it is evident that persons aged between 45 and 49 made the most clicks
followed by those aged 30-34, 40-44 while persons aged between 35-39 had the least number of
clicks.
Figure 1: Number of Ad clicks according to age group
From figure 1, it is evident that persons aged between 45 and 49 made the most clicks
followed by those aged 30-34, 40-44 while persons aged between 35-39 had the least number of
clicks.
⊘ This is a preview!⊘
Do you want full access?
Subscribe today to unlock all pages.

Trusted by 1+ million students worldwide

Distribution between Gender and the Number of Ad Clicks
Figure 2: Gender and Number of clicks
In figure 2 above, it is noted that most of the clicks on the Ads were made by female
customers (23,878 clicks) compared to male customers who made 14, 287 clicks.
Distribution of Amount Spent on Ads by Gender
Given the graph in figure 3 below, the total amount spent on the Ads targeting females is
$34,503 while that for males is $24,203.
Paraphrase This Document
Need a fresh take? Get an instant paraphrase of this document with our AI Paraphraser

Figure 3: Amount Spent on Ads by Gender
Distribution of Amount Spent per Age Group
Figure 4: Amount Spent per Age Group
Distribution of Amount Spent per Age Group
Figure 4: Amount Spent per Age Group

In figure 4, it is evident that the firm spent most on advertisements targeted on persons
between the age of 45 and 49 ($20, 751) while it spent the least on persons aged between 35 and
39.
Distribution of Age and Total Conversion
The figure below shows the distribution between the age of target market and the total
conversion in each age group. As shown, most of the total conversions i.e. those who enquired
about the product after seeing the Ad were consumers aged between 30-34 while conversions of
consumers aged 45-49 came second followed by conversions from those aged 35 and 39 while
the least total conversions were from consumers aged 40-44.
⊘ This is a preview!⊘
Do you want full access?
Subscribe today to unlock all pages.

Trusted by 1+ million students worldwide

Gender and Total Conversions
Figure 5: Gender and Total Conversions
Gender wise, as evidenced in figure 5, there were equal total conversions between male and
female consumers.
Age and Approved Conversions
Similar to the total conversions, figure 6 below shows that, most of the approved conversions
i.e. Total number of people who bought the product after seeing the ad were consumers aged
between 30-34 while conversions of consumers aged 45-49 came second followed by
conversions from those aged 35 and 39 while the least total conversions were from consumers
aged 40-44.
Paraphrase This Document
Need a fresh take? Get an instant paraphrase of this document with our AI Paraphraser

Gender and Approved Conversions
Figure 6: Gender and Approved Conversions

The distribution between the gender and approved conversion between male and female
consumers as given in figure 6 above shows that there are more male approved conversions
compared to approved female conversions.
Analysis Dashboard
Above is representation of the tableau dashboard obtained from the visual analysis conducted
on the social media data.
Predictive Analysis
Visual and descriptive analysis do not usually explain the extent of the relationship between
different data attributes. As such, it is important that methods such as predictive analysis are
adopted which can be used to determine how a given response variable is affected by other
⊘ This is a preview!⊘
Do you want full access?
Subscribe today to unlock all pages.

Trusted by 1+ million students worldwide
1 out of 17
Related Documents
Your All-in-One AI-Powered Toolkit for Academic Success.
+13062052269
info@desklib.com
Available 24*7 on WhatsApp / Email
Unlock your academic potential
Copyright © 2020–2025 A2Z Services. All Rights Reserved. Developed and managed by ZUCOL.


