Data Analytics Report
VerifiedAdded on 2019/11/08
|11
|1096
|142
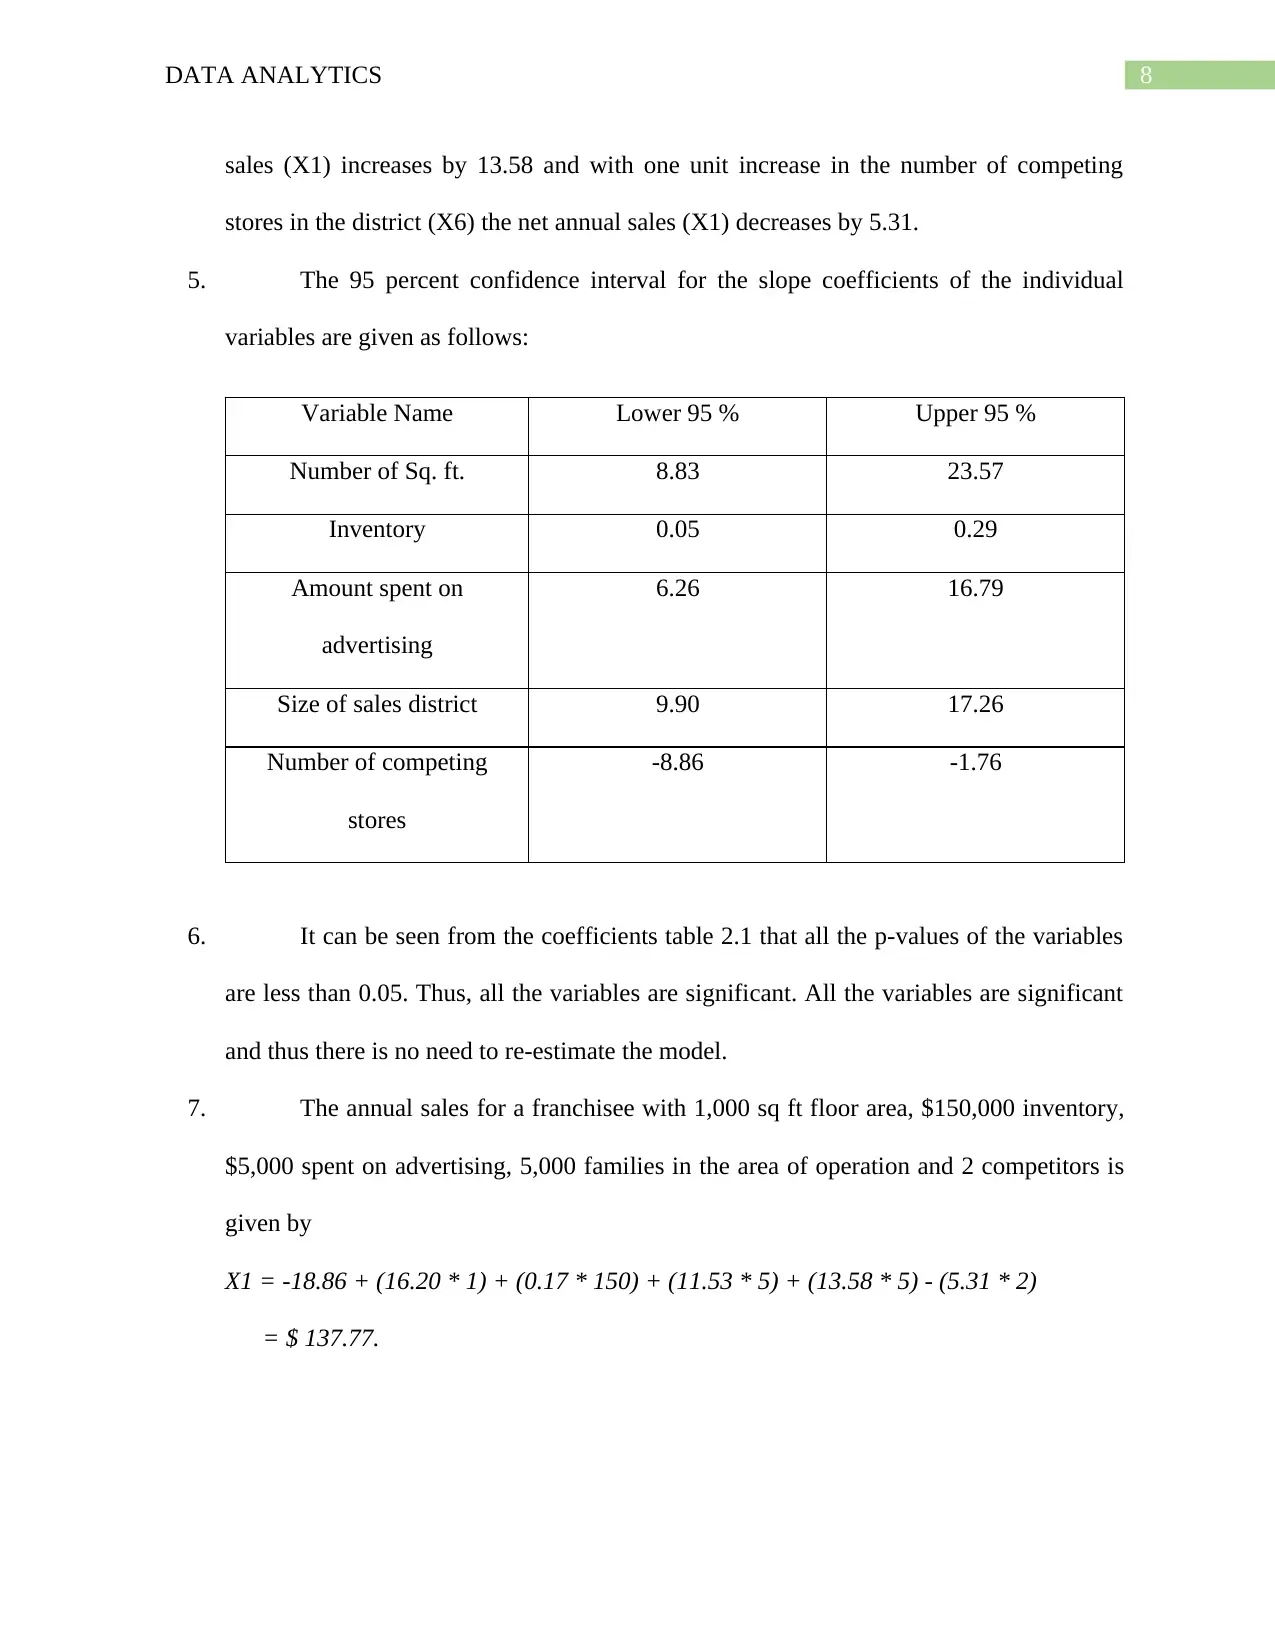
Report
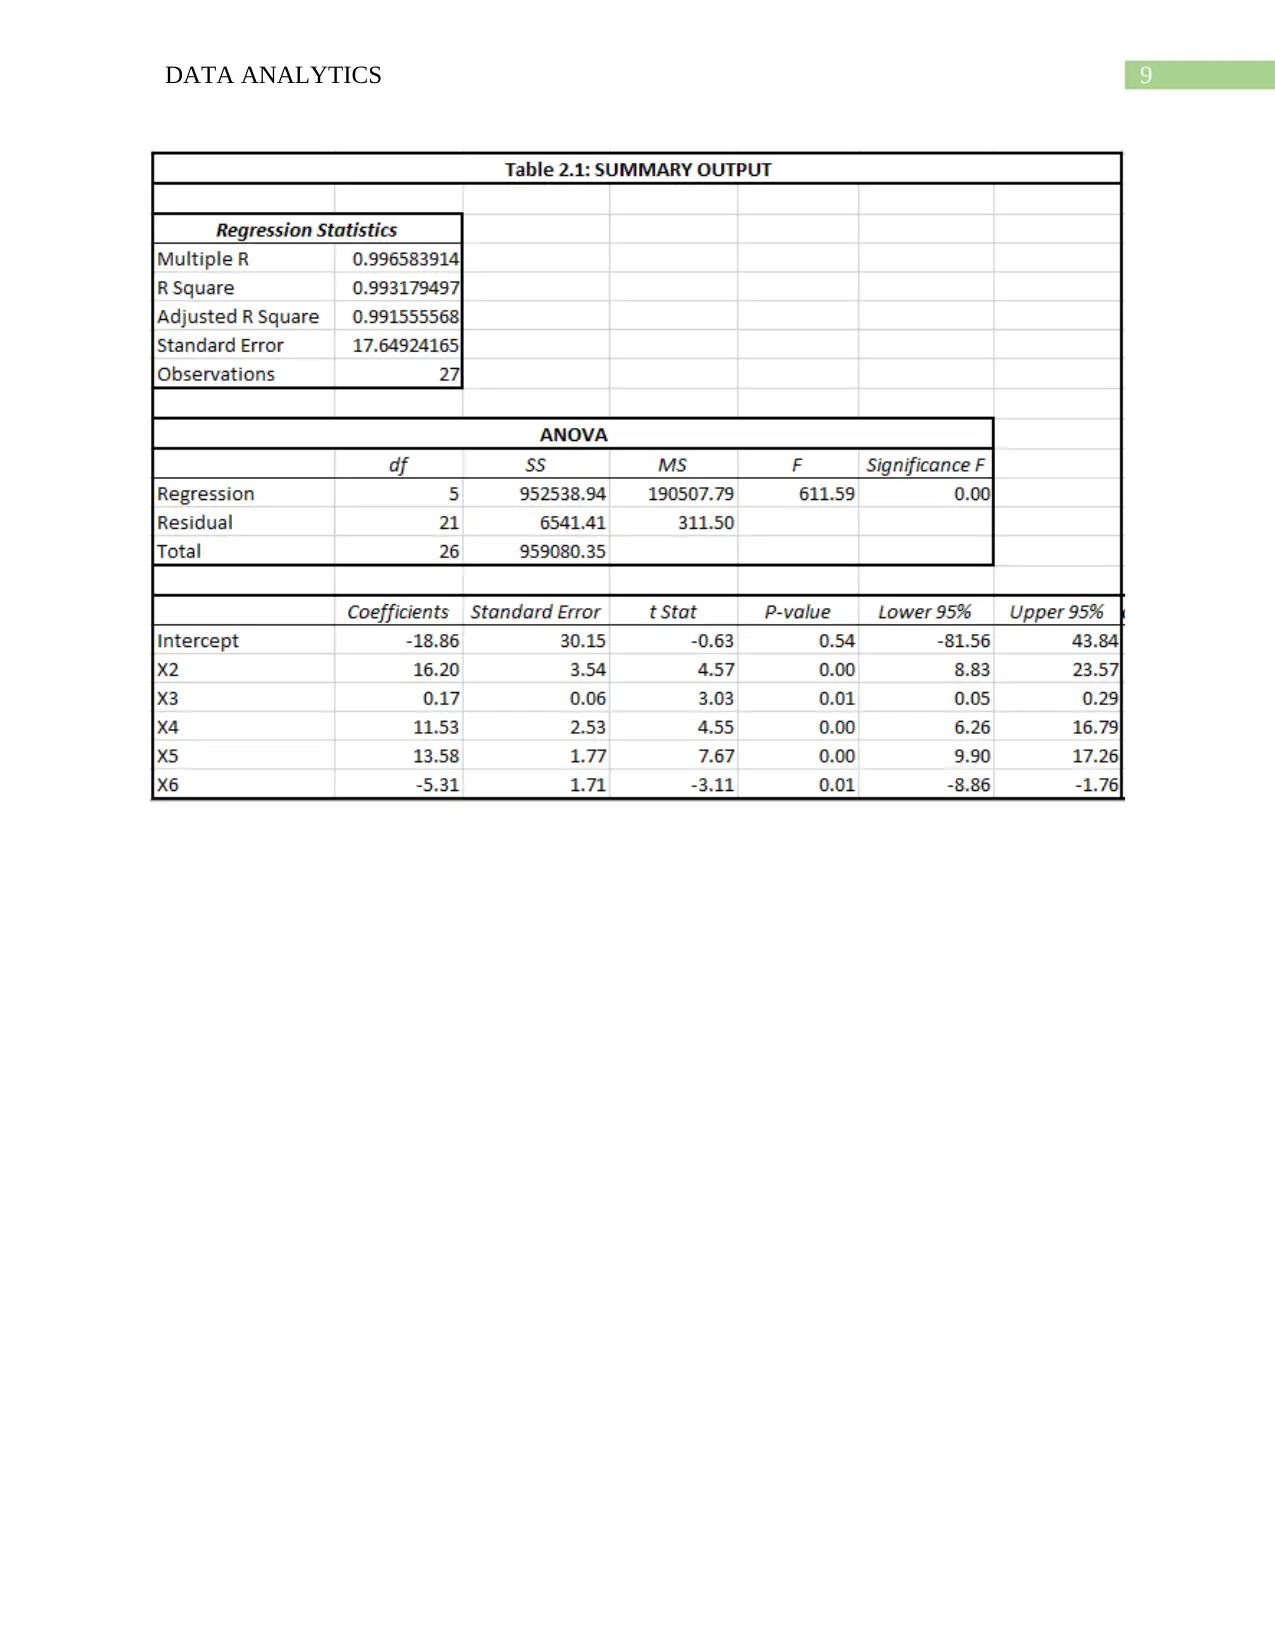
AI Summary
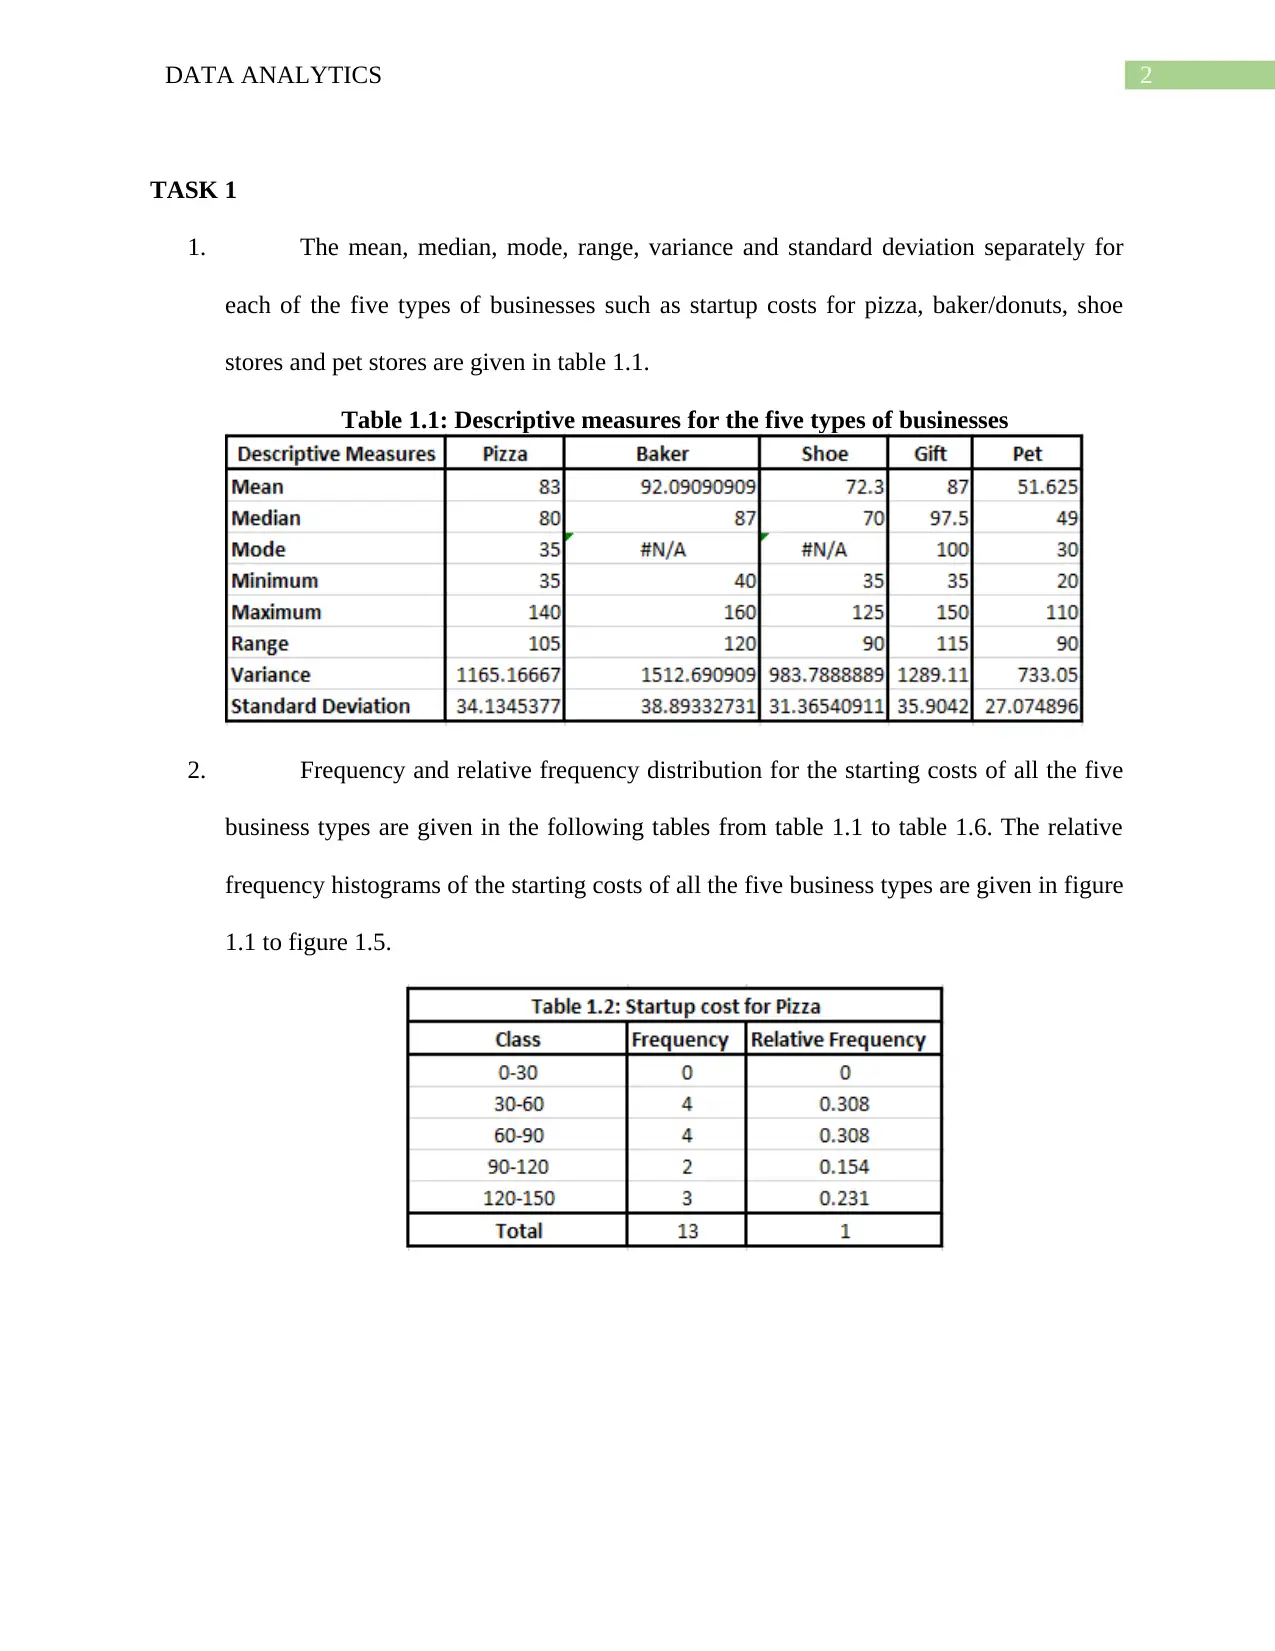
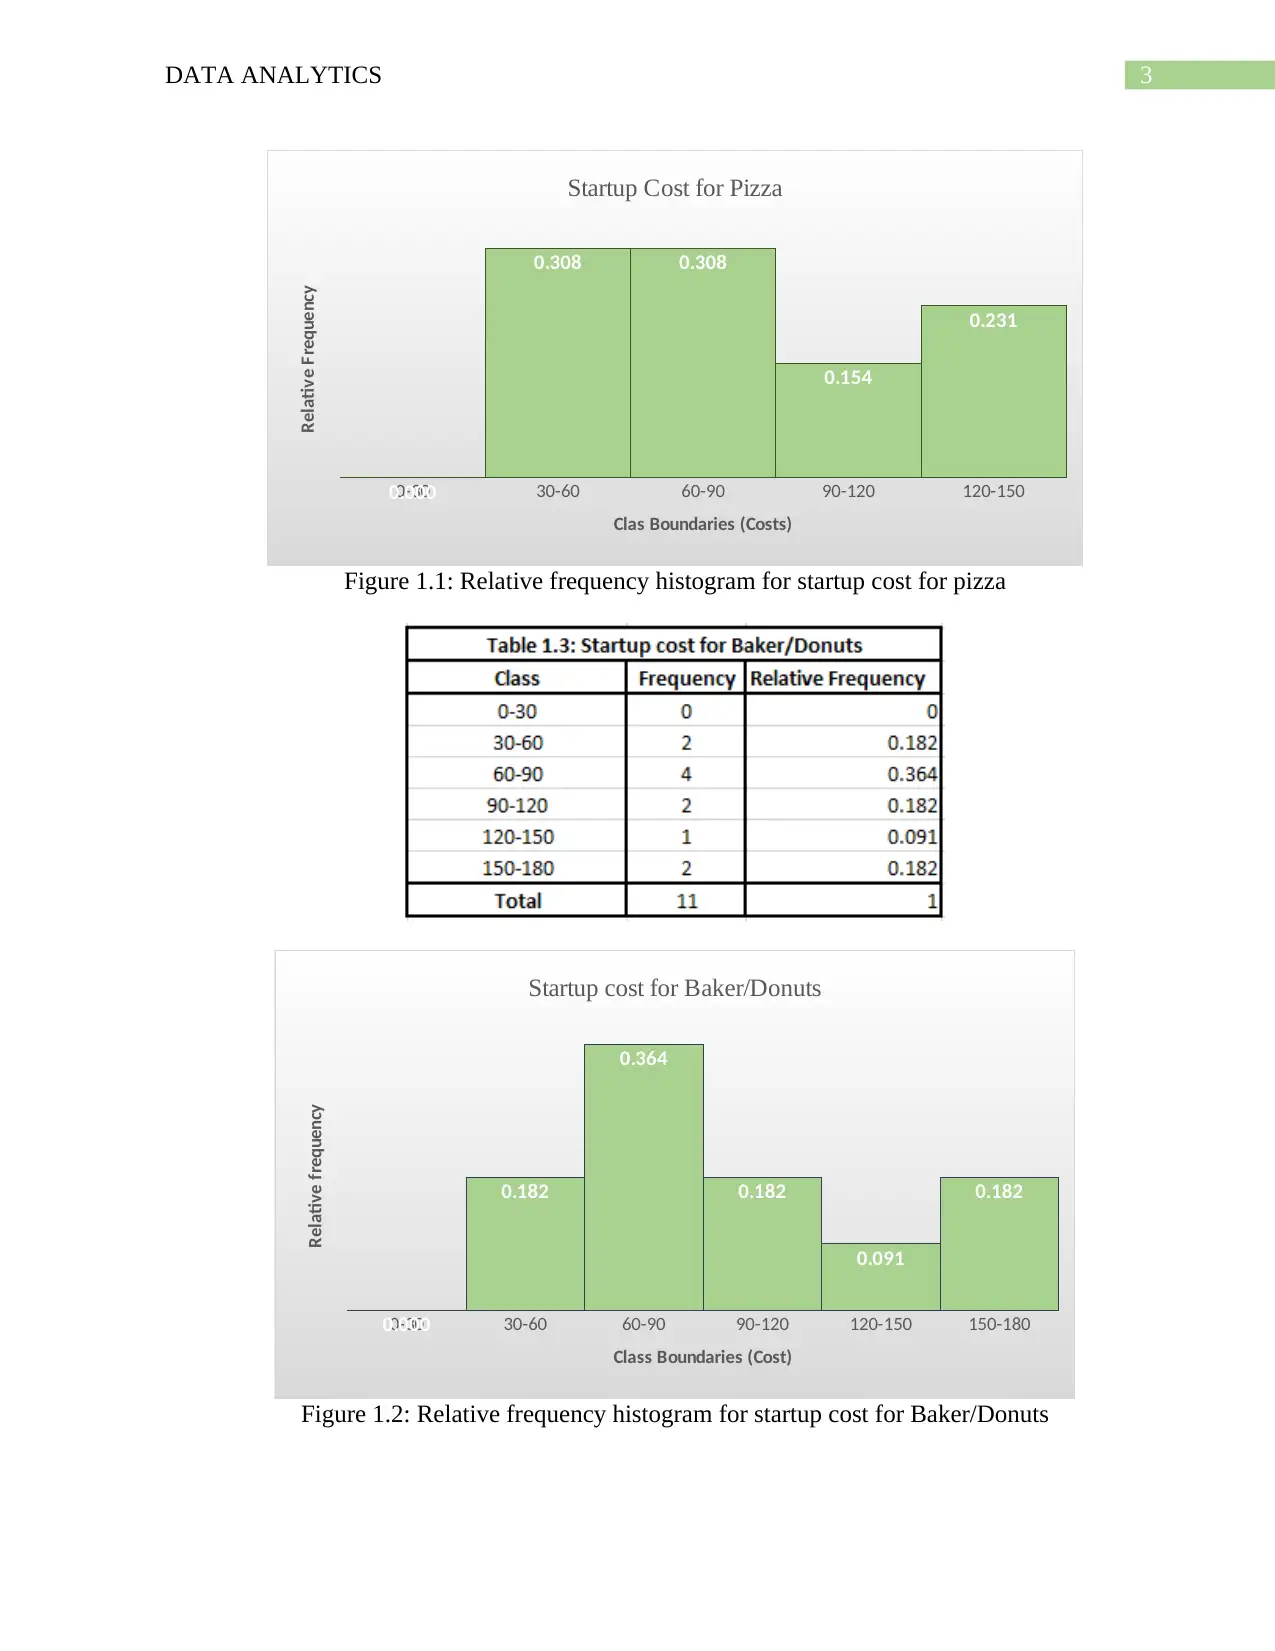
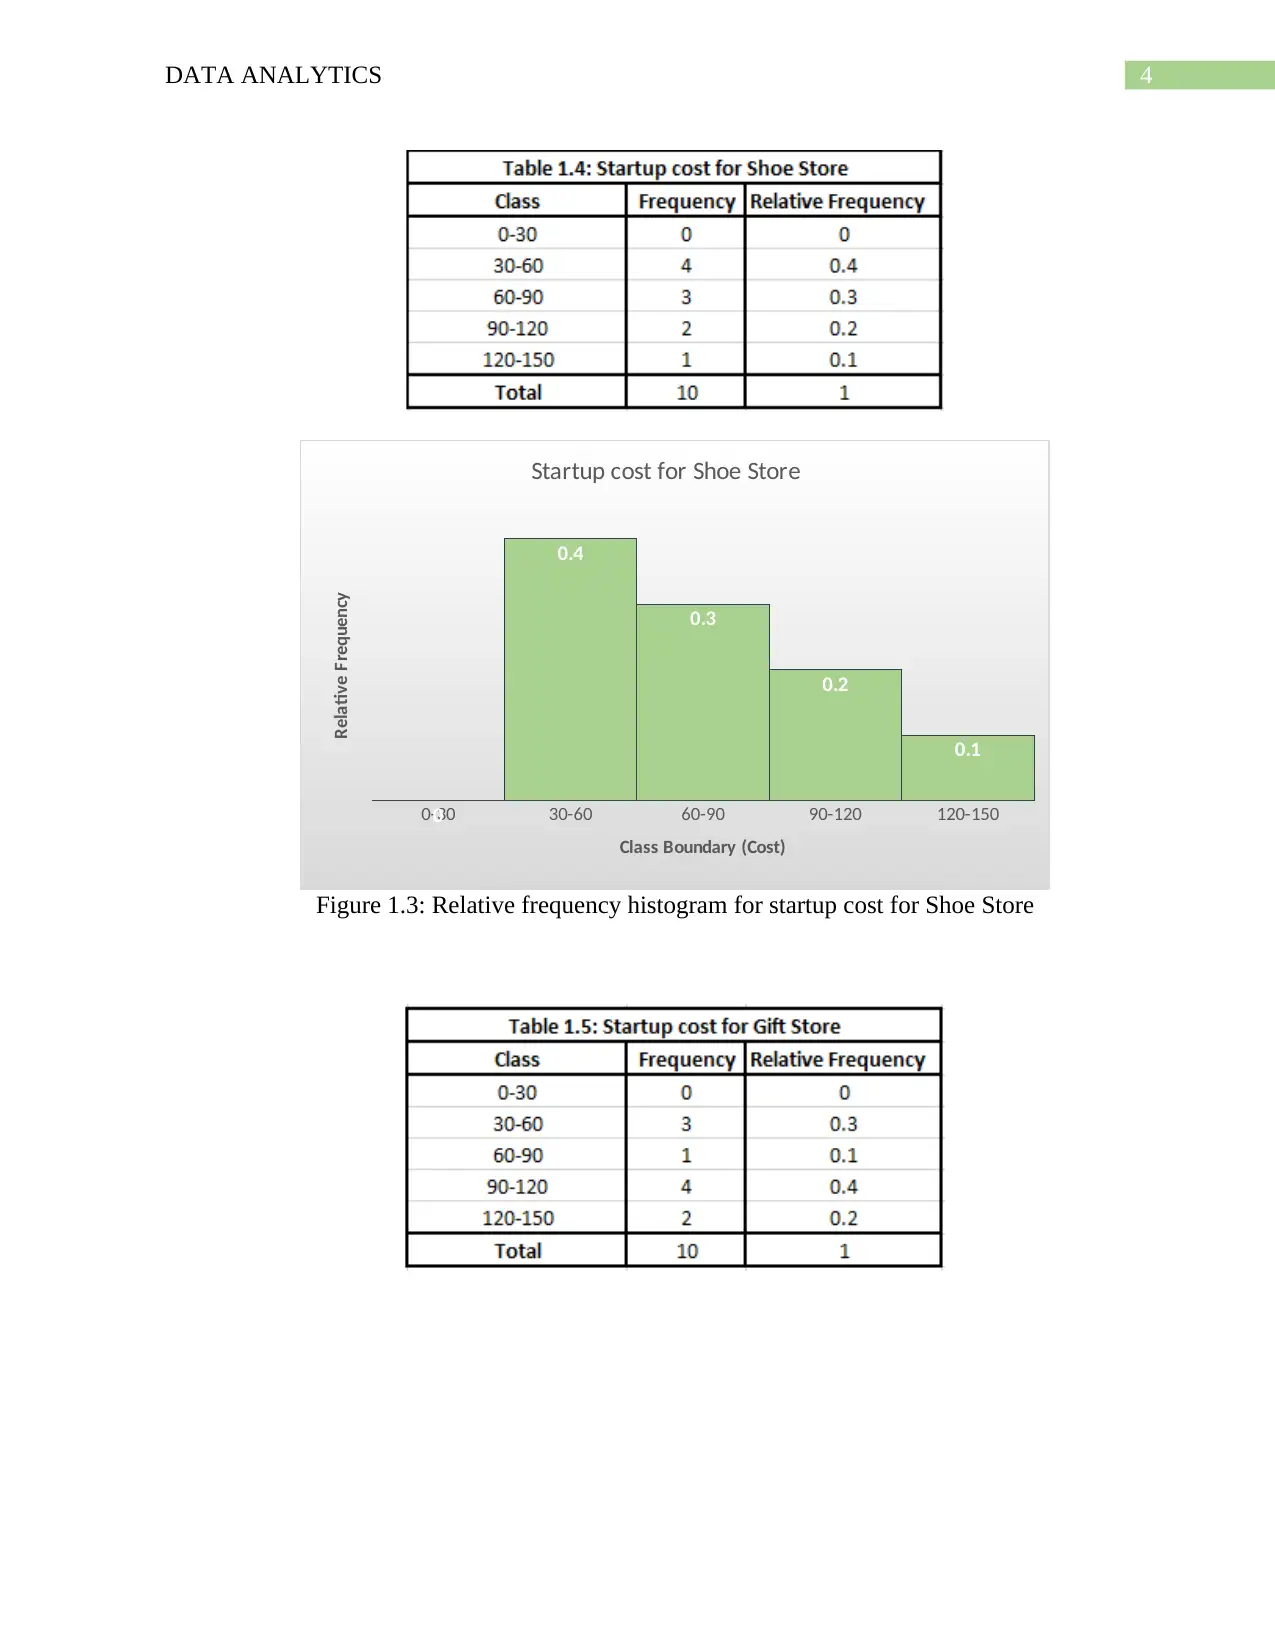
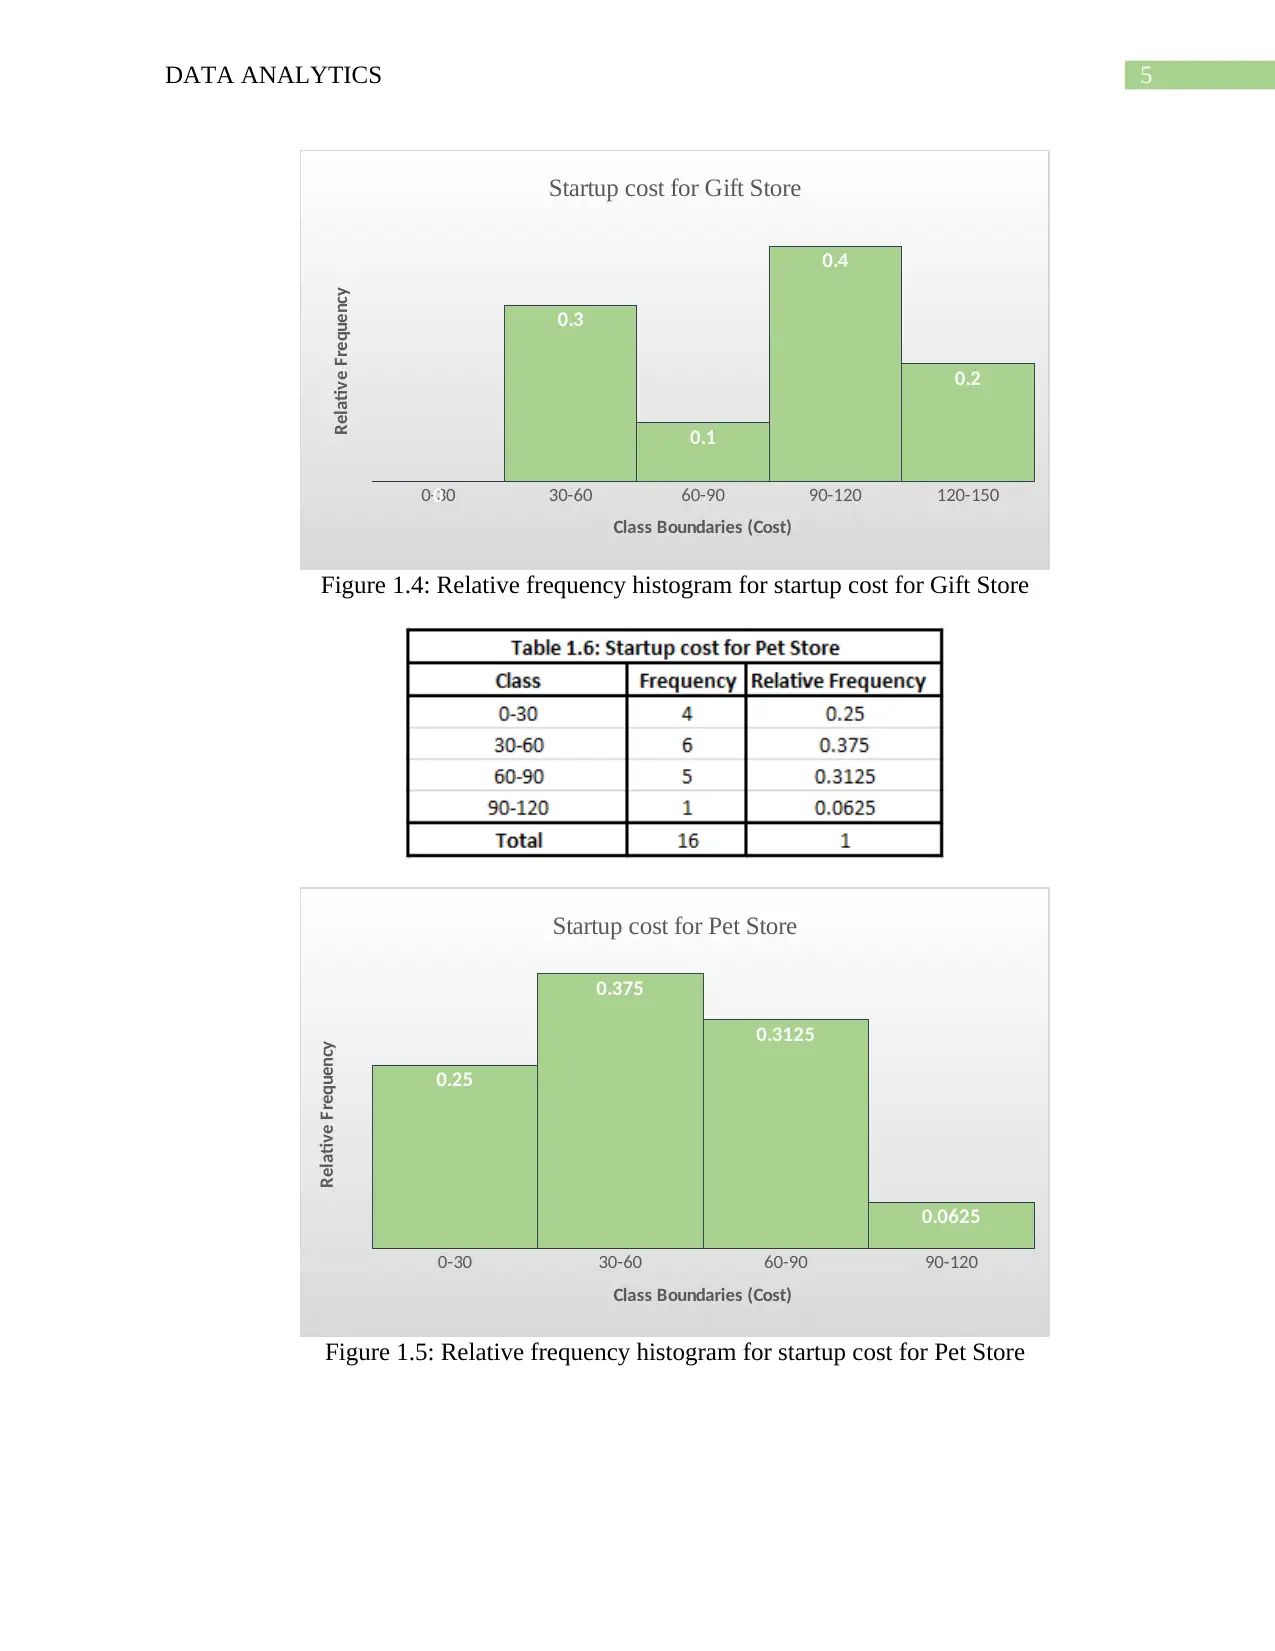
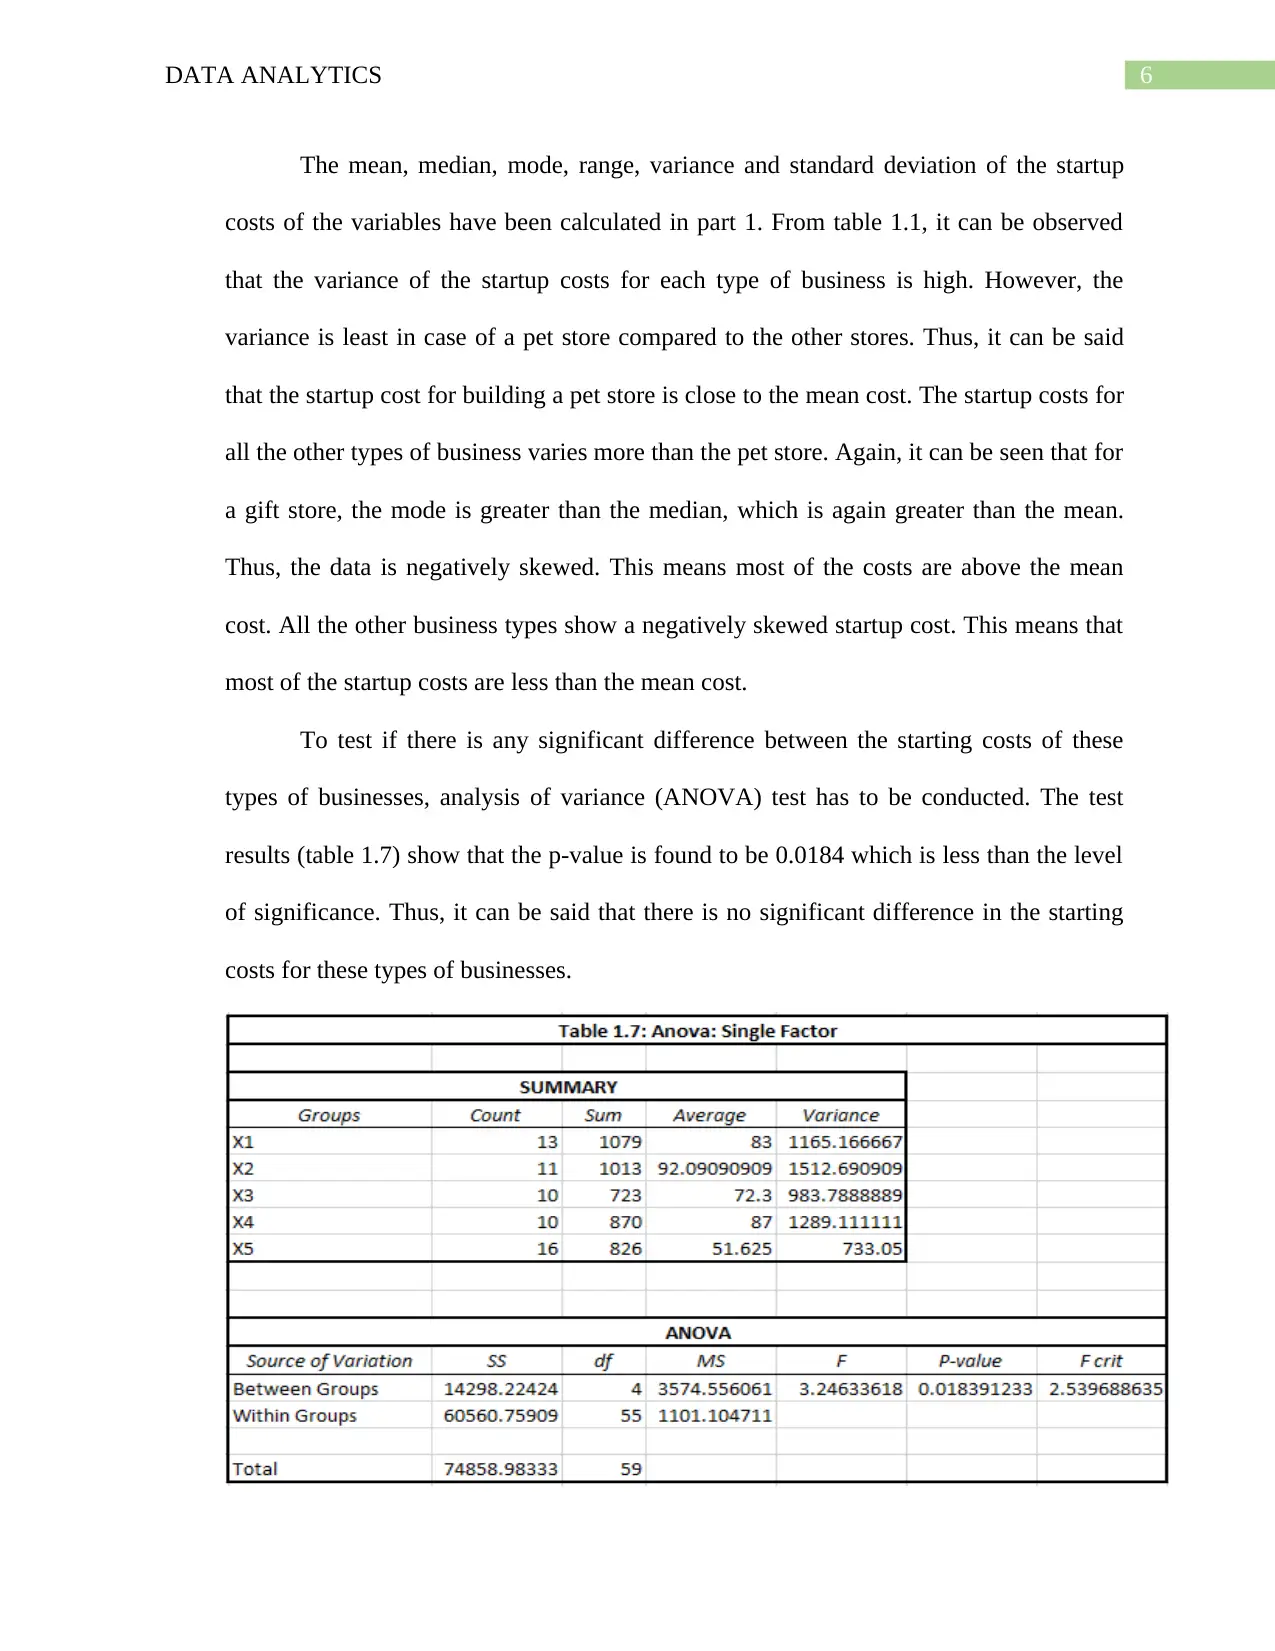
This data analytics report presents a comprehensive analysis of startup costs for five different business types (pizza, baker/donuts, shoe stores, gift stores, and pet stores) and a regression analysis of net annual sales. Descriptive statistics (mean, median, mode, range, variance, standard deviation) are calculated and presented for each business type, along with frequency and relative frequency distributions and histograms. An ANOVA test is conducted to determine if there's a significant difference in startup costs between the business types. The report then moves to a regression analysis, modeling net annual sales based on factors like square footage, inventory, advertising spend, sales district size, and number of competitors. The model's goodness of fit (R-squared) is assessed, and ANOVA is used to test the significance of the overall model. Individual variable significance is evaluated, and confidence intervals for slope coefficients are provided. Finally, the report demonstrates how to use the regression equation to predict annual sales for a specific franchisee scenario.
1 out of 11
Related Documents


Your All-in-One AI-Powered Toolkit for Academic Success.
+13062052269
info@desklib.com
Available 24*7 on WhatsApp / Email
![[object Object]](/_next/static/media/star-bottom.7253800d.svg)
Copyright © 2020–2026 A2Z Services. All Rights Reserved. Developed and managed by ZUCOL.