Data Analytics Report: Income, Education and Financial Satisfaction
VerifiedAdded on 2021/06/17
|46
|4613
|54
Report
AI Summary
This report investigates the relationship between income, education, and financial satisfaction in the United Kingdom. The research utilizes data extracted from the World Values Survey (WVS) to analyze the impact of these variables on financial well-being. The methodology includes descriptive statistics, correlation analysis, and regression analysis using SPSS software. The study explores the conceptual framework, statistical assumptions, and findings, revealing a positive correlation between income and financial satisfaction, and a negative relationship between education and financial satisfaction. The report concludes with a discussion of the results, limitations, and potential implications of the findings.
Running Head: DATA ANALYTICS
Data Analytics
Name of the Student
Name of the University
Author Note
Data Analytics
Name of the Student
Name of the University
Author Note
Paraphrase This Document
Need a fresh take? Get an instant paraphrase of this document with our AI Paraphraser
1DATA ANALYTICS
Executive Summary
The main purpose of this research is to establish the relationship between Income and Education
on Financial Satisfaction. In order to perform the analysis data has been extracted on Income,
Education and Financial Satisfaction from the WVS survey results. Analysis has been performed
using appropriate statistical techniques with the help of the statitical software SPSS. From the
results, positive relationship has been obtained between income and financial satisfaction and
negative relationship has been obtained between education and financial satisfaction.
2DATA ANALYTICS
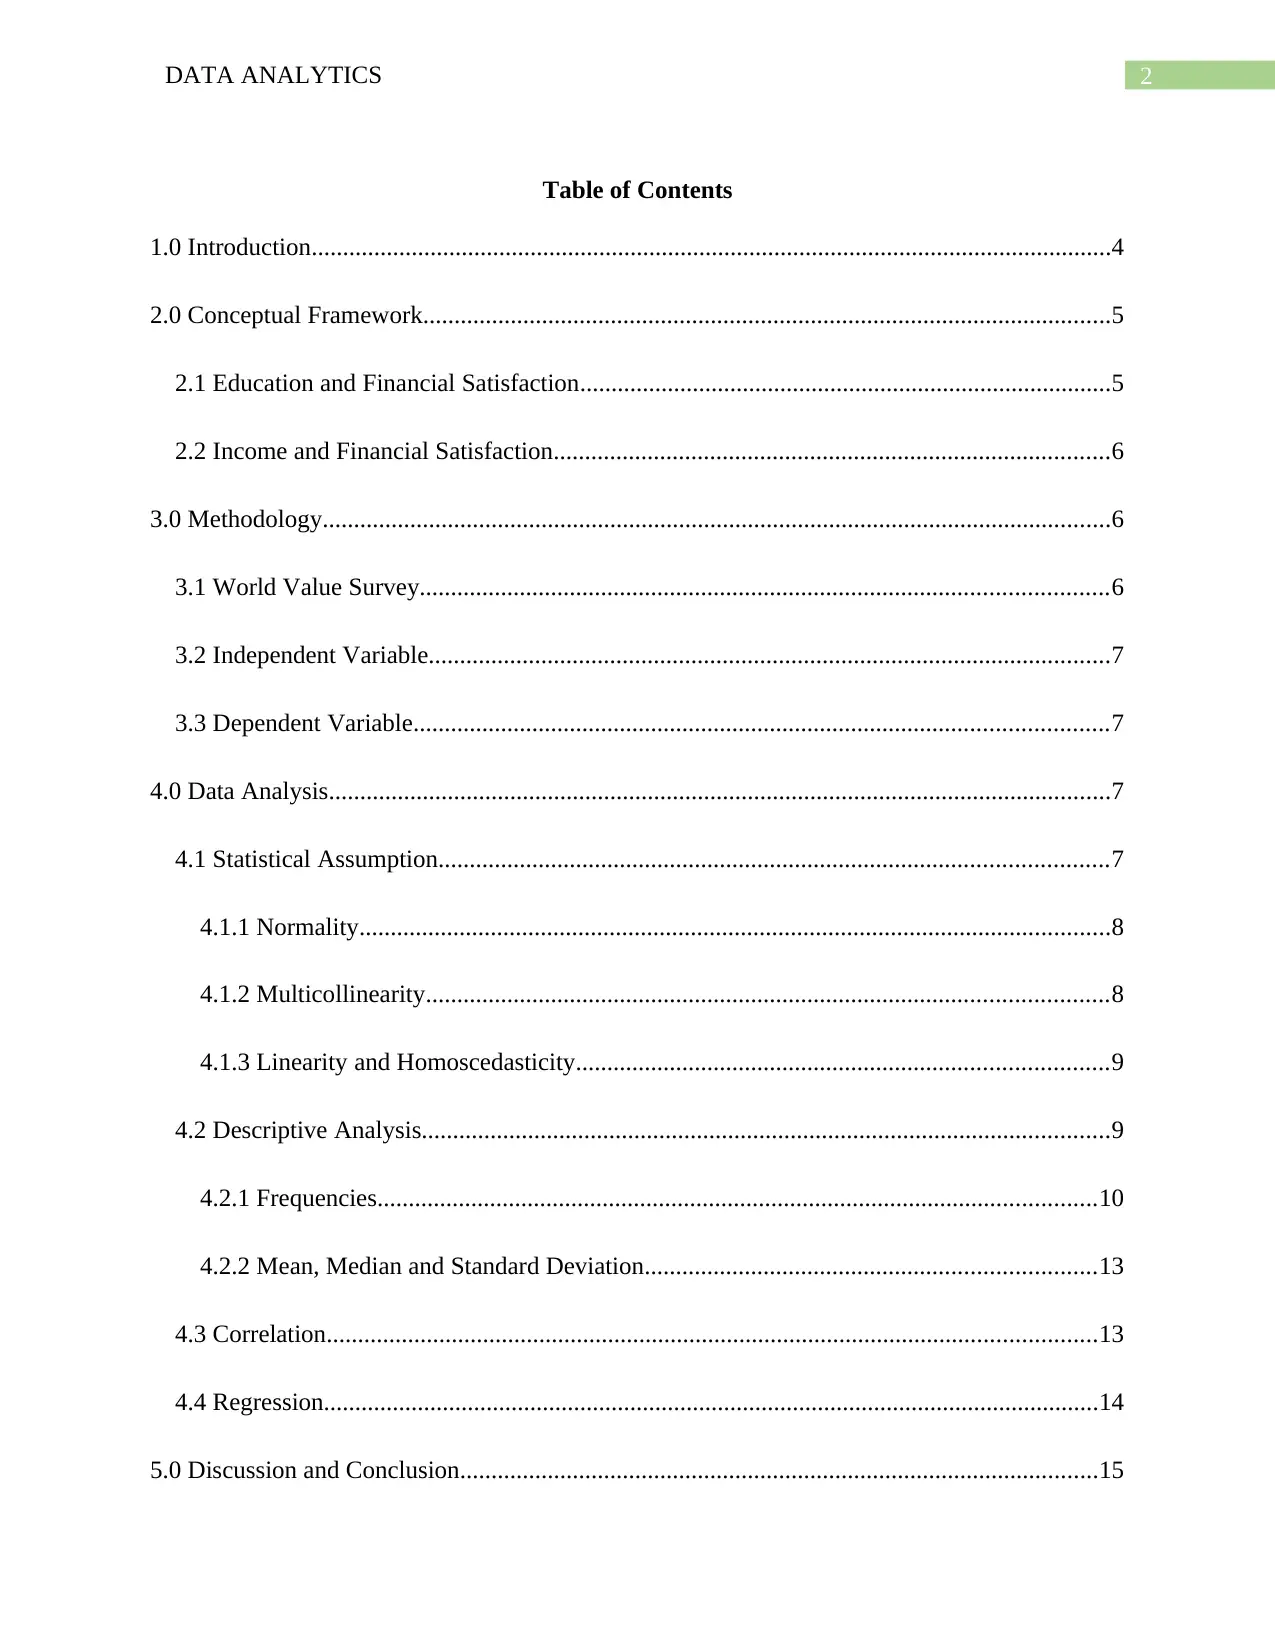
Table of Contents
1.0 Introduction................................................................................................................................4
2.0 Conceptual Framework..............................................................................................................5
2.1 Education and Financial Satisfaction.....................................................................................5
2.2 Income and Financial Satisfaction.........................................................................................6
3.0 Methodology..............................................................................................................................6
3.1 World Value Survey..............................................................................................................6
3.2 Independent Variable.............................................................................................................7
3.3 Dependent Variable...............................................................................................................7
4.0 Data Analysis.............................................................................................................................7
4.1 Statistical Assumption...........................................................................................................7
4.1.1 Normality........................................................................................................................8
4.1.2 Multicollinearity.............................................................................................................8
4.1.3 Linearity and Homoscedasticity.....................................................................................9
4.2 Descriptive Analysis..............................................................................................................9
4.2.1 Frequencies...................................................................................................................10
4.2.2 Mean, Median and Standard Deviation........................................................................13
4.3 Correlation...........................................................................................................................13
4.4 Regression............................................................................................................................14
5.0 Discussion and Conclusion......................................................................................................15
⊘ This is a preview!⊘
Do you want full access?
Subscribe today to unlock all pages.
Trusted by 1+ million students worldwide

3DATA ANALYTICS
References......................................................................................................................................17
Appendices....................................................................................................................................17
References......................................................................................................................................17
Appendices....................................................................................................................................17
Paraphrase This Document
Need a fresh take? Get an instant paraphrase of this document with our AI Paraphraser
4DATA ANALYTICS
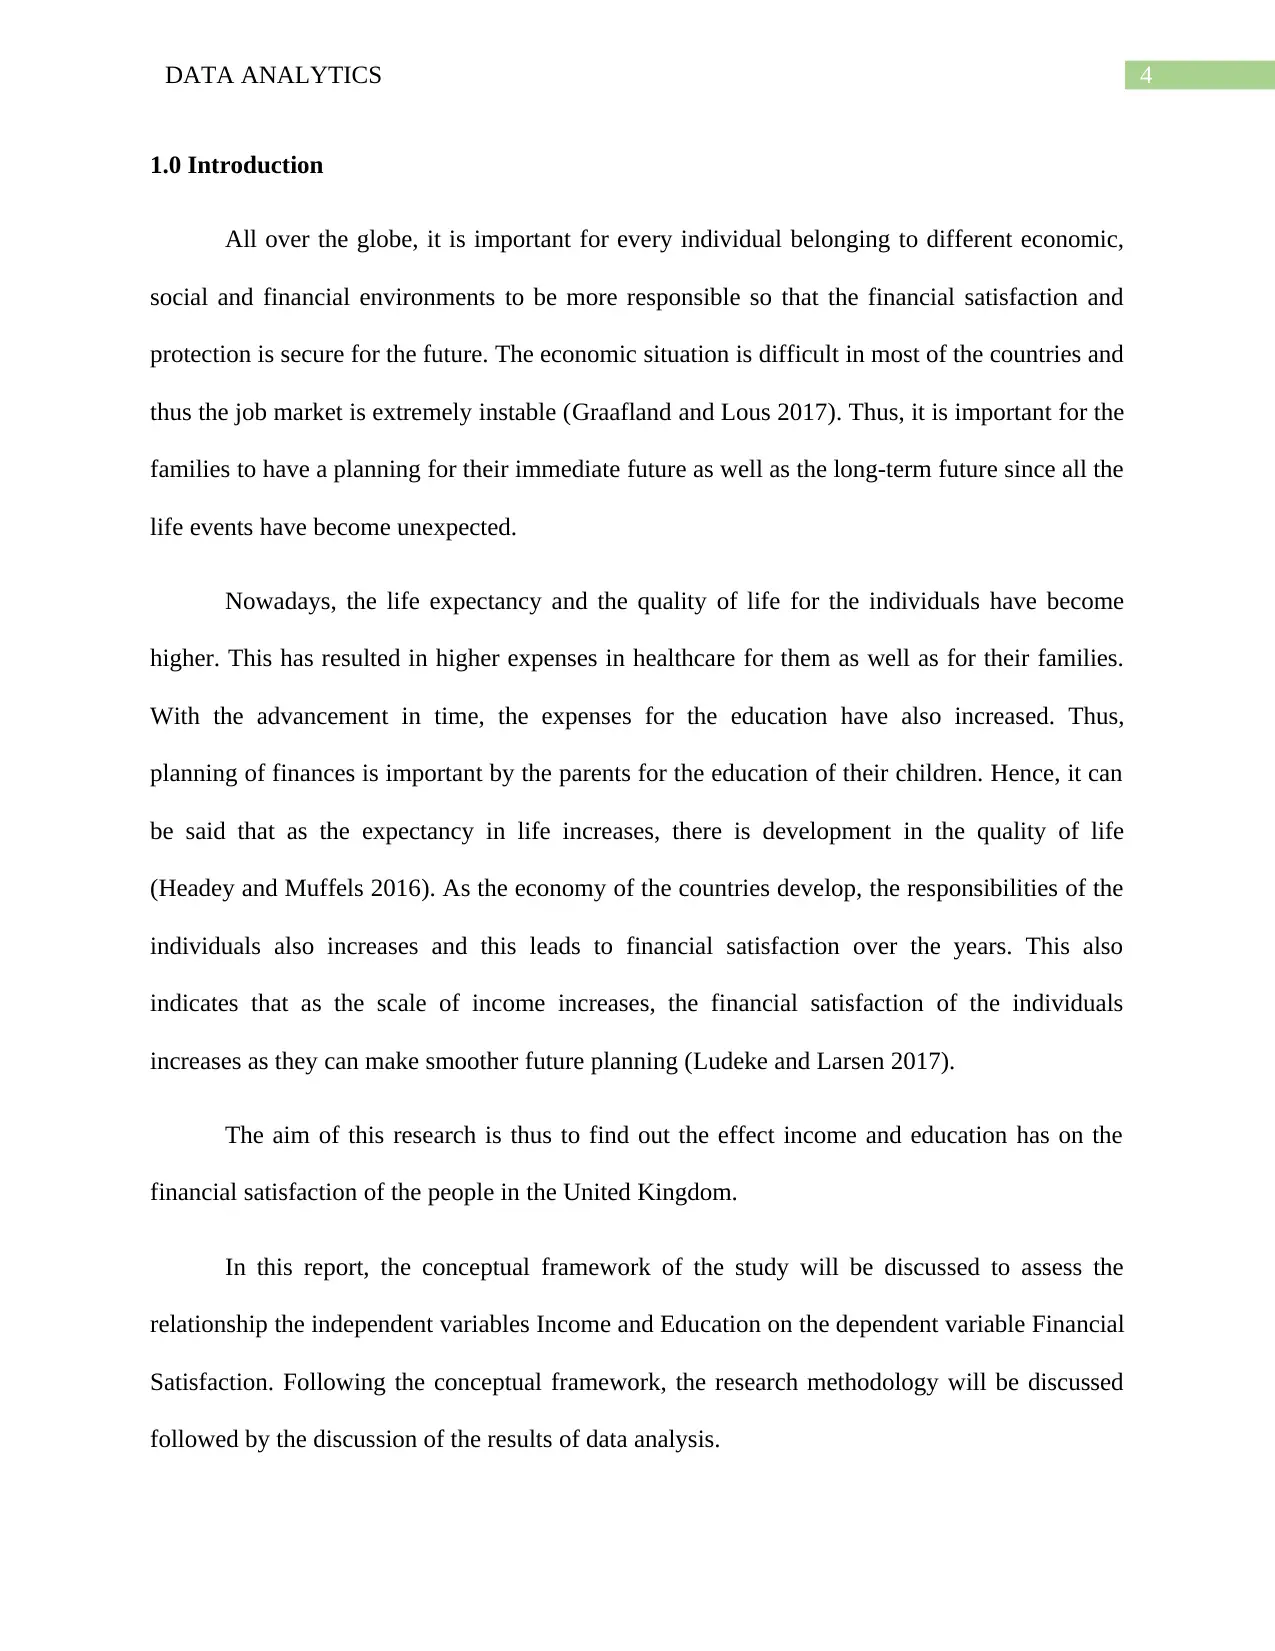
1.0 Introduction
All over the globe, it is important for every individual belonging to different economic,
social and financial environments to be more responsible so that the financial satisfaction and
protection is secure for the future. The economic situation is difficult in most of the countries and
thus the job market is extremely instable (Graafland and Lous 2017). Thus, it is important for the
families to have a planning for their immediate future as well as the long-term future since all the
life events have become unexpected.
Nowadays, the life expectancy and the quality of life for the individuals have become
higher. This has resulted in higher expenses in healthcare for them as well as for their families.
With the advancement in time, the expenses for the education have also increased. Thus,
planning of finances is important by the parents for the education of their children. Hence, it can
be said that as the expectancy in life increases, there is development in the quality of life
(Headey and Muffels 2016). As the economy of the countries develop, the responsibilities of the
individuals also increases and this leads to financial satisfaction over the years. This also
indicates that as the scale of income increases, the financial satisfaction of the individuals
increases as they can make smoother future planning (Ludeke and Larsen 2017).
The aim of this research is thus to find out the effect income and education has on the
financial satisfaction of the people in the United Kingdom.
In this report, the conceptual framework of the study will be discussed to assess the
relationship the independent variables Income and Education on the dependent variable Financial
Satisfaction. Following the conceptual framework, the research methodology will be discussed
followed by the discussion of the results of data analysis.
5DATA ANALYTICS
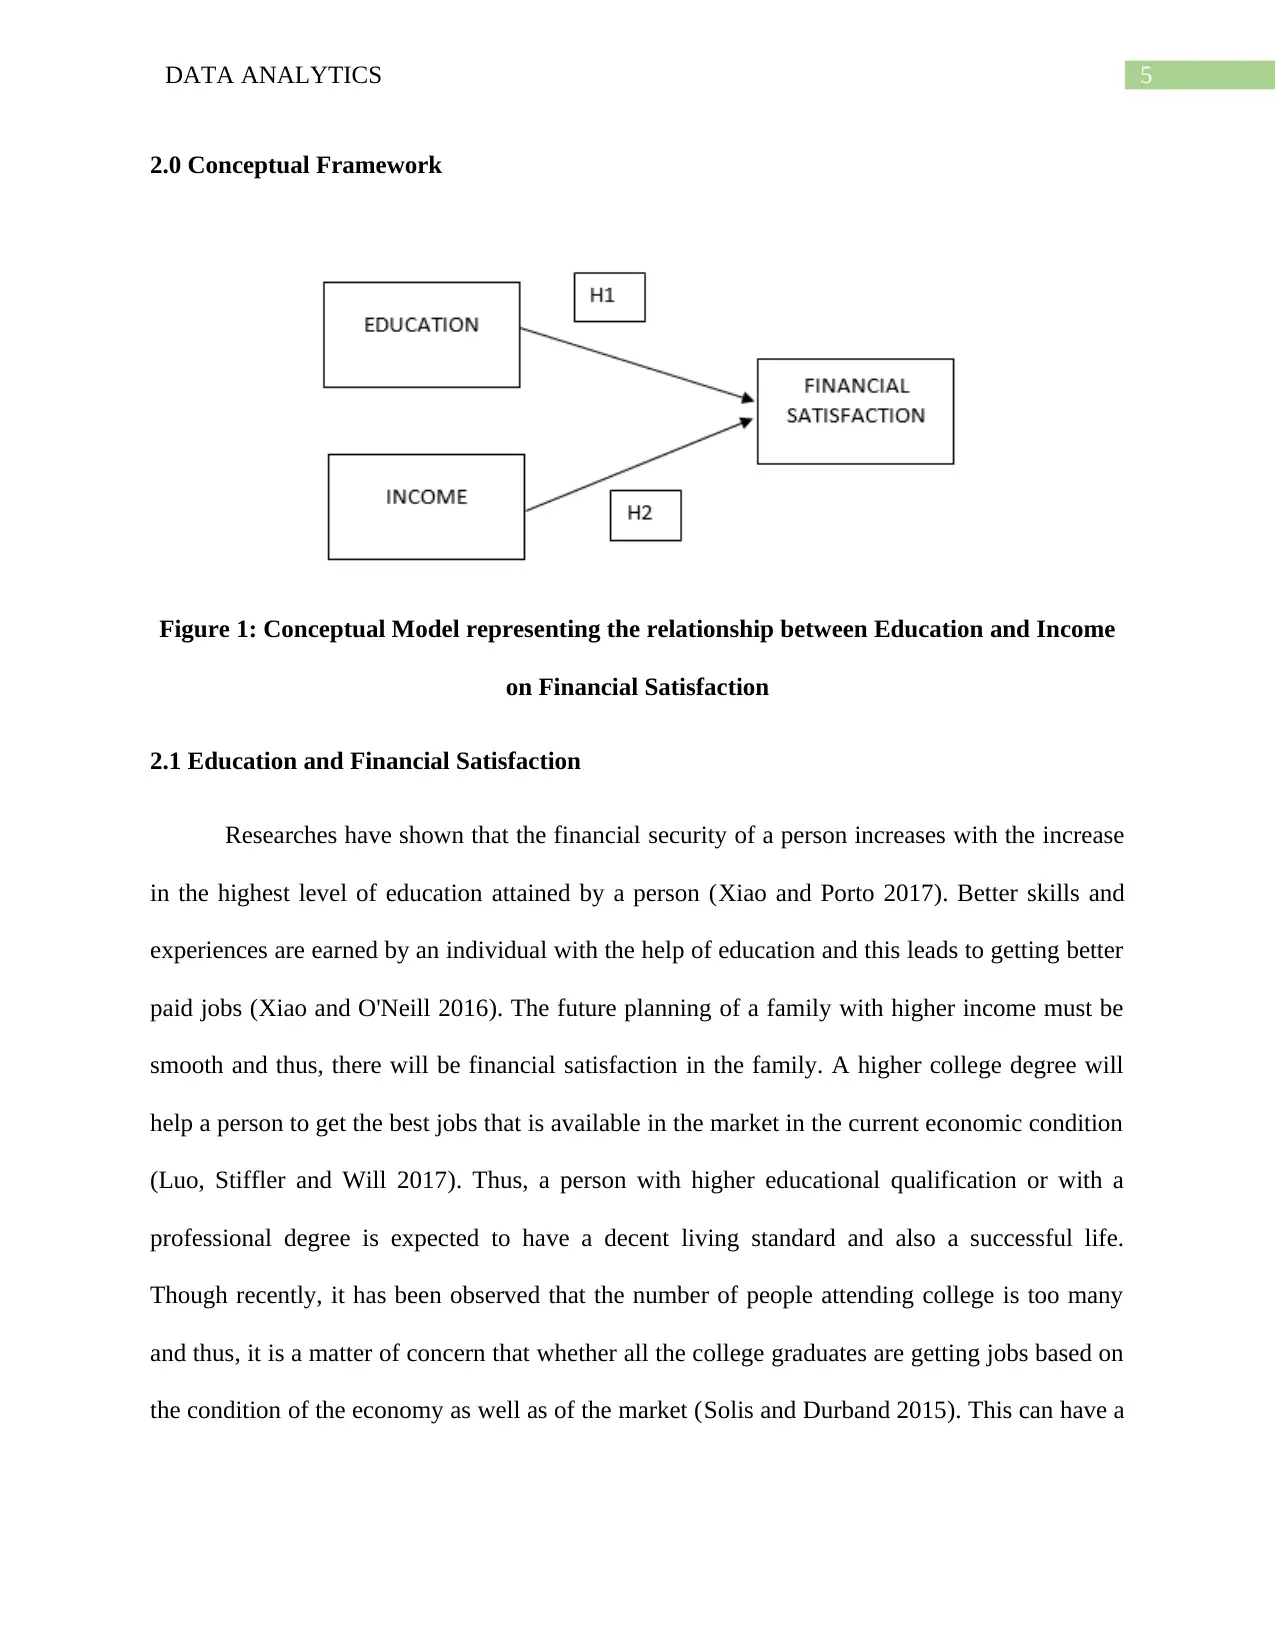
2.0 Conceptual Framework
Figure 1: Conceptual Model representing the relationship between Education and Income
on Financial Satisfaction
2.1 Education and Financial Satisfaction
Researches have shown that the financial security of a person increases with the increase
in the highest level of education attained by a person (Xiao and Porto 2017). Better skills and
experiences are earned by an individual with the help of education and this leads to getting better
paid jobs (Xiao and O'Neill 2016). The future planning of a family with higher income must be
smooth and thus, there will be financial satisfaction in the family. A higher college degree will
help a person to get the best jobs that is available in the market in the current economic condition
(Luo, Stiffler and Will 2017). Thus, a person with higher educational qualification or with a
professional degree is expected to have a decent living standard and also a successful life.
Though recently, it has been observed that the number of people attending college is too many
and thus, it is a matter of concern that whether all the college graduates are getting jobs based on
the condition of the economy as well as of the market (Solis and Durband 2015). This can have a
⊘ This is a preview!⊘
Do you want full access?
Subscribe today to unlock all pages.
Trusted by 1+ million students worldwide
6DATA ANALYTICS
negative effect on the financial satisfaction of a person. If a person is unable to have a job which
is suitable to this or her level, the financial satisfaction of that person will be less.
Hypothesis 1: The Education of people has a positive impact on the Financial Satisfaction of the
person and are related positively.
2.2 Income and Financial Satisfaction
One of the most researched topics is financial satisfaction of the people. There has been
observation of various concepts and results from various studies based on the relationship
between income of the people and their financial satisfaction. It has been found out by Mulligan
(2013) that there is a positive relationship between income and financial satisfaction. The effects
have found to differ in the multivariate context moreover. The effect of income and financial
satisfaction has been found to be positive among males but not so strong with females. Further,
this difference in financial satisfaction has also been observed across religion. The effect has
been found to be strong in lesser religious people and weak in highly religious people. According
to Powdthavee and Wooden (2015), when there is not satisfactory income for a family, it is a
misery for them. Thus, there should be a positive relationship between income and Financial
Satisfaction.
Hypothesis 2: The relationship between Income and Financial Satisfaction of the people in UK
is positive.
3.0 Methodology
Quantitative analysis techniques have been used to carry out this research. Based on the
results obtained from the hypotheses testing, a deductive analysis has also been performed. The
data used for this analysis has been collected from World Values Survey (WVS) Wave 5.
Paraphrase This Document
Need a fresh take? Get an instant paraphrase of this document with our AI Paraphraser
7DATA ANALYTICS
3.1 World Value Survey
For the purpose of this research data has been collected from the WVS sources, who
conducted the survey by designing a questionnaire which was distributed to the citizens of the
United Kingdom selected randomly. WVS conducted the survey in the year 2005
(Worldvaluessurvey.org, 2005). There is a disadvantage to this data collection method. The
survey has been conducted generally and not with respect to any particular study. Thus,
questions may arise about the validity of the data.
3.2 Independent Variable
Independent variables are the variables which are used to predict other variables and
themselves cannot be affected by other variables (Gupta 2017). In this study, the independent
variables that has been considered are Income and Education of the respondents.
3.3 Dependent Variable
Dependent variables are the variables, measurement of which are performed on the basis
of the independent variables. Thus, if there are changes in the independent variables, it is
expected that there should be changes in the dependent variable as well (Holcomb 2016). In this
study, the dependent variable that has been considered is Financial satisfaction.
4.0 Data Analysis
The data that has been collected from the data sources of WVS has been analyzed with
the help of the statistical software SPSS. The analyses are shown and discussed further in this
report.
4.1 Statistical Assumption
8DATA ANALYTICS
Before starting the analysis of the data, it is necessary to find out whether the data is
suitable for the analysis. For that, the data has to satisfy certain assumptions. These are
Normality, linearity, multicollinearity and homoscedasticity (Ott and Longnecker 2015). The
residuals of the dependent variable must be normal and homoscedastic and the independent
variables must be free from multicollinearity. There should be a linearity between the variables.
Satisfying all these assumptions, further analysis will be performed on the data.
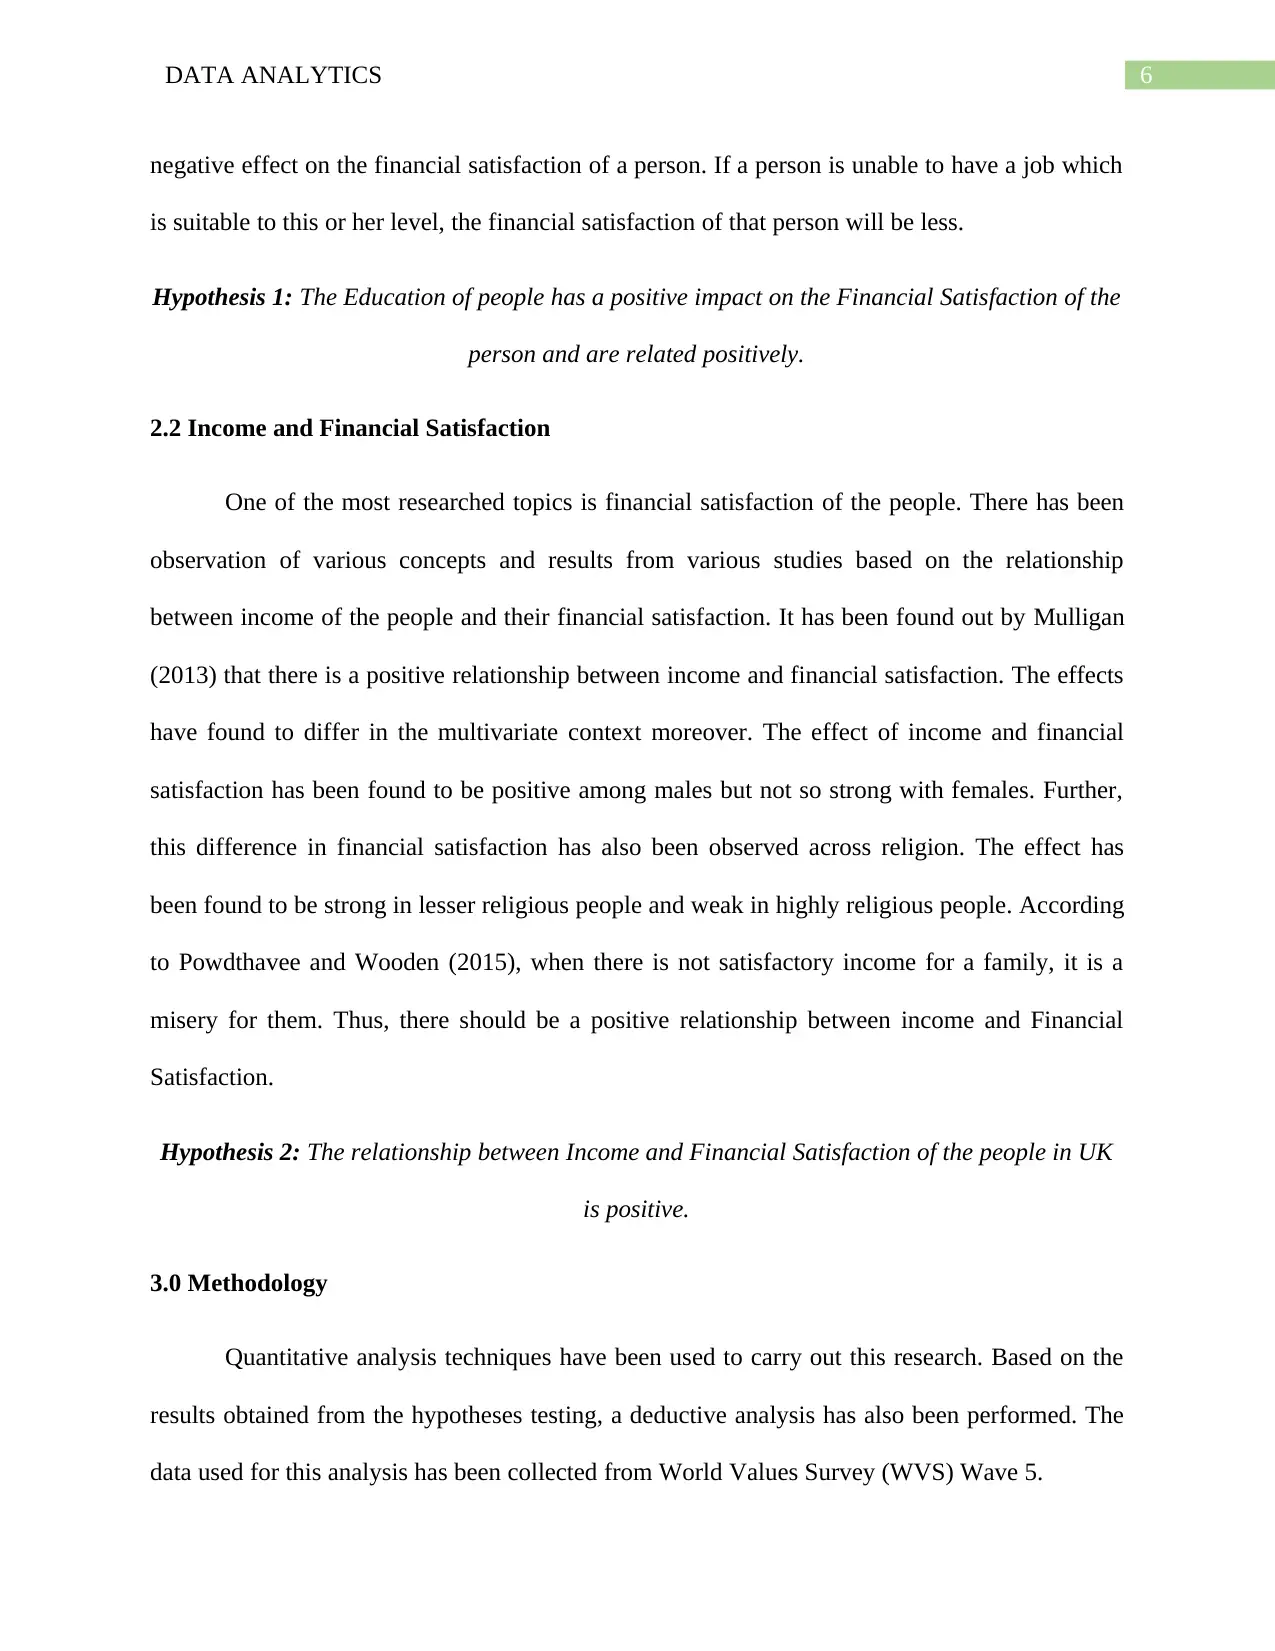
4.1.1 Normality
From the normal Q-Q plot obtained as a result of the normality test of the variables, it can
be seen that the residuals of the dependent variable financial satisfaction follow a linear trend.
This indicates that the residuals follow the assumption of normality.
Figure 2: Normal Q-Q Plot of the Residuals of the dependent variable
4.1.2 Multicollinearity
The presence of inter-relations between the independent variables are determined with
the help of multicollinearity. The VIF indicates the presence of multicollinearity between the
Before starting the analysis of the data, it is necessary to find out whether the data is
suitable for the analysis. For that, the data has to satisfy certain assumptions. These are
Normality, linearity, multicollinearity and homoscedasticity (Ott and Longnecker 2015). The
residuals of the dependent variable must be normal and homoscedastic and the independent
variables must be free from multicollinearity. There should be a linearity between the variables.
Satisfying all these assumptions, further analysis will be performed on the data.
4.1.1 Normality
From the normal Q-Q plot obtained as a result of the normality test of the variables, it can
be seen that the residuals of the dependent variable financial satisfaction follow a linear trend.
This indicates that the residuals follow the assumption of normality.
Figure 2: Normal Q-Q Plot of the Residuals of the dependent variable
4.1.2 Multicollinearity
The presence of inter-relations between the independent variables are determined with
the help of multicollinearity. The VIF indicates the presence of multicollinearity between the
⊘ This is a preview!⊘
Do you want full access?
Subscribe today to unlock all pages.
Trusted by 1+ million students worldwide
9DATA ANALYTICS
independent variables. A VIF value higher than 5 indicates the presence of multicollinearity. In
this case, the VIF value is less than 5 as can be seen from table 1 (Fahrmeir 2013). Thus, the
problem of multicollinearity does not exist. Hence, the independent variables are not inter-related
and will be of help to the analysis.
Table 1: Collinearity Statistics
Tolerance VIF
0.928 1.078
0.928 1.078
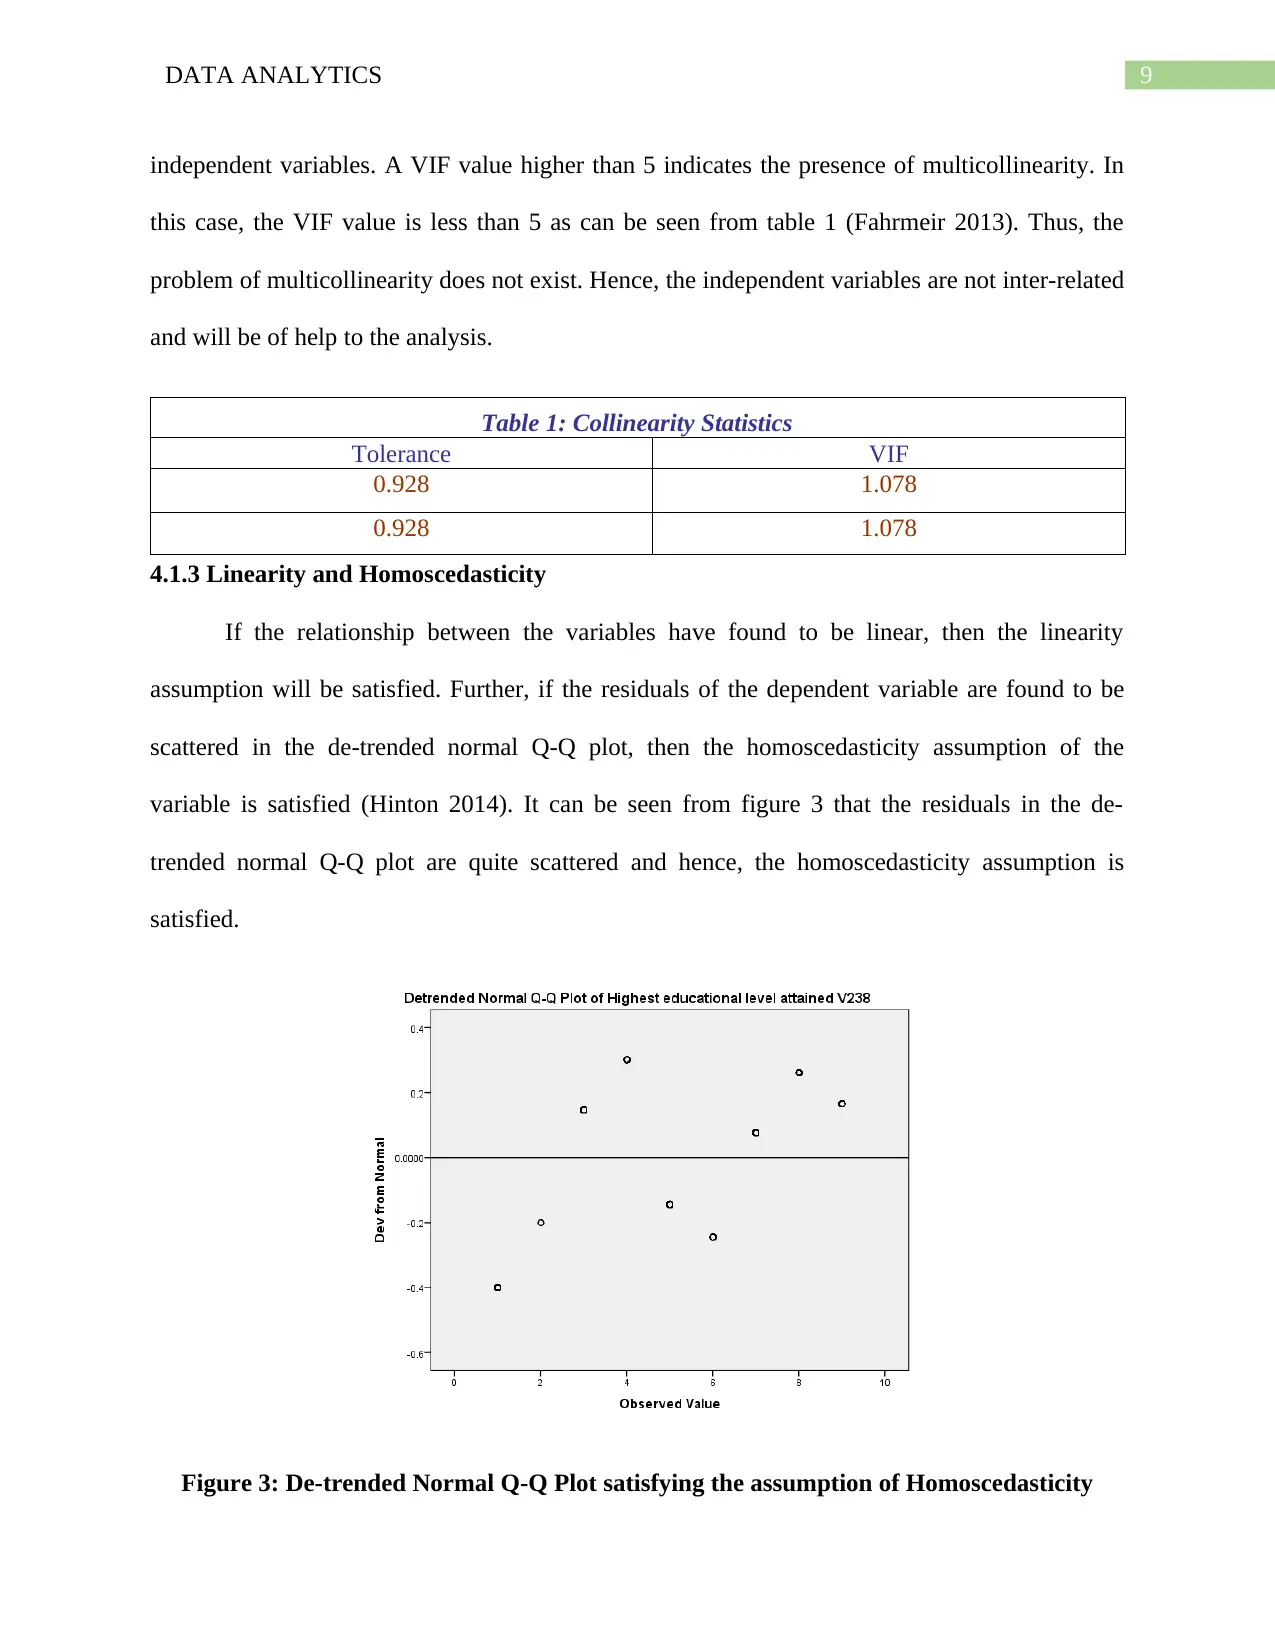
4.1.3 Linearity and Homoscedasticity
If the relationship between the variables have found to be linear, then the linearity
assumption will be satisfied. Further, if the residuals of the dependent variable are found to be
scattered in the de-trended normal Q-Q plot, then the homoscedasticity assumption of the
variable is satisfied (Hinton 2014). It can be seen from figure 3 that the residuals in the de-
trended normal Q-Q plot are quite scattered and hence, the homoscedasticity assumption is
satisfied.
Figure 3: De-trended Normal Q-Q Plot satisfying the assumption of Homoscedasticity
independent variables. A VIF value higher than 5 indicates the presence of multicollinearity. In
this case, the VIF value is less than 5 as can be seen from table 1 (Fahrmeir 2013). Thus, the
problem of multicollinearity does not exist. Hence, the independent variables are not inter-related
and will be of help to the analysis.
Table 1: Collinearity Statistics
Tolerance VIF
0.928 1.078
0.928 1.078
4.1.3 Linearity and Homoscedasticity
If the relationship between the variables have found to be linear, then the linearity
assumption will be satisfied. Further, if the residuals of the dependent variable are found to be
scattered in the de-trended normal Q-Q plot, then the homoscedasticity assumption of the
variable is satisfied (Hinton 2014). It can be seen from figure 3 that the residuals in the de-
trended normal Q-Q plot are quite scattered and hence, the homoscedasticity assumption is
satisfied.
Figure 3: De-trended Normal Q-Q Plot satisfying the assumption of Homoscedasticity
Paraphrase This Document
Need a fresh take? Get an instant paraphrase of this document with our AI Paraphraser
10DATA ANALYTICS
4.2 Descriptive Analysis
The number or percentage of occurrences of an event in a variable is established with the
help of the descriptive statistics measures. Further the shape of the data can also be understood
with the help of these measures (Anderson et al. 2013).
4.2.1 Frequencies
With the help of the frequency distribution table, the number of responses and their
percentages for each category of a variable are illustrated (Sullivan 2013).
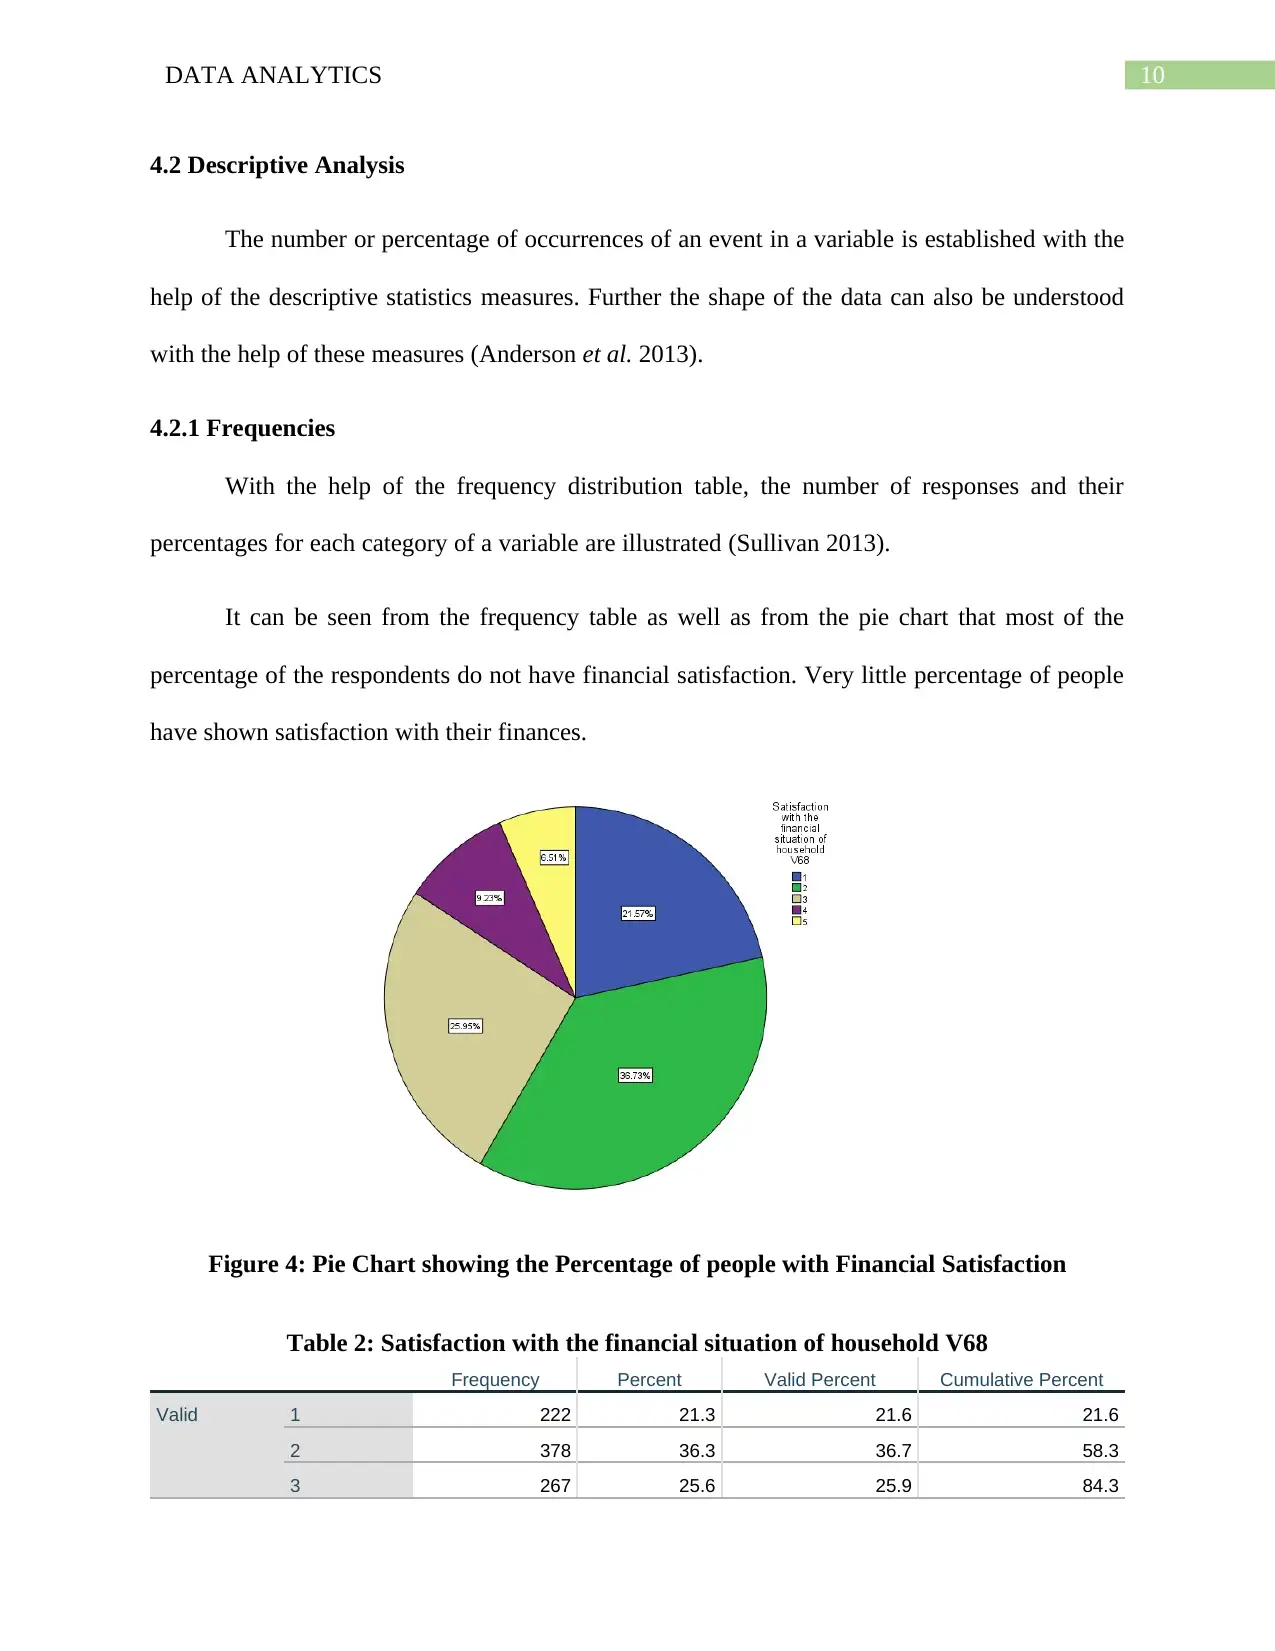
It can be seen from the frequency table as well as from the pie chart that most of the
percentage of the respondents do not have financial satisfaction. Very little percentage of people
have shown satisfaction with their finances.
Figure 4: Pie Chart showing the Percentage of people with Financial Satisfaction
Table 2: Satisfaction with the financial situation of household V68
Frequency Percent Valid Percent Cumulative Percent
Valid 1 222 21.3 21.6 21.6
2 378 36.3 36.7 58.3
3 267 25.6 25.9 84.3
4.2 Descriptive Analysis
The number or percentage of occurrences of an event in a variable is established with the
help of the descriptive statistics measures. Further the shape of the data can also be understood
with the help of these measures (Anderson et al. 2013).
4.2.1 Frequencies
With the help of the frequency distribution table, the number of responses and their
percentages for each category of a variable are illustrated (Sullivan 2013).
It can be seen from the frequency table as well as from the pie chart that most of the
percentage of the respondents do not have financial satisfaction. Very little percentage of people
have shown satisfaction with their finances.
Figure 4: Pie Chart showing the Percentage of people with Financial Satisfaction
Table 2: Satisfaction with the financial situation of household V68
Frequency Percent Valid Percent Cumulative Percent
Valid 1 222 21.3 21.6 21.6
2 378 36.3 36.7 58.3
3 267 25.6 25.9 84.3
11DATA ANALYTICS
4 95 9.1 9.2 93.5
5 67 6.4 6.5 100.0
Total 1029 98.8 100.0
Missing System 12 1.2
Total 1041 100.0
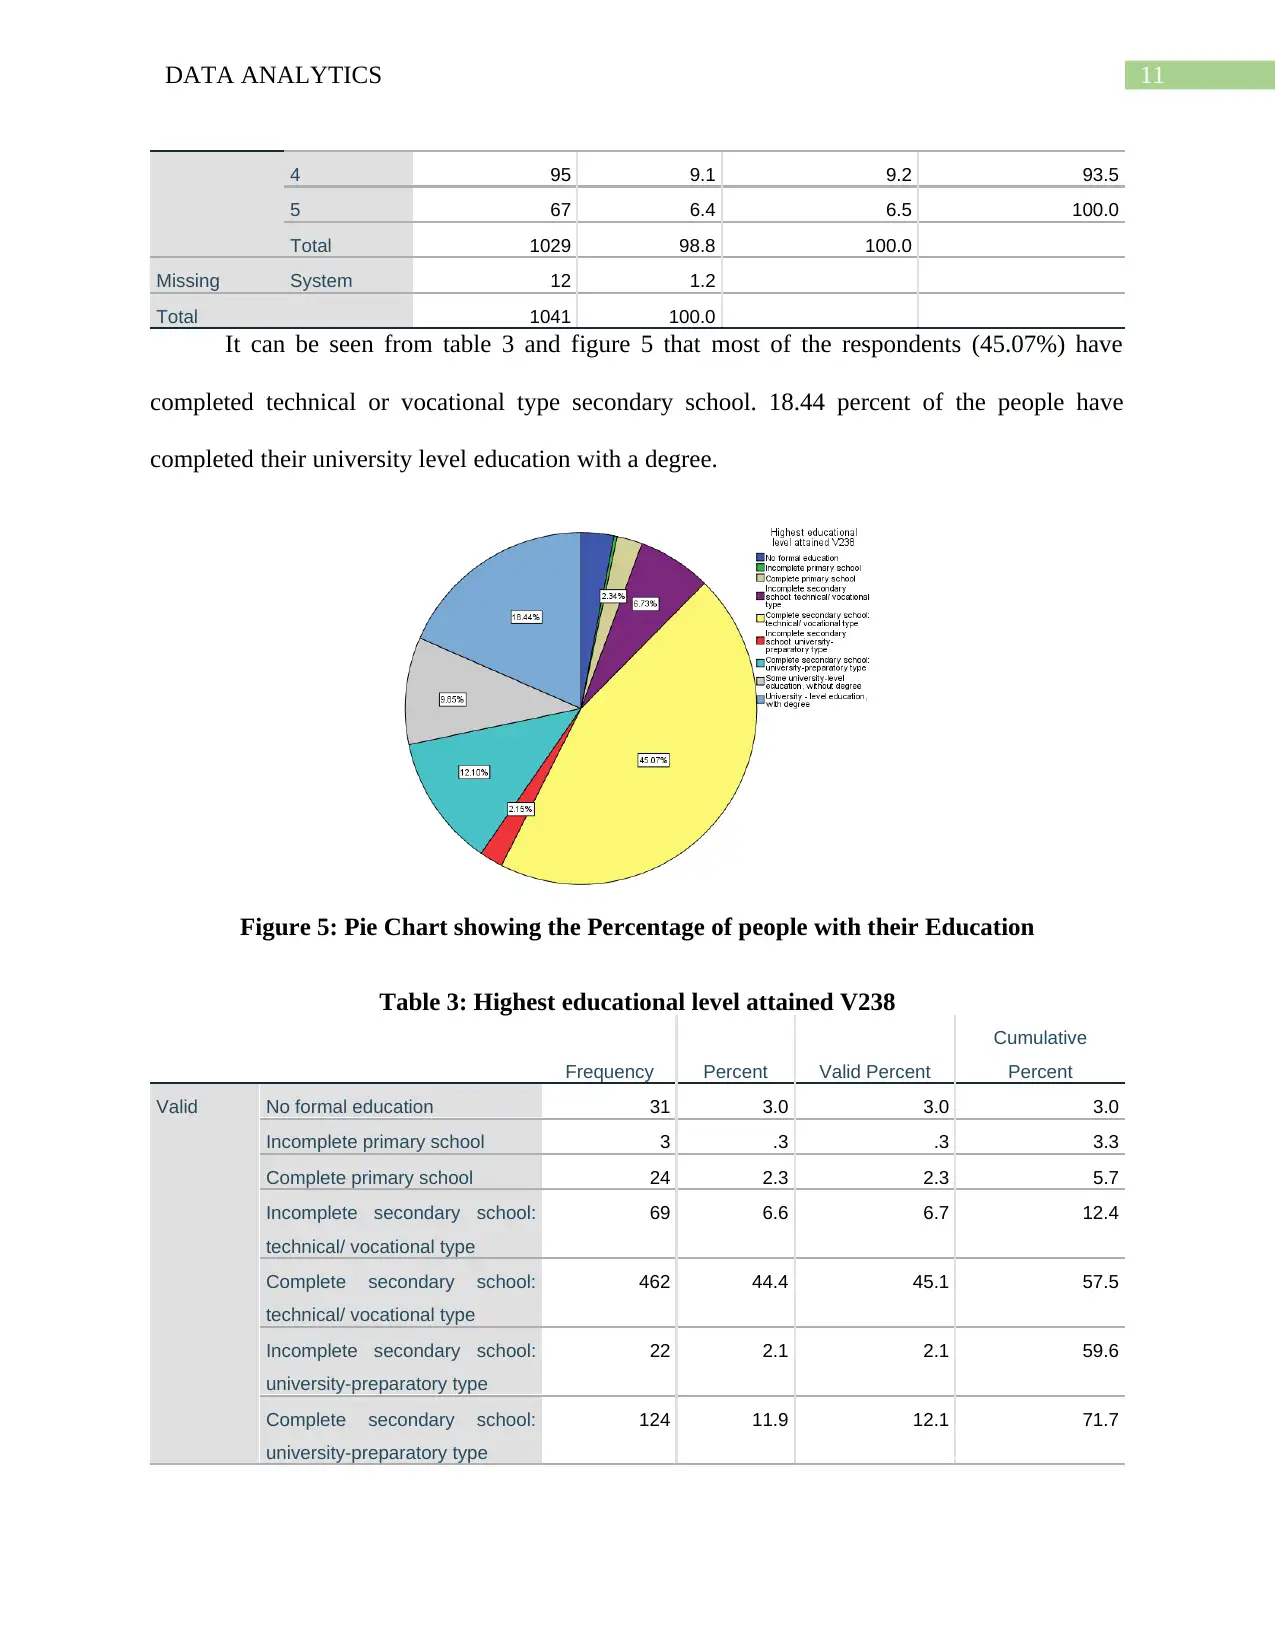
It can be seen from table 3 and figure 5 that most of the respondents (45.07%) have
completed technical or vocational type secondary school. 18.44 percent of the people have
completed their university level education with a degree.
Figure 5: Pie Chart showing the Percentage of people with their Education
Table 3: Highest educational level attained V238
Frequency Percent Valid Percent
Cumulative
Percent
Valid No formal education 31 3.0 3.0 3.0
Incomplete primary school 3 .3 .3 3.3
Complete primary school 24 2.3 2.3 5.7
Incomplete secondary school:
technical/ vocational type
69 6.6 6.7 12.4
Complete secondary school:
technical/ vocational type
462 44.4 45.1 57.5
Incomplete secondary school:
university-preparatory type
22 2.1 2.1 59.6
Complete secondary school:
university-preparatory type
124 11.9 12.1 71.7
4 95 9.1 9.2 93.5
5 67 6.4 6.5 100.0
Total 1029 98.8 100.0
Missing System 12 1.2
Total 1041 100.0
It can be seen from table 3 and figure 5 that most of the respondents (45.07%) have
completed technical or vocational type secondary school. 18.44 percent of the people have
completed their university level education with a degree.
Figure 5: Pie Chart showing the Percentage of people with their Education
Table 3: Highest educational level attained V238
Frequency Percent Valid Percent
Cumulative
Percent
Valid No formal education 31 3.0 3.0 3.0
Incomplete primary school 3 .3 .3 3.3
Complete primary school 24 2.3 2.3 5.7
Incomplete secondary school:
technical/ vocational type
69 6.6 6.7 12.4
Complete secondary school:
technical/ vocational type
462 44.4 45.1 57.5
Incomplete secondary school:
university-preparatory type
22 2.1 2.1 59.6
Complete secondary school:
university-preparatory type
124 11.9 12.1 71.7
⊘ This is a preview!⊘
Do you want full access?
Subscribe today to unlock all pages.
Trusted by 1+ million students worldwide
1 out of 46
Related Documents


Your All-in-One AI-Powered Toolkit for Academic Success.
+13062052269
info@desklib.com
Available 24*7 on WhatsApp / Email
![[object Object]](/_next/static/media/star-bottom.7253800d.svg)
Unlock your academic potential
Copyright © 2020–2026 A2Z Services. All Rights Reserved. Developed and managed by ZUCOL.