Data Analytics Report

Verified

Added on  2019/09/26

|11
|833
|503
Report
AI Summary
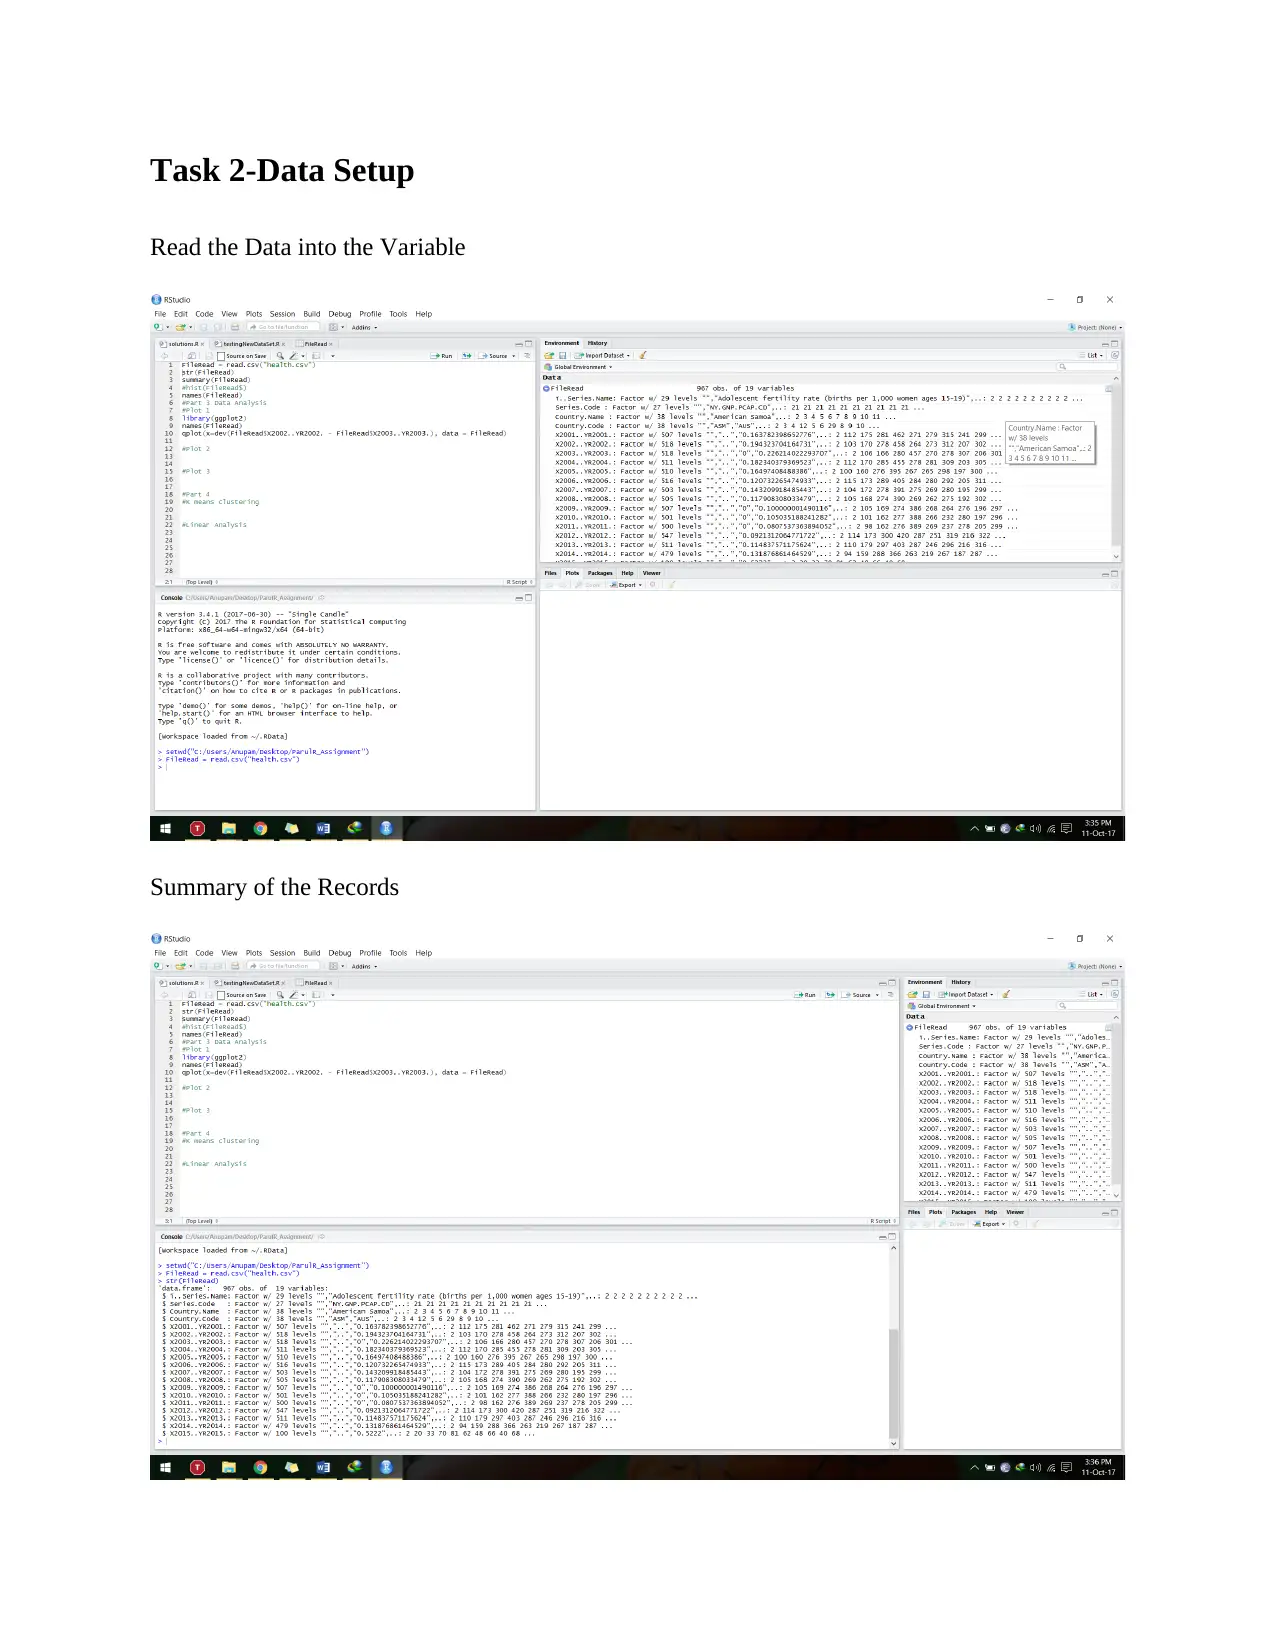
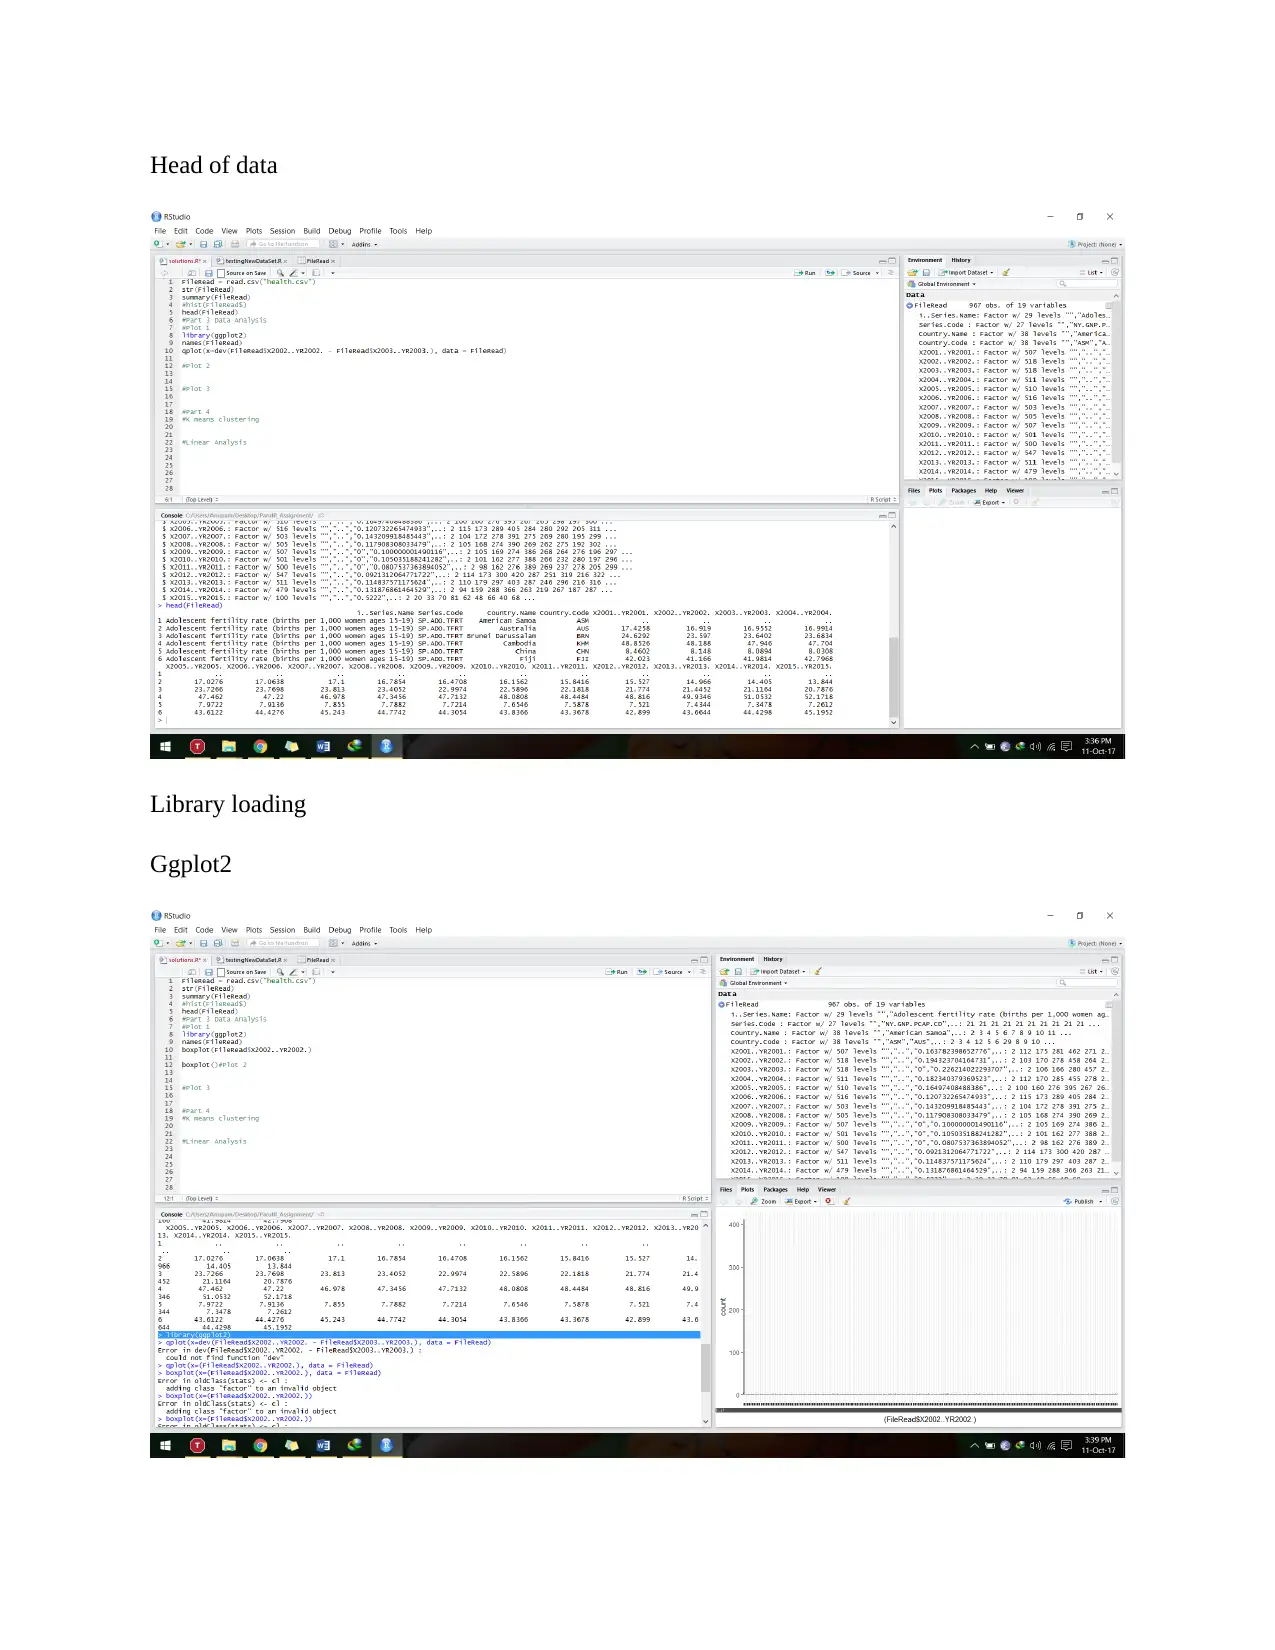
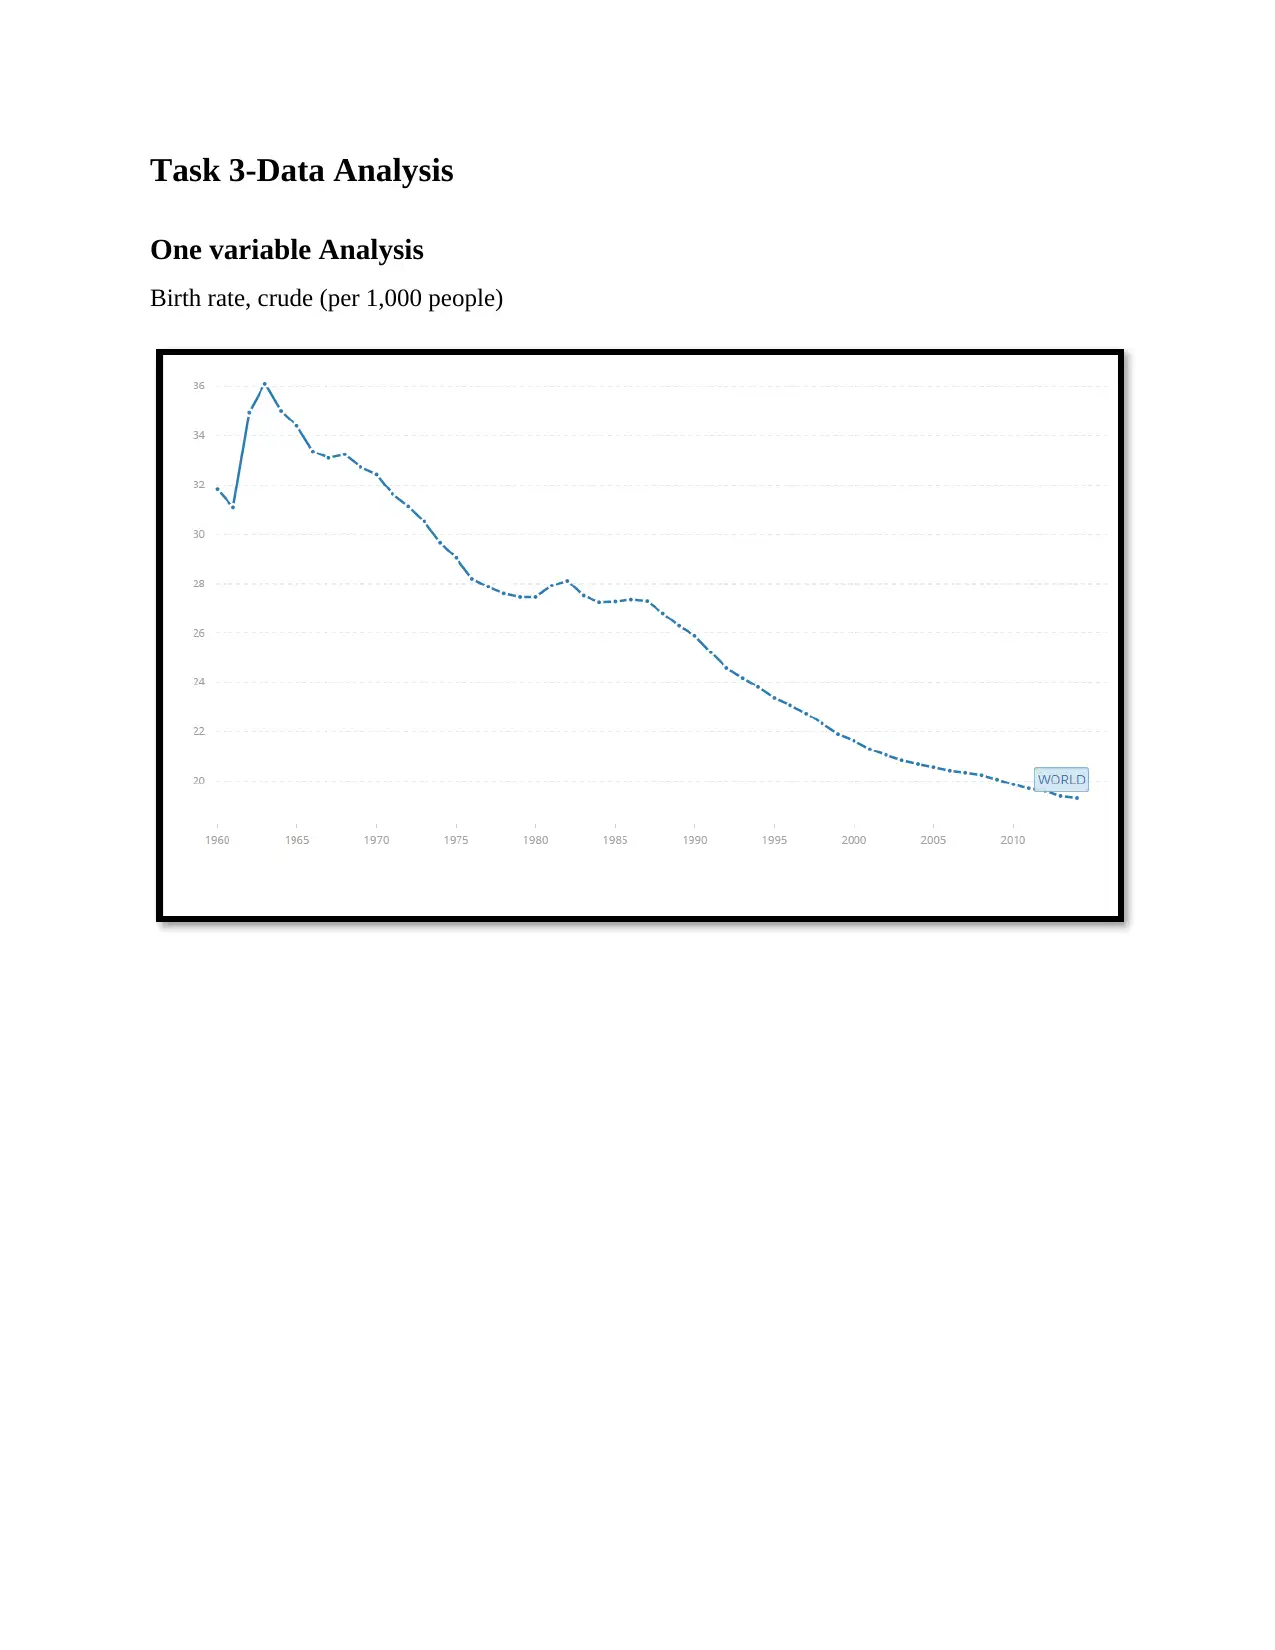
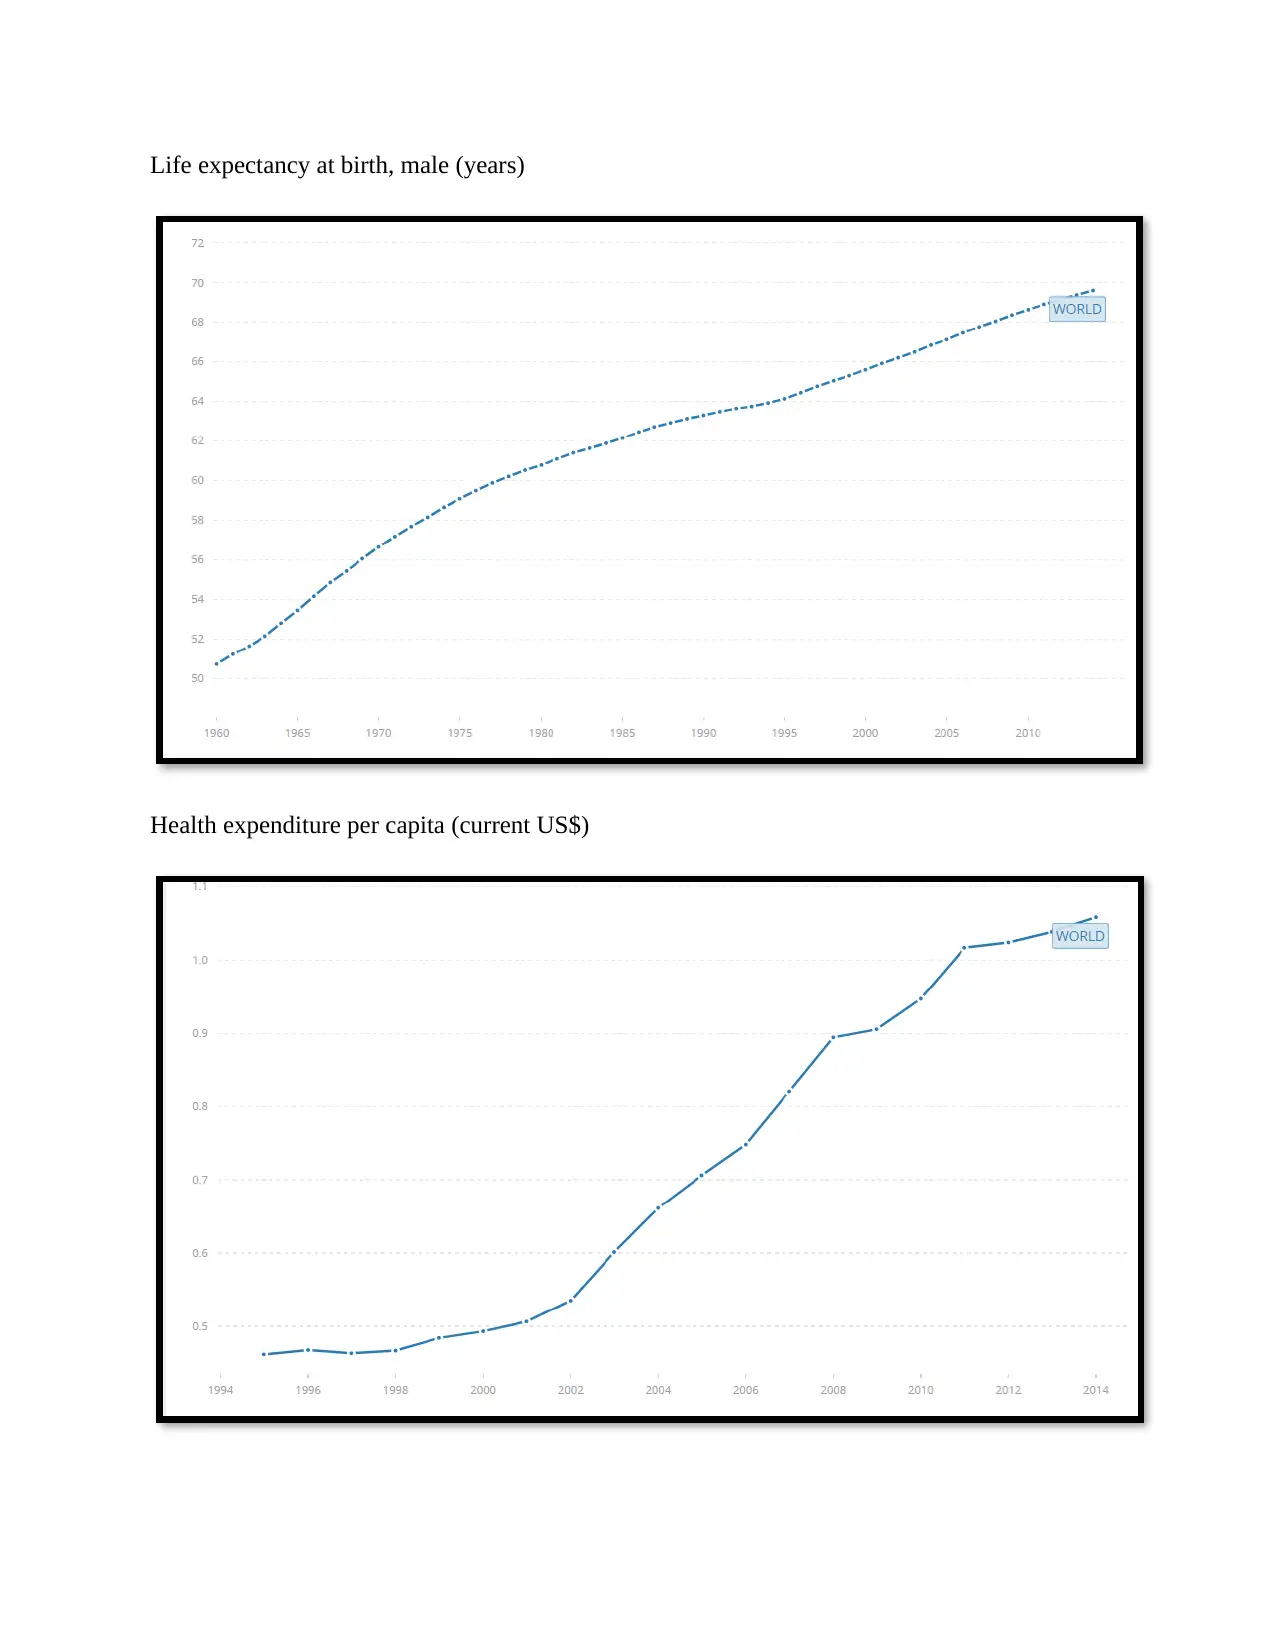
This report details a data analysis project using World Bank data on global health development over the past 15 years. The analysis is performed using R and covers several key areas. It begins with data setup and summary statistics. Then, it moves into one-variable analysis of key health indicators such as birth rate, life expectancy, and health expenditure. The report then delves into more advanced techniques, including k-means clustering to group countries based on similar health profiles and linear regression to model relationships between different health variables. The report concludes with a summary of findings and references to relevant research papers on k-means clustering and linear regression. The document is structured with a table of contents and clearly defined tasks, making it easy to follow the analysis process.
Document Page
[DOCUMENT TITLE]
[Document subtitle]
[DATE]
[COMPANY NAME]
[Company address]
tabler-icon-diamond-filled.svg

Paraphrase This Document

Need a fresh take? Get an instant paraphrase of this document with our AI Paraphraser
Document Page
Table of Contents
Task 1-Introduction.........................................................................................................................2
Task 2-Data Setup............................................................................................................................3
Task 3-Data Analysis.......................................................................................................................5
One variable Analysis..................................................................................................................5
Task 4-Advanced Analysis..............................................................................................................7
K-means clustering......................................................................................................................7
Linear Regression........................................................................................................................7
Task 5-Conclusion...........................................................................................................................8
References........................................................................................................................................9
Document Page
Task 1-Introduction
Big Data Analytics being one of the most interesting aspect of the research these days, everyone
from Silicon Valley to Indian startups are taking keen interest in it. The assignment deals with
one of the key aspect of this domain is Data analytics. The data is from World Data Bank given
at the source (http://databank.worldbank.org) it provides study the heath development of the
world in the past 15 years. In the following assignment we need to work upon the data in order to
find out the different analysis from this data and represent it using the graphs.
Document Page
Task 2-Data Setup
Read the Data into the Variable
Summary of the Records
tabler-icon-diamond-filled.svg

Paraphrase This Document

Need a fresh take? Get an instant paraphrase of this document with our AI Paraphraser
Document Page
Head of data
Library loading
Ggplot2
Document Page
Task 3-Data Analysis
One variable Analysis
Birth rate, crude (per 1,000 people)
Document Page
Life expectancy at birth, male (years)
Health expenditure per capita (current US$)
tabler-icon-diamond-filled.svg

Paraphrase This Document

Need a fresh take? Get an instant paraphrase of this document with our AI Paraphraser
Document Page
Task 4-Advanced Analysis
K-means clustering
K-means clustering is the process in which we use vector quantization, this is originally came
from signal processing and being most popular way of clustering analysis in data mining. K-
means purpose is to partition where each and every observation is being clustered around nearest
mean which can serve as the prototype cluster. This is known as the Voronoi cells in which data
is being partitioned.
K-means problem is computationally quite difficult (NP-Hard), but there are many efficient
heuristic algorithms that can be easily applied to this in order to minimize time consumed and
reach the local optimum solution. There is various similar expectation maximization based
algorithms like Gaussian distribution with iterative based refined approach being used by both
the algorithms. They both use cluster based centers in order to model the data but the k-means
clustering is more inclined in order to provide the comparable spatial extent.
Linear Regression
The Linear Regression is a linear approach in order to modeling the relation among the scalar
dependent variables and another explanatory variable or also known as independent variables. In
the case of explanatory variables, it is known as simple linear regression. With multiple variables
in consideration it is multiple linear regression.
The linear regression the relationships are being modeled with linear predictor in which the
unknown variable is being estimated using the other variables of data. These are being defined as
linear models.
Document Page
Task 5-Conclusion
The conclusion of this report is to analysis of the Data World Bank. The data provided have lots
of data that cannot be estimated or being used for any purpose of calculations. Firstly, we choose
the single variable analysis, secondly, we see how the k-means and linear regression approach
works on data. Furthermore, analysis was presented using the data analytics using the R.
Document Page
References
Feng, Q., & Zhou, Y. (2016). Iterative linear regression classification for image
recognition. 2016 IEEE International Conference On Acoustics, Speech And
Signal Processing (ICASSP). http://dx.doi.org/10.1109/icassp.2016.7471940
Jinyu, T., & Xin, Z. (2009). Apply multiple linear regression model to predict the
audit opinion. 2009 ISECS International Colloquium On Computing,
Communication, Control, And Management.
http://dx.doi.org/10.1109/cccm.2009.5267661
Kanungo, T., Mount, D., Netanyahu, N., Piatko, C., Silverman, R., & Wu, A. (2002).
An efficient k-means clustering algorithm: analysis and implementation. IEEE
Transactions On Pattern Analysis And Machine Intelligence, 24(7), 881-892.
http://dx.doi.org/10.1109/tpami.2002.1017616
Liu Guoli, Wang Tingting, Yu Limei, Li Yanping, & Gao Jinqiao. (2013). The
improved research on k-means clustering algorithm in initial values. Proceedings
2013 International Conference On Mechatronic Sciences, Electric Engineering
And Computer (MEC). http://dx.doi.org/10.1109/mec.2013.6885401
Naseem, I., Togneri, R., & Bennamoun, M. (2010). Linear Regression for Face
Recognition. IEEE Transactions On Pattern Analysis And Machine
Intelligence, 32(11), 2106-2112. http://dx.doi.org/10.1109/tpami.2010.128
Qi, J., Yu, Y., Wang, L., & Liu, J. (2016). K*-Means: An Effective and Efficient K-
Means Clustering Algorithm. 2016 IEEE International Conferences On Big Data
And Cloud Computing (Bdcloud), Social Computing And Networking
(Socialcom), Sustainable Computing And Communications (Sustaincom)
(Bdcloud-Socialcom-Sustaincom). http://dx.doi.org/10.1109/bdcloud-socialcom-
sustaincom.2016.46
tabler-icon-diamond-filled.svg

Paraphrase This Document

Need a fresh take? Get an instant paraphrase of this document with our AI Paraphraser
Document Page
chevron_up_icon
1 out of 11
circle_padding
hide_on_mobile
zoom_out_icon
[object Object]