Data Analytics and Sales Forecasting Report: E-commerce Data Analysis

Verified

Added on  2021/06/16

|15
|2041
|169
Report
AI Summary
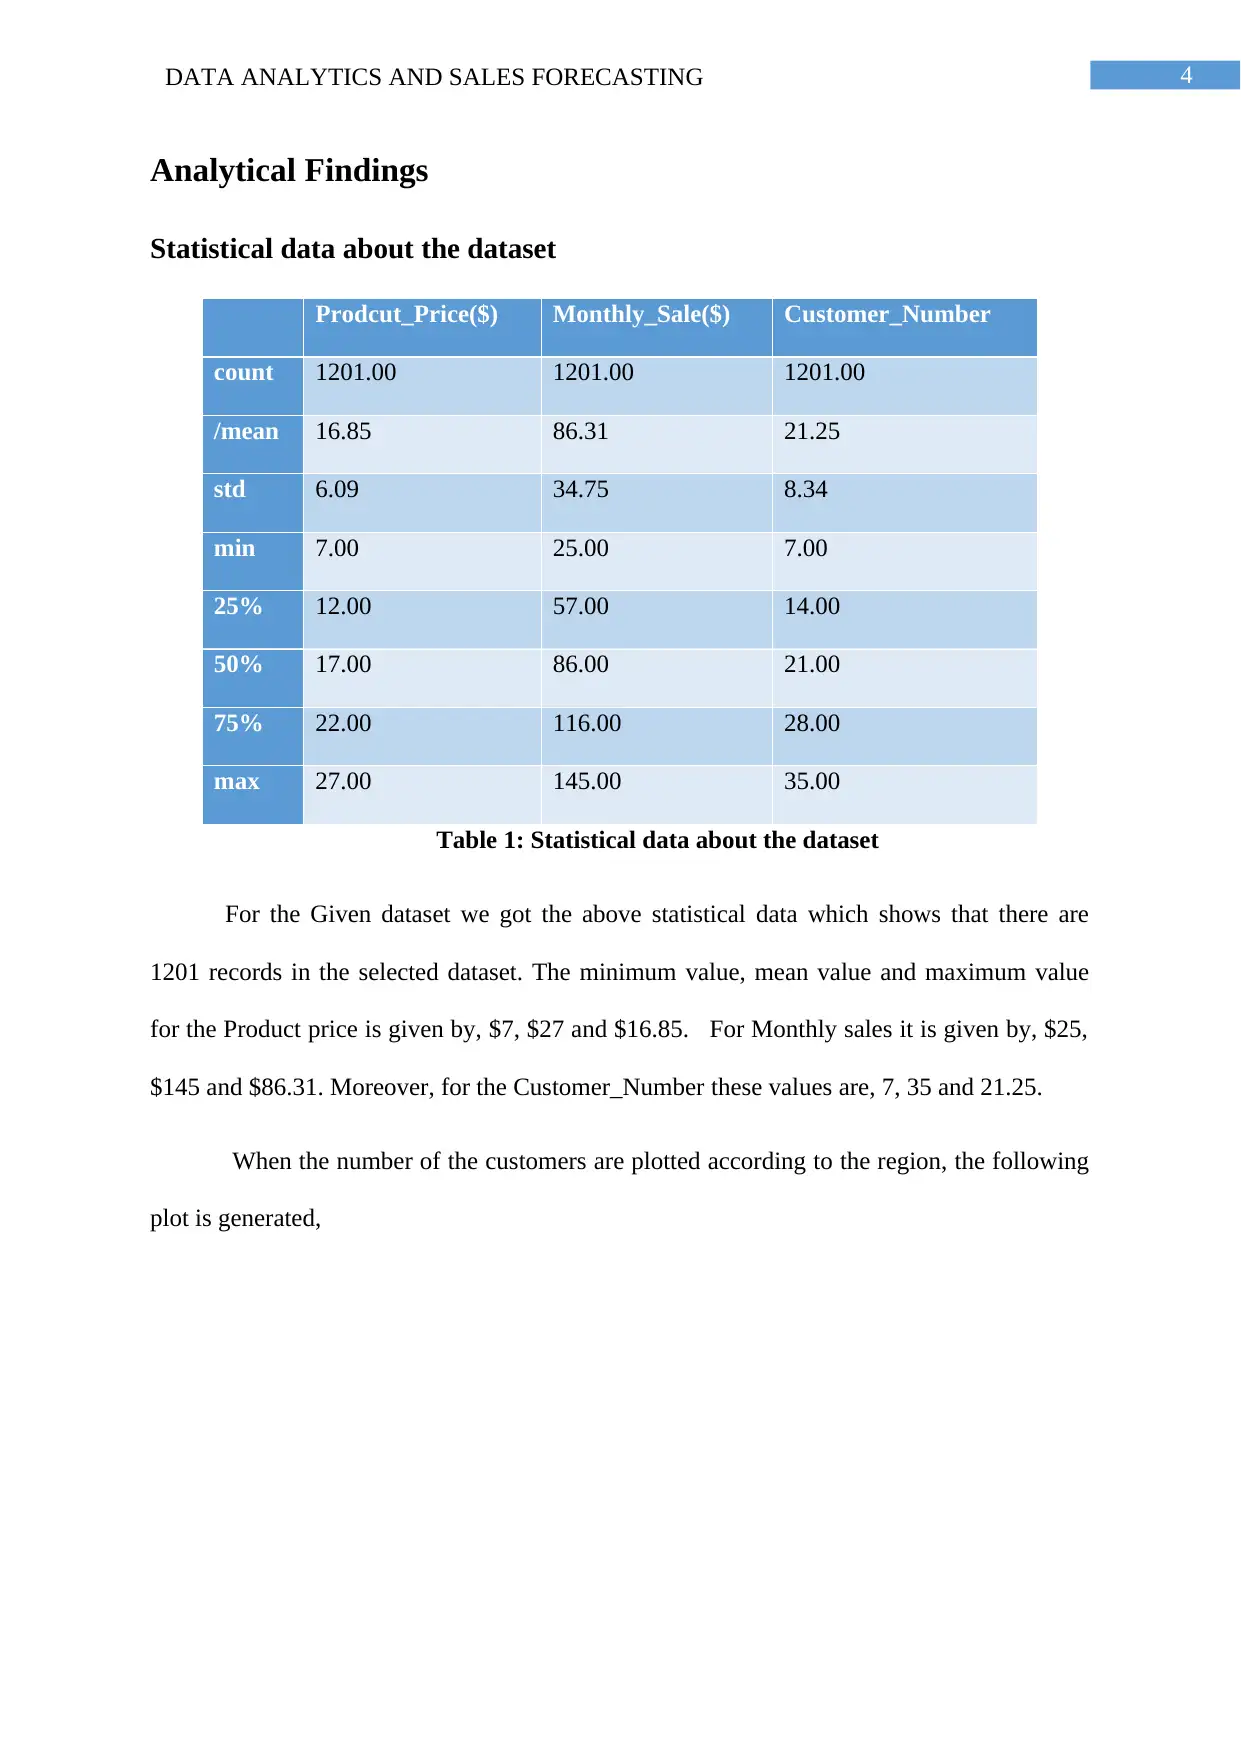
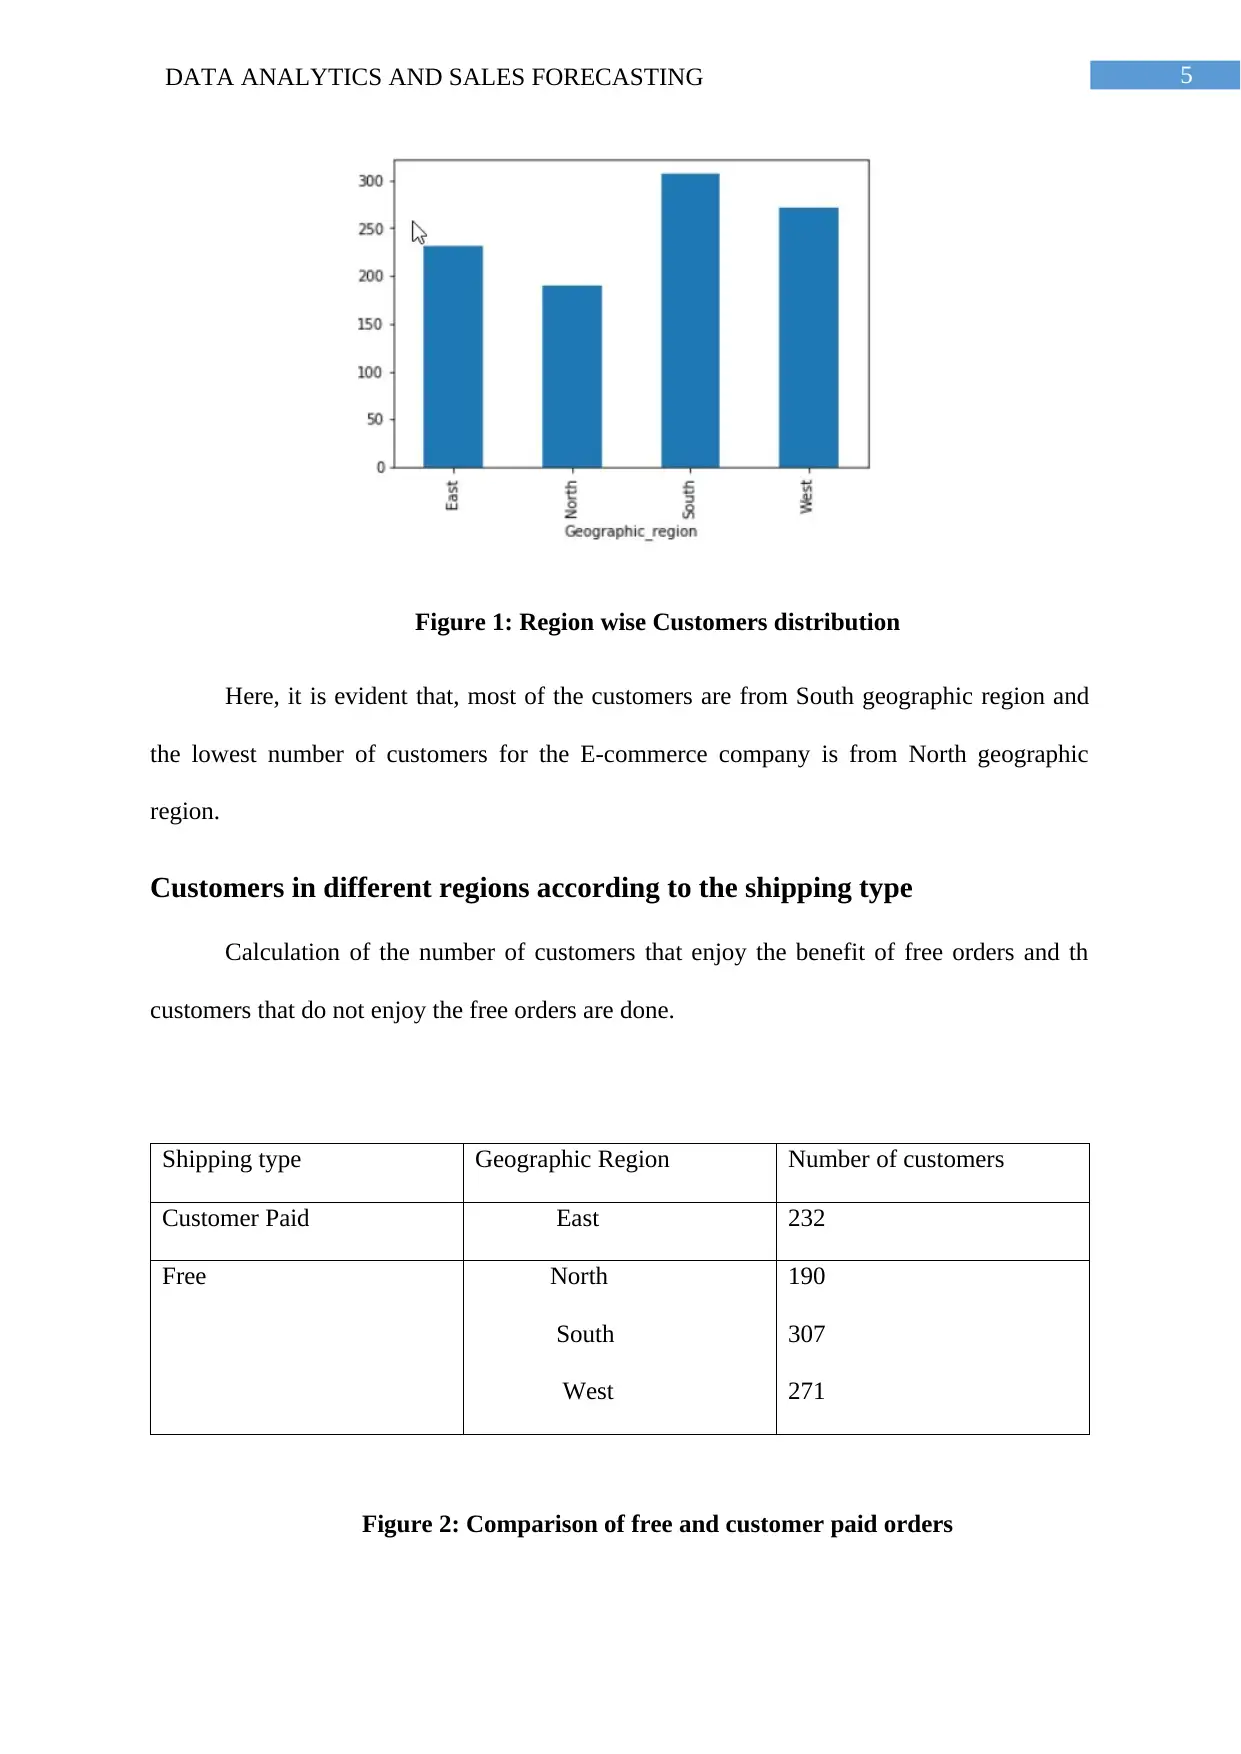
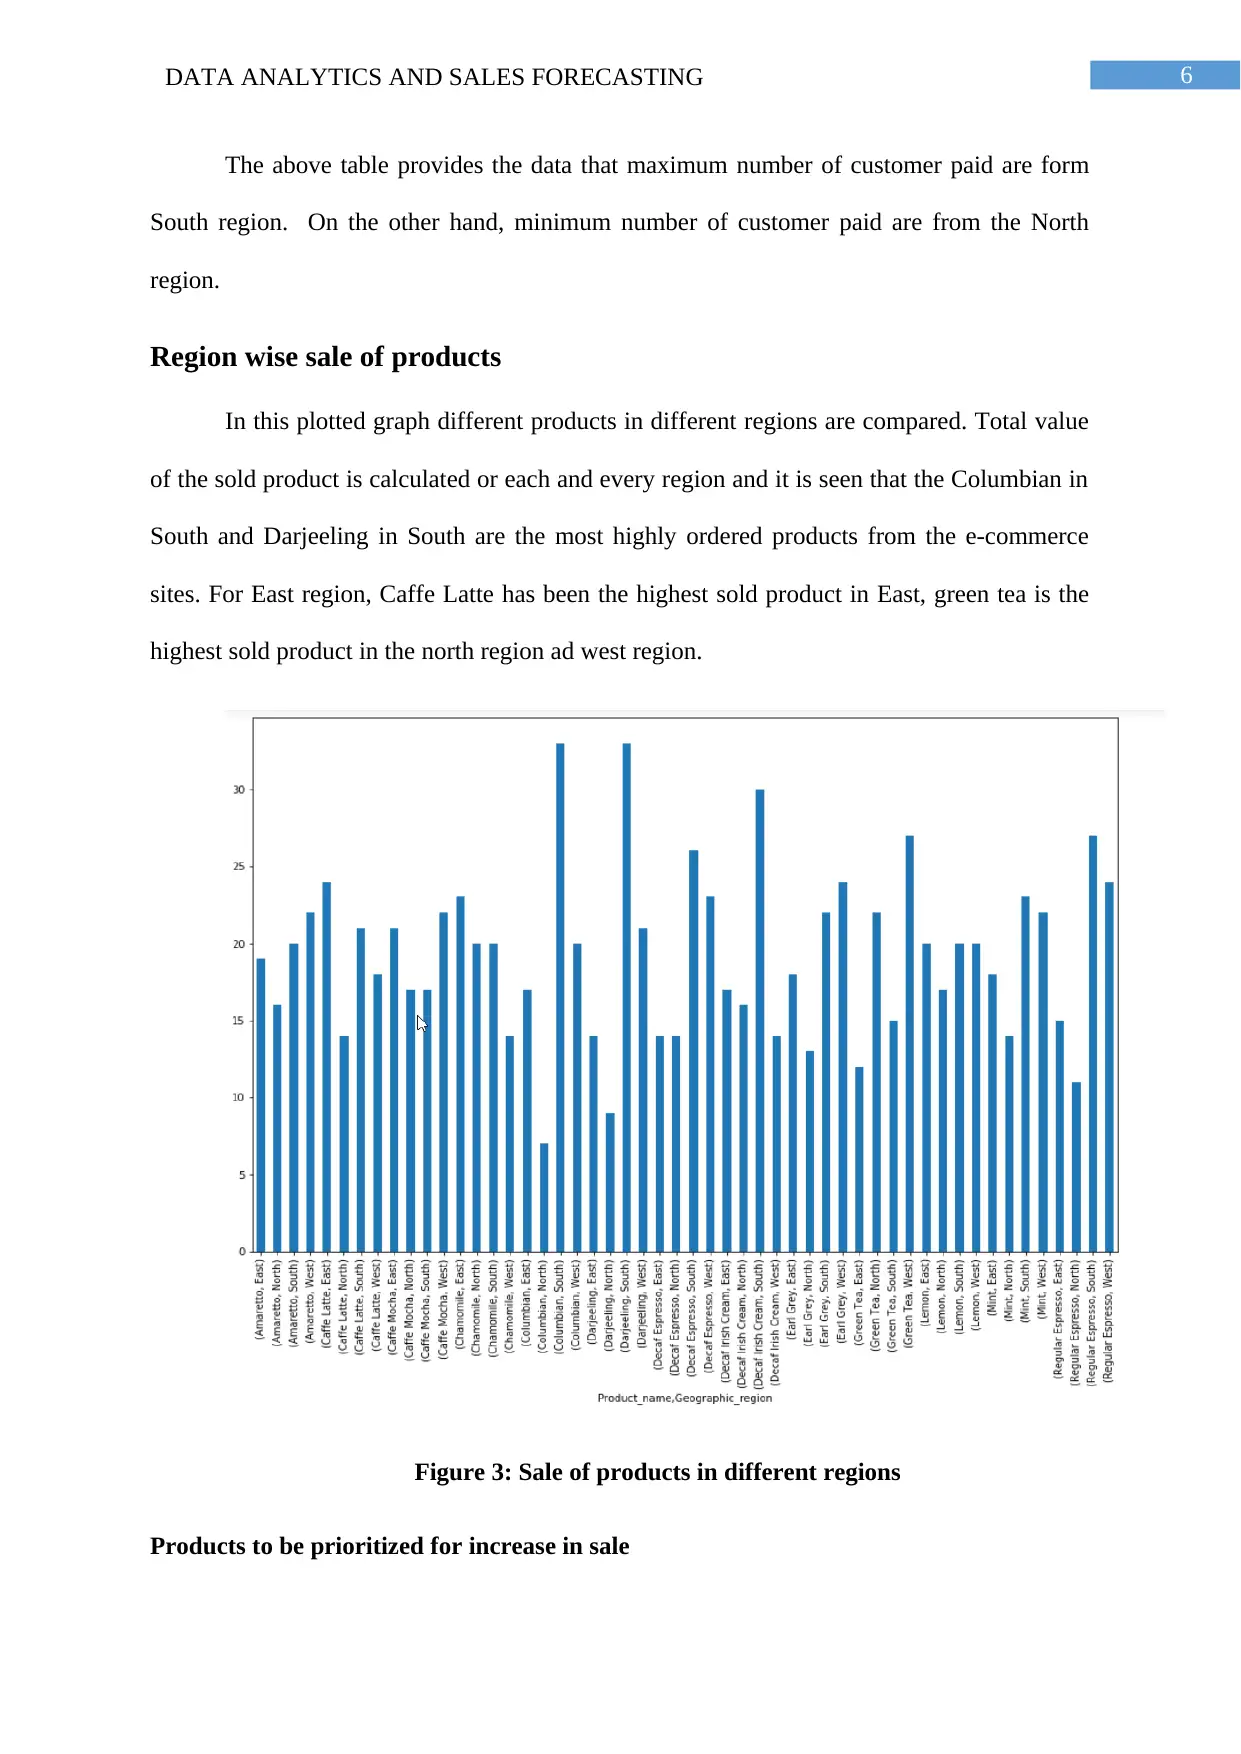
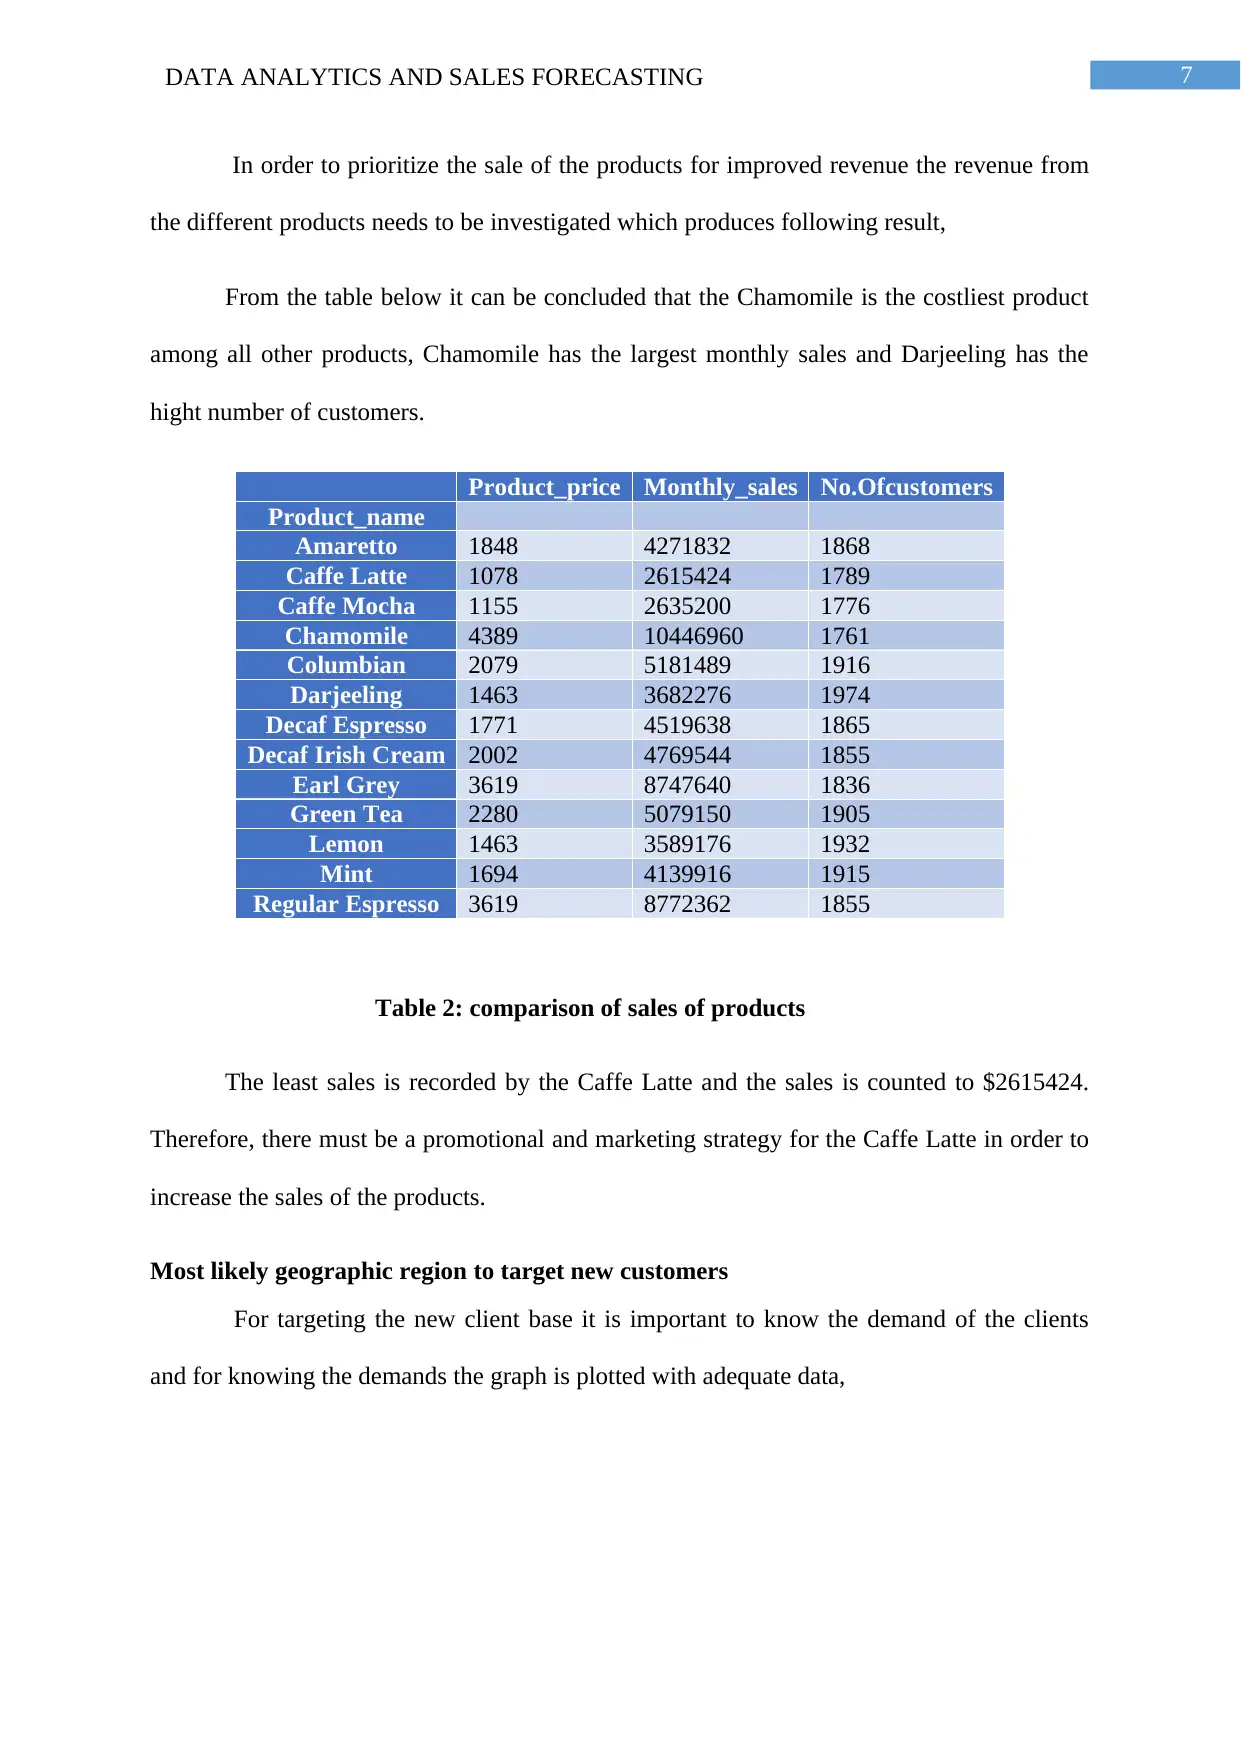
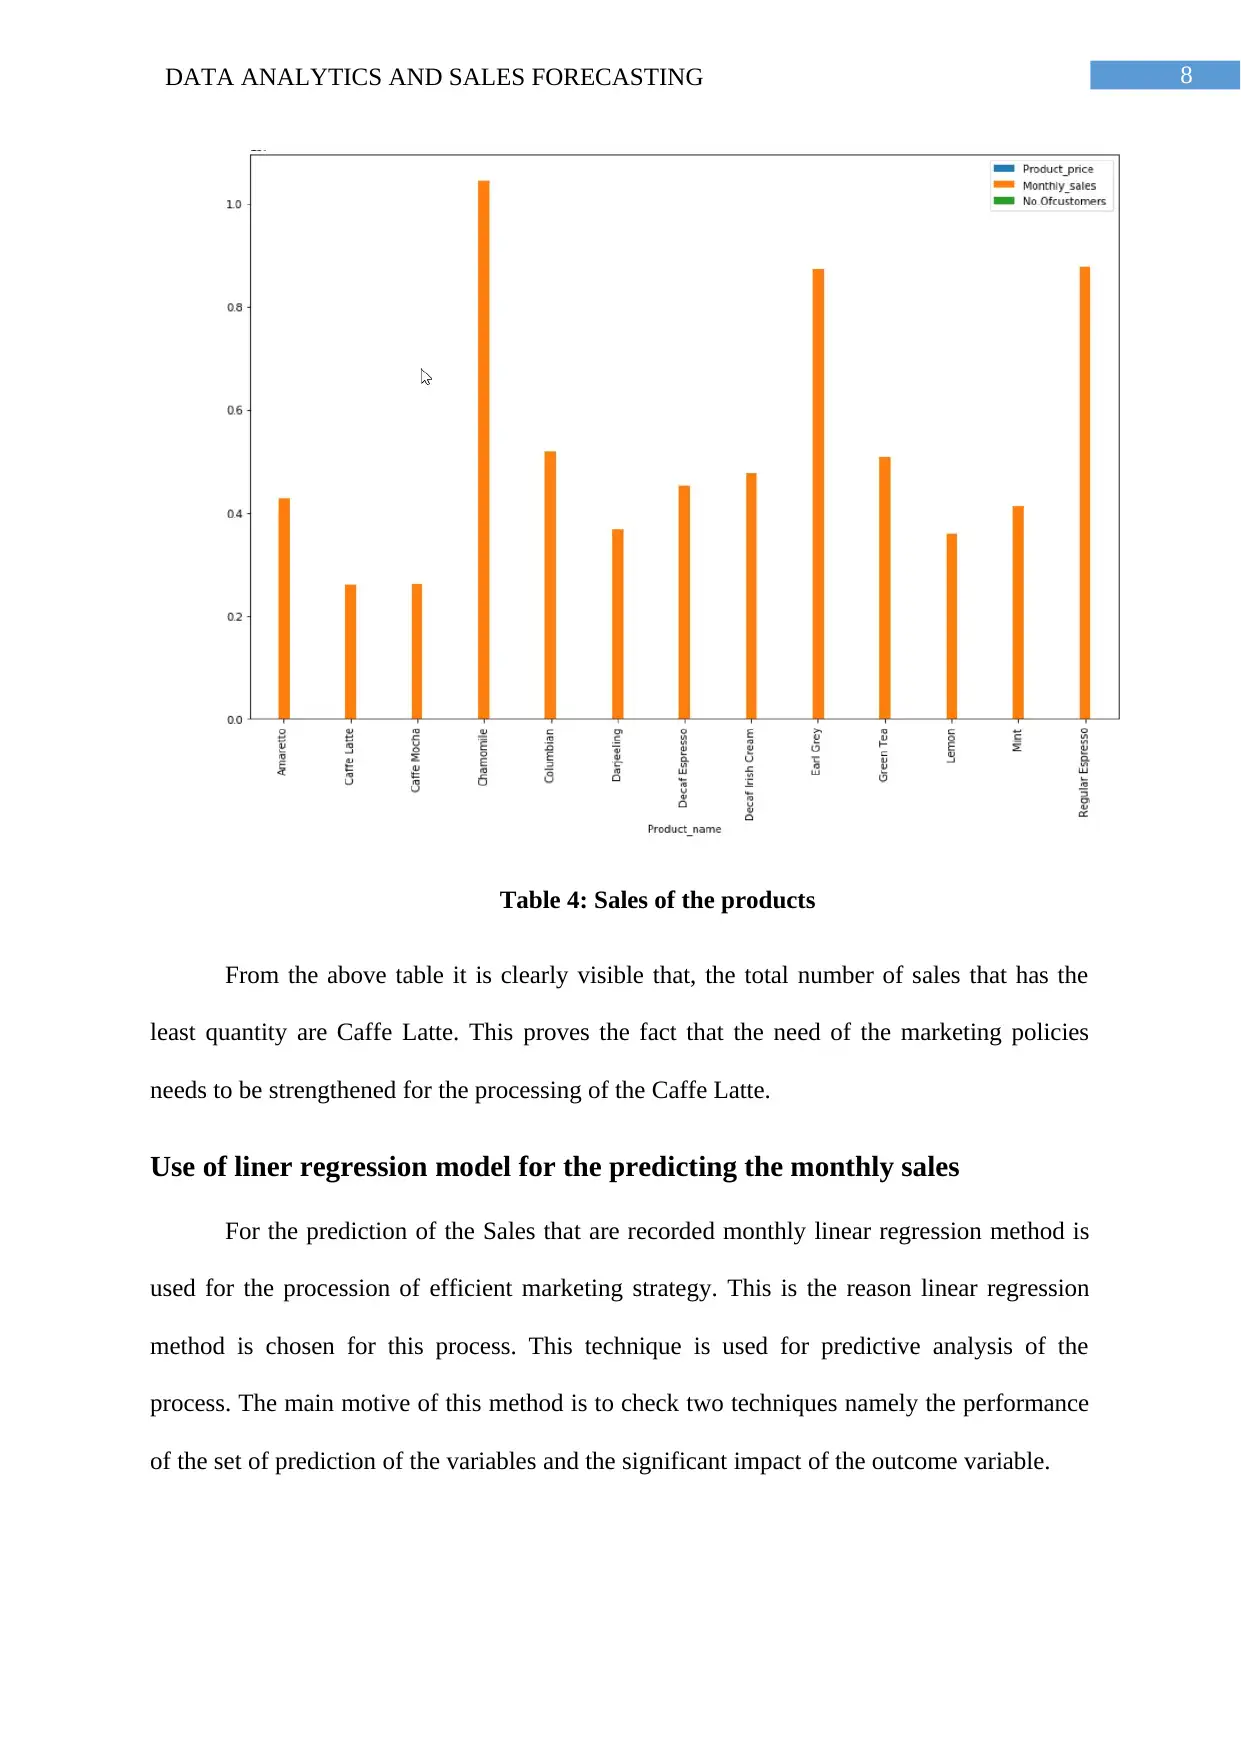
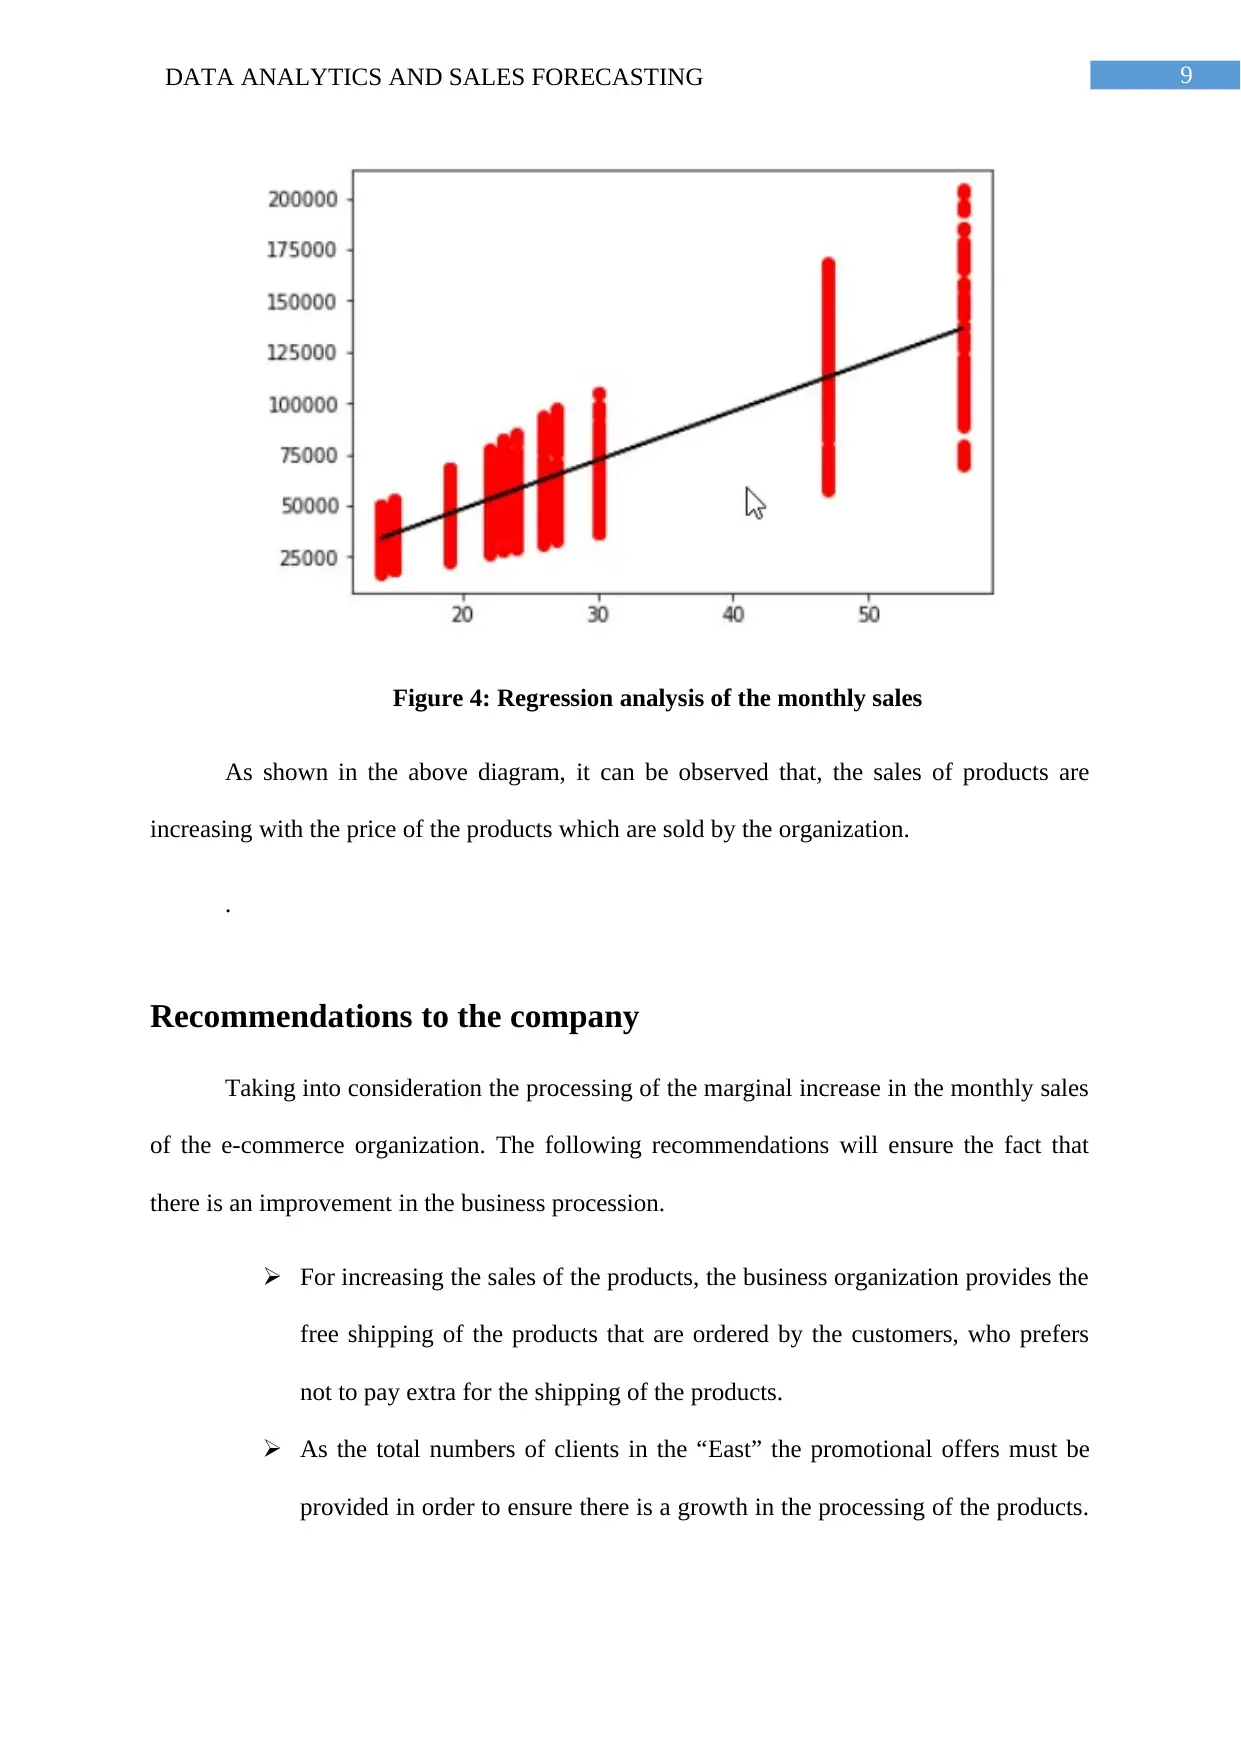
This report presents an in-depth analysis of an e-commerce dataset, focusing on data analytics and sales forecasting techniques. The student's work includes an executive summary, research methodology, and detailed analytical findings. Statistical data is presented to describe the dataset's key features such as product prices, monthly sales, and customer numbers. The report examines customer distribution across different geographic regions and analyzes the impact of shipping types on sales. Furthermore, it investigates region-wise product sales and prioritizes products for increased revenue. The study utilizes a linear regression model to predict monthly sales, providing actionable recommendations to the company, alongside an implementation plan. The report concludes by emphasizing the value of data analytics in transforming unstructured data into valuable insights, thereby enhancing business performance. The student's report includes a bibliography and an appendix with the code used for the analysis. This assignment is contributed to Desklib, a platform that provides AI-based study tools for students.
Document Page
Running head: DATA ANALYTICS AND SALES FORECASTING
Data Analytics and Sales forecasting
Name of the Student
Name of the University
Authors note
tabler-icon-diamond-filled.svg

Paraphrase This Document

Need a fresh take? Get an instant paraphrase of this document with our AI Paraphraser
Document Page
1DATA ANALYTICS AND SALES FORECASTING
Executive Summary
This report will consist of the analysis of the data that will provide the base of different e-
commerce data set with respect to the sales of different products in varied region and the
entire process is measured using different criteria and other variables. The procedure of
research methodology and the processing of the data analytic sis also provided this paper.
Document Page
2DATA ANALYTICS AND SALES FORECASTING
Table of Contents
Introduction................................................................................................................................3
Research Methodology...............................................................................................................3
Analytical Findings....................................................................................................................4
Statistical data about the dataset................................................................................4
Customers in different regions according to the shipping type..................................5
Region wise sale of products......................................................................................6
Impact of shipping type of the ordered products.......................................................8
Use of liner regression model for the predicting the monthly sales.........................10
Recommendations to the company..........................................................................................11
Implementation plan based on the recommendations..............................................................12
Conclusion................................................................................................................................12
Bibliography.............................................................................................................................13
Appendix..................................................................................................................................14
Document Page
3DATA ANALYTICS AND SALES FORECASTING
Introduction
Due to the fact that the online e-commerce market has taken over the traditional
markets with the increased demand of the products. This competition is increasing immensely
hence the business organizations can exploit these opportunities to gain advantage in the
market. Market demands are becoming more important for the processing of the data that are
viable in order to process the marketing demand. The business data that are in used are stored
in unstructured manner.
This paper incurs with the fact that data that will deal with the data that will act as the
reference dataset of the e-commerce business regarding the productivity of the regions. This
report will include the fact that will provide the explanatory analysis of the data set that is to
be recognized in different patterns.
Research Methodology
During the processing of the data the major requirement is to predict monthly sales
for the progress in the procession of the data structuring of the E-commerce organization. In
addition to the fact that the data mining method usage will also be discussed. Linear egression
method will also be used in order to predict the monthly sales of the product in different
regions. This methodology ensures the fact that the proper comparison between the data
parameters are provided with respect to the relationship or the pattern of the data that are not
previously explored.
As an example, the analysis of the monthly sales regarding the sales data, customer
count with respect to the geographic region for creating the patterns of the data analytics of
the processing the project.
tabler-icon-diamond-filled.svg

Paraphrase This Document

Need a fresh take? Get an instant paraphrase of this document with our AI Paraphraser
Document Page
4DATA ANALYTICS AND SALES FORECASTING
Analytical Findings
Statistical data about the dataset
Prodcut_Price($) Monthly_Sale($) Customer_Number
count 1201.00 1201.00 1201.00
/mean 16.85 86.31 21.25
std 6.09 34.75 8.34
min 7.00 25.00 7.00
25% 12.00 57.00 14.00
50% 17.00 86.00 21.00
75% 22.00 116.00 28.00
max 27.00 145.00 35.00
Table 1: Statistical data about the dataset
For the Given dataset we got the above statistical data which shows that there are
1201 records in the selected dataset. The minimum value, mean value and maximum value
for the Product price is given by, $7, $27 and $16.85. For Monthly sales it is given by, $25,
$145 and $86.31. Moreover, for the Customer_Number these values are, 7, 35 and 21.25.
When the number of the customers are plotted according to the region, the following
plot is generated,
Document Page
5DATA ANALYTICS AND SALES FORECASTING
Figure 1: Region wise Customers distribution
Here, it is evident that, most of the customers are from South geographic region and
the lowest number of customers for the E-commerce company is from North geographic
region.
Customers in different regions according to the shipping type
Calculation of the number of customers that enjoy the benefit of free orders and th
customers that do not enjoy the free orders are done.
Shipping type Geographic Region Number of customers
Customer Paid East 232
Free North
South
West
190
307
271
Figure 2: Comparison of free and customer paid orders
Document Page
6DATA ANALYTICS AND SALES FORECASTING
The above table provides the data that maximum number of customer paid are form
South region. On the other hand, minimum number of customer paid are from the North
region.
Region wise sale of products
In this plotted graph different products in different regions are compared. Total value
of the sold product is calculated or each and every region and it is seen that the Columbian in
South and Darjeeling in South are the most highly ordered products from the e-commerce
sites. For East region, Caffe Latte has been the highest sold product in East, green tea is the
highest sold product in the north region ad west region.
Figure 3: Sale of products in different regions
Products to be prioritized for increase in sale
tabler-icon-diamond-filled.svg

Paraphrase This Document

Need a fresh take? Get an instant paraphrase of this document with our AI Paraphraser
Document Page
7DATA ANALYTICS AND SALES FORECASTING
In order to prioritize the sale of the products for improved revenue the revenue from
the different products needs to be investigated which produces following result,
From the table below it can be concluded that the Chamomile is the costliest product
among all other products, Chamomile has the largest monthly sales and Darjeeling has the
hight number of customers.
Product_price Monthly_sales No.Ofcustomers
Product_name
Amaretto 1848 4271832 1868
Caffe Latte 1078 2615424 1789
Caffe Mocha 1155 2635200 1776
Chamomile 4389 10446960 1761
Columbian 2079 5181489 1916
Darjeeling 1463 3682276 1974
Decaf Espresso 1771 4519638 1865
Decaf Irish Cream 2002 4769544 1855
Earl Grey 3619 8747640 1836
Green Tea 2280 5079150 1905
Lemon 1463 3589176 1932
Mint 1694 4139916 1915
Regular Espresso 3619 8772362 1855
Table 2: comparison of sales of products
The least sales is recorded by the Caffe Latte and the sales is counted to $2615424.
Therefore, there must be a promotional and marketing strategy for the Caffe Latte in order to
increase the sales of the products.
Most likely geographic region to target new customers
For targeting the new client base it is important to know the demand of the clients
and for knowing the demands the graph is plotted with adequate data,
Document Page
8DATA ANALYTICS AND SALES FORECASTING
Table 4: Sales of the products
From the above table it is clearly visible that, the total number of sales that has the
least quantity are Caffe Latte. This proves the fact that the need of the marketing policies
needs to be strengthened for the processing of the Caffe Latte.
Use of liner regression model for the predicting the monthly sales
For the prediction of the Sales that are recorded monthly linear regression method is
used for the procession of efficient marketing strategy. This is the reason linear regression
method is chosen for this process. This technique is used for predictive analysis of the
process. The main motive of this method is to check two techniques namely the performance
of the set of prediction of the variables and the significant impact of the outcome variable.
Document Page
9DATA ANALYTICS AND SALES FORECASTING
Figure 4: Regression analysis of the monthly sales
As shown in the above diagram, it can be observed that, the sales of products are
increasing with the price of the products which are sold by the organization.
.
Recommendations to the company
Taking into consideration the processing of the marginal increase in the monthly sales
of the e-commerce organization. The following recommendations will ensure the fact that
there is an improvement in the business procession.
For increasing the sales of the products, the business organization provides the
free shipping of the products that are ordered by the customers, who prefers
not to pay extra for the shipping of the products.
As the total numbers of clients in the “East” the promotional offers must be
provided in order to ensure there is a growth in the processing of the products.
tabler-icon-diamond-filled.svg

Paraphrase This Document

Need a fresh take? Get an instant paraphrase of this document with our AI Paraphraser
Document Page
10DATA ANALYTICS AND SALES FORECASTING
Marketing campaigns can be used as a tool that will be used for increasing the
client base.
The data that is used for the analysis of the product demand proves the fact
that the “Choco latte” has lesser revenue and the demand is comparatively less
for the product. Hence proper marketing strategy must be implemented in
order to ensure the fact that there is proper marketing of the product which
will lead to the increase in sales of the product.
Implementation plan based on the recommendations
The implementation of the strategies for the products that are lacking in pace in case
of the public demand despite the fact that the organizations have been performing several
marketing strategies are the productions must be stopped. The organization lo must take in
feedback from the existing clients in order to influence the views regarding the products. The
feedback that will be negative will ensure the fact that the organization will be able to
understand the problems that are processed with the processing of te products and the laws
will be detected and can be solved.
Personalized recommendations of the clients that has already bought the products acts
as the positive side to the processing of the product. This ensures the fact that the potential
clients will get influenced by the reviews hat are provided by the existing users of the
product.
Conclusion
The data analytics that are helpful in nature is completely dependent in the fact that it
helps in the processing of the data is helpful in creating knowledge for the compression of
unstructured data to a structured version of the data. Predicting the monthly sales with the
Document Page
11DATA ANALYTICS AND SALES FORECASTING
help of linear regression will include the act that the information is recognizable for the
business organization. The prediction of the monthly sales includes the usage of the linear
regression methodology. This process is provident to the fact that it improves the business
performance of the organization. By taking into consideration the recommendations stated
above the organizations will be benefitted.
chevron_up_icon
1 out of 15
circle_padding
hide_on_mobile
zoom_out_icon
[object Object]