Business Analytics Assessment Task 1: Data Analytics in Supply Chain
VerifiedAdded on 2020/10/23
|8
|1212
|34
Report
AI Summary
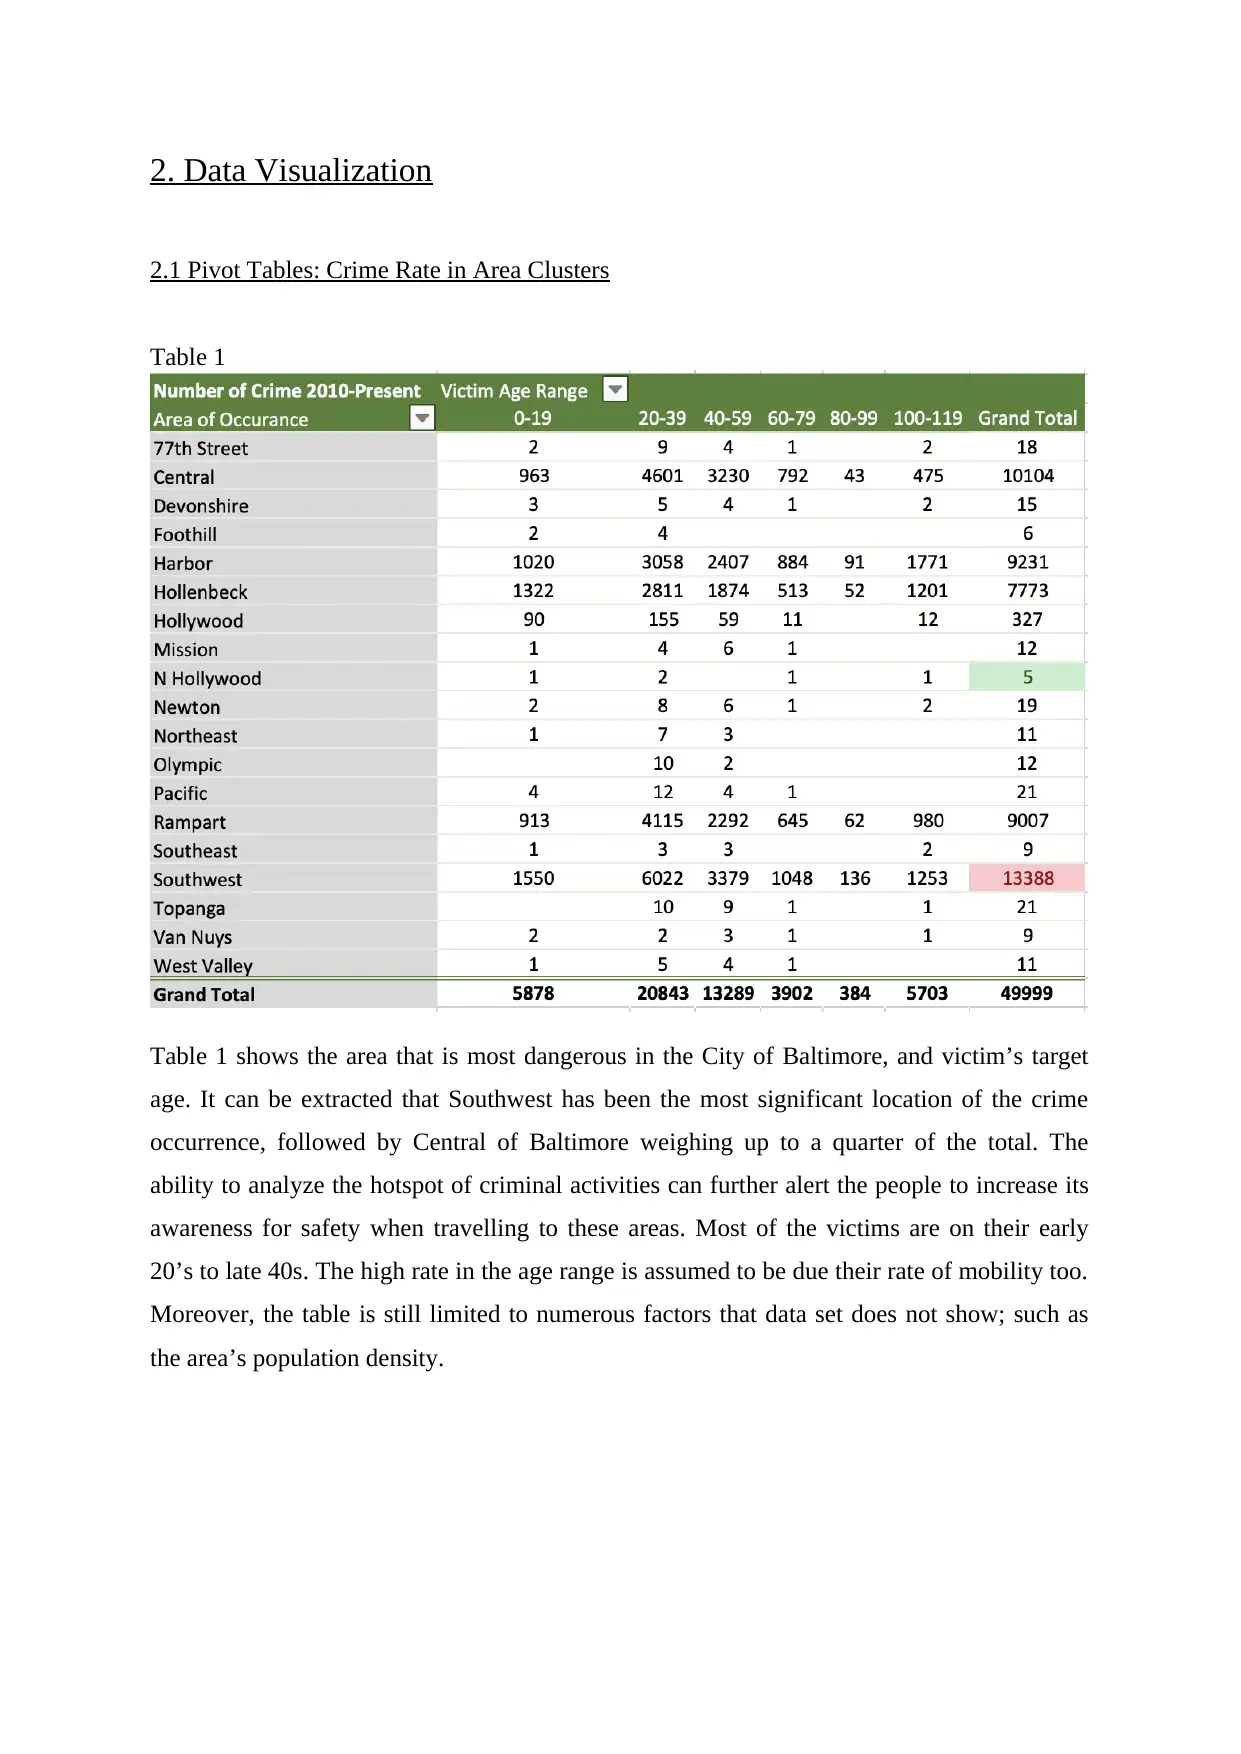
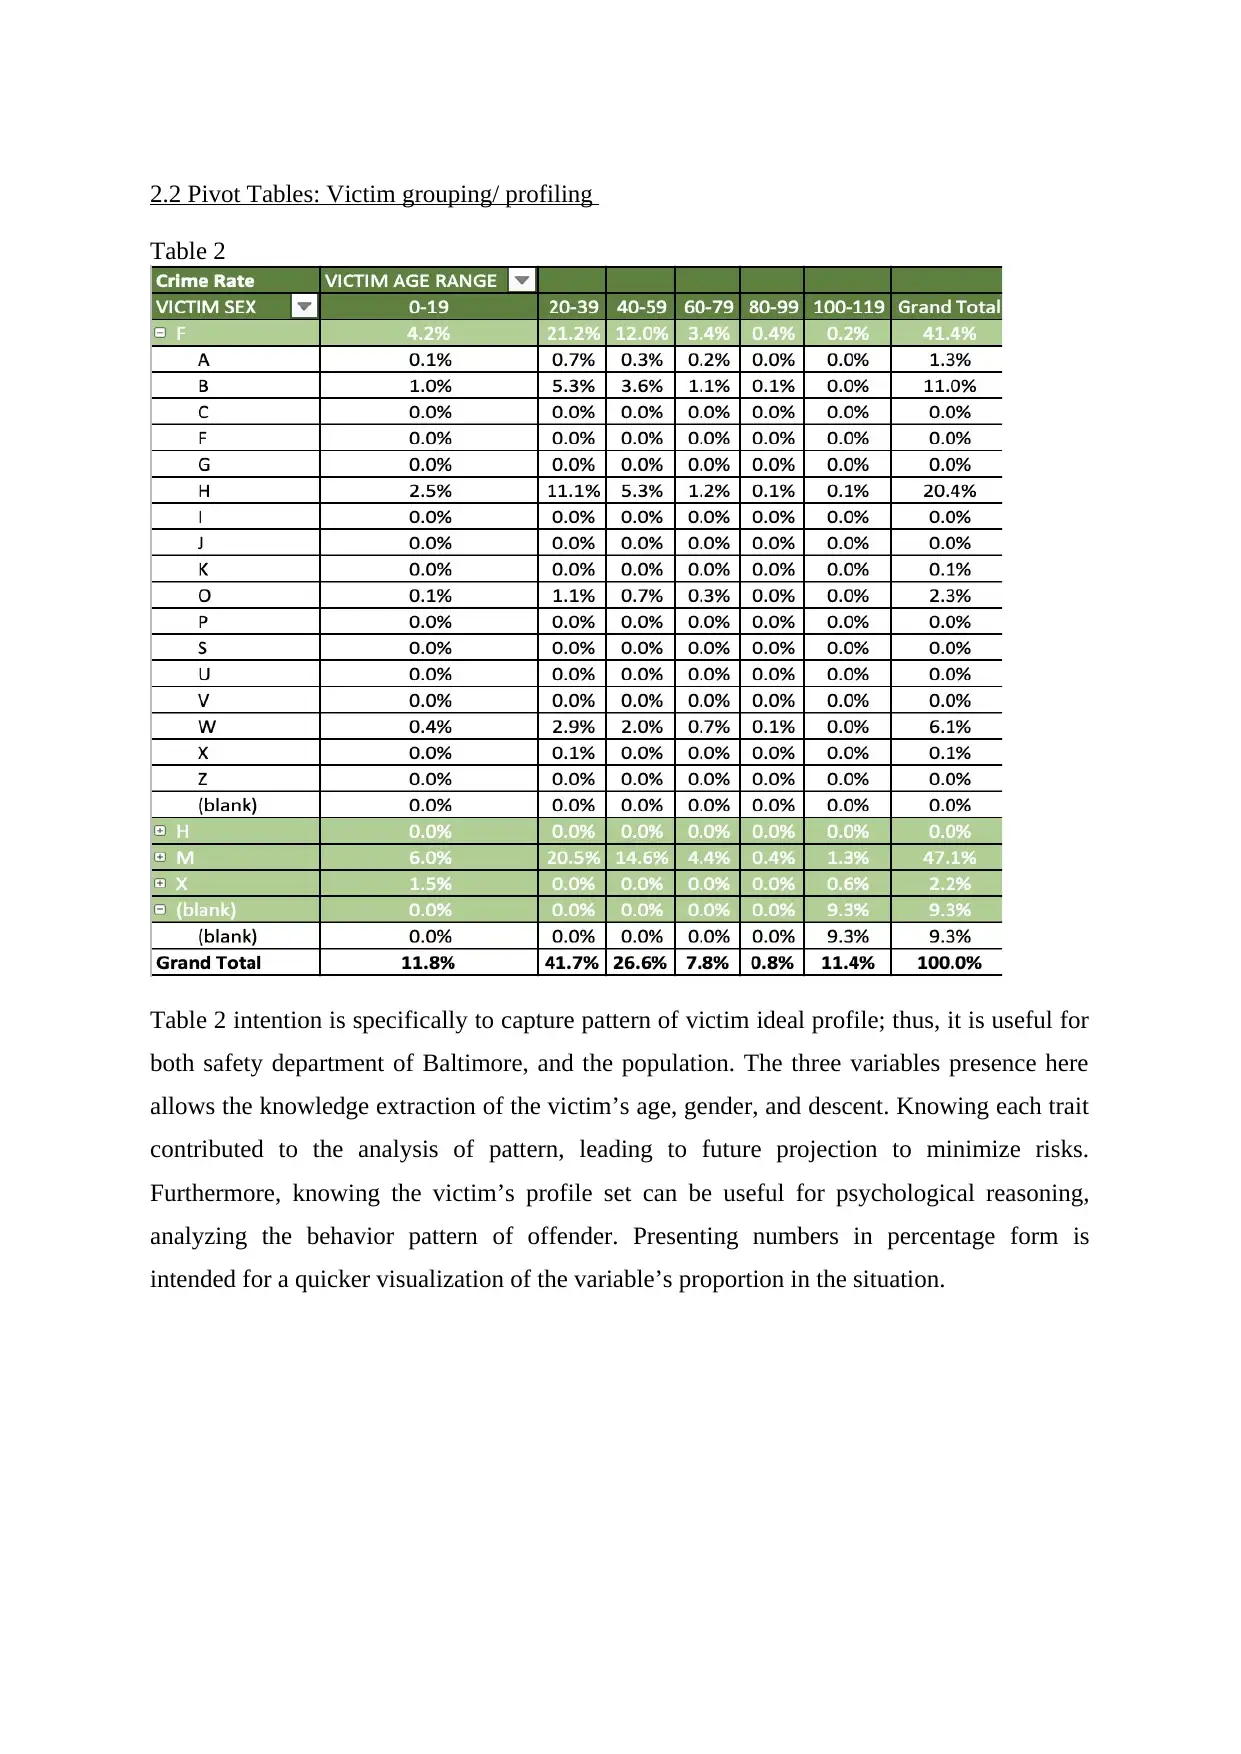
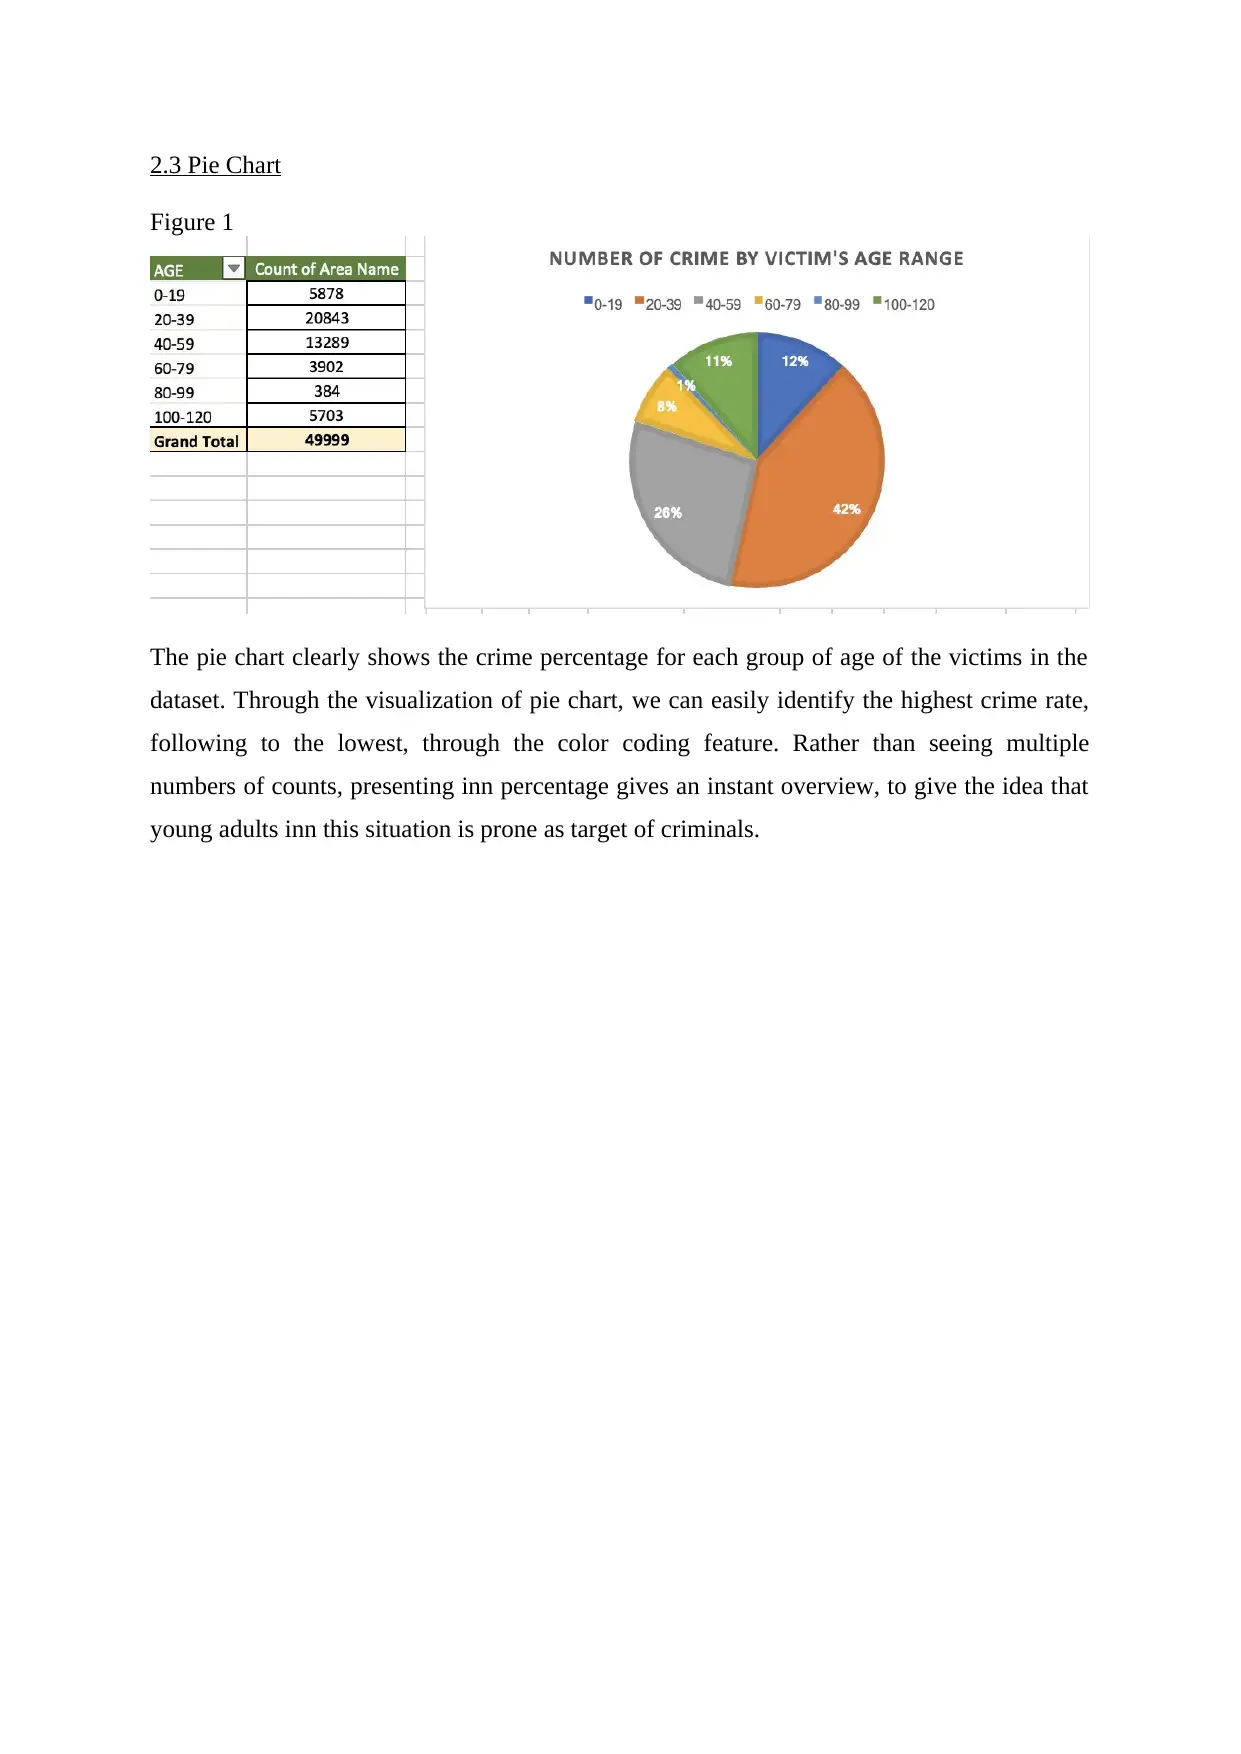
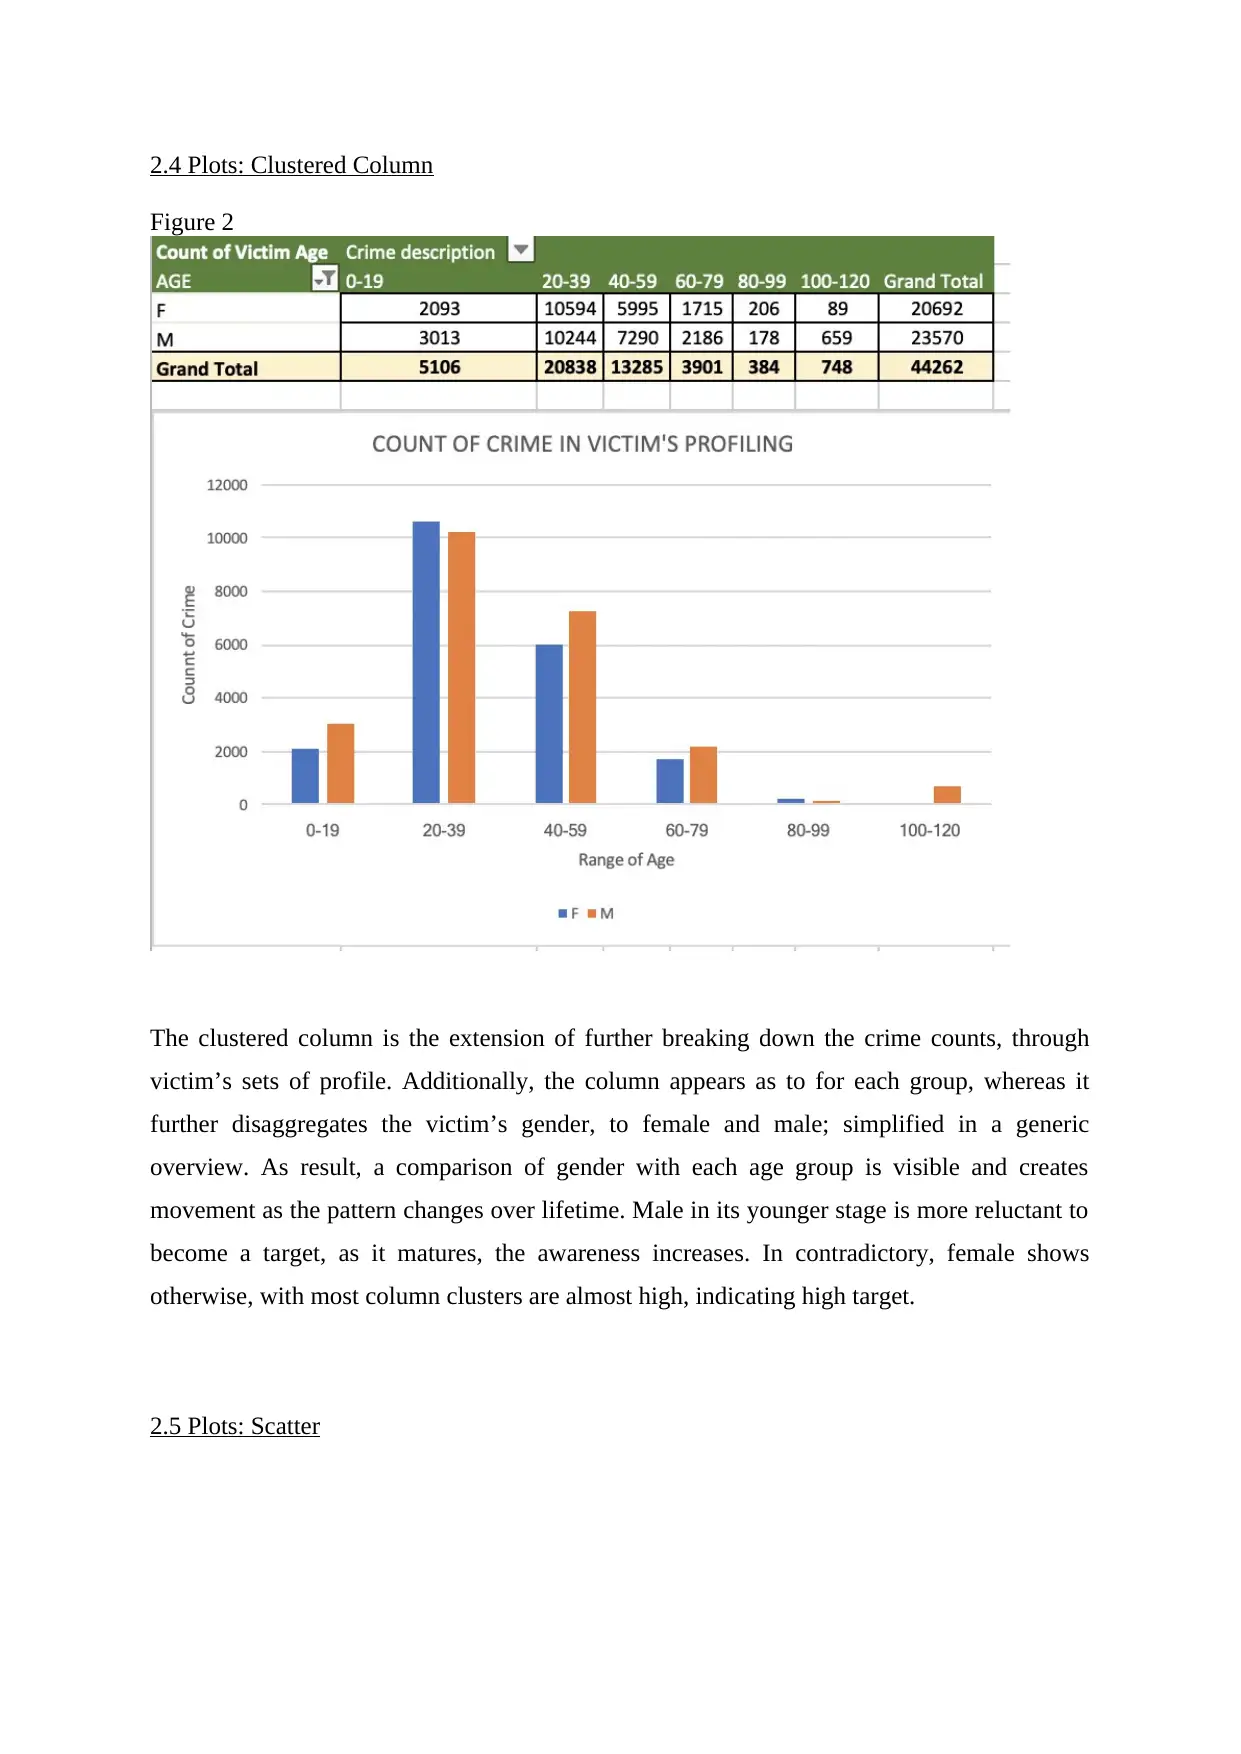
This report explores the application of data analytics in supply chain and logistics management. It discusses how big data and artificial intelligence (AI) are transforming the industry by enabling better decision-making, risk management, and efficiency. The report examines the use of data visualization techniques, including pivot tables, pie charts, and clustered columns, to analyze crime rates in Baltimore. The analysis highlights how data-driven insights can be used to identify trends, patterns, and potential areas for improvement within the supply chain. The report also addresses the challenges and opportunities associated with implementing data analytics, considering factors such as cost, capabilities, and the need for skilled professionals. Overall, the report emphasizes the importance of business analytics in achieving maximum efficiency and return on investment (ROI) in the supply chain.

BUSINESS ANALYTICS
ASSESSMENT TASK 1: DATA ANALYTICS
Paraphrase This Document
Need a fresh take? Get an instant paraphrase of this document with our AI Paraphraser

Applications of Data Analytics in Supply Chain and Logistics Management
The application of analytics in the Supply chain and logistics industry allows the
identification of trends and patterns from synthesizing past data, to predict the future, further
to better manage risks and anticipation (Alicke et al. 2016). The complexity of supply chain
process increases as activities within are often globalized, especially by multinational
enterprises. On the other hand, the high demand in such a rapidly changing environment
makes it a challenge to provide the best quality of goods and services, with minimum cost,
and the optimum time period; the objective is to achieve lean supply chain management. In
context of achieving optimization in the process, this is where analytics are advantageous
more than ever.
Analytical tool that are proven to provide big impact on supply chain industry are Big data
and Artificial Intelligence (AI). It generates extensive statistics visualization on past and
current trends to project future (IBM,2020). Therefore, more accurate insights to improve
decision making process. In this case, the improvement can happen in not limited to one part
of the supply chain channel, but can improve decisions throughout all supply chain channel;
sourcing, production, warehousing, transport, POS and end consumer (Alicke et al. 2016).
Taking the pandemic situation as an Instance, the demand for efficient supply chain
performance significantly increases. As coronavirus spread through humans, contactless
operation and social distancing are persuaded as preventive method. In relation to analytics,
big data allows the drone delivery to be used as part of AI approach, to provide contactless
delivery service to your door (Cozzens, 2020).
However, although there are numerous promising opportunities in data-driven approaches for
supply chain and logistics management in the market, only few that has actually maximized
analytics application in the process (Alicke et al. 2016); for instance, acquiring big data. Cost
and Capabilities presence in supply chain workers are what threatens the missed opportunities
of big data implementation.

In the upcoming years, the development of analytics can also digitalize the supply chain
process, replicating warehouse managers with machinery performing their tasks. It allows a
24/7 operation, systematic mass production, increase production rate; thus, efficiency (IBM,
2020). Additionally, by the high demand in social media use, AI can map customer
preference through their interactions and behavior without any direct consumer contact
needed. Productivity will definitely improve.
Overall, the objective of supply chain is to achieve maximum efficiency, in effort of
receiving high Return on Investment (ROI) (Alicke et al. 2016). The application of business
analytics, specifically on Big data and AI has proven to favor the industry’s objective in
optimization. Nonetheless, labor issues and financial capabilities should be taken into account
as applying analytics software into companies required a significant amount of upfront
capital. The expectation moving forward is to be able to minimize operational errors and risks
by anticipating in advance.
⊘ This is a preview!⊘
Do you want full access?
Subscribe today to unlock all pages.

Trusted by 1+ million students worldwide

2. Data Visualization
2.1 Pivot Tables: Crime Rate in Area Clusters
Table 1
Table 1 shows the area that is most dangerous in the City of Baltimore, and victim’s target
age. It can be extracted that Southwest has been the most significant location of the crime
occurrence, followed by Central of Baltimore weighing up to a quarter of the total. The
ability to analyze the hotspot of criminal activities can further alert the people to increase its
awareness for safety when travelling to these areas. Most of the victims are on their early
20’s to late 40s. The high rate in the age range is assumed to be due their rate of mobility too.
Moreover, the table is still limited to numerous factors that data set does not show; such as
the area’s population density.
Paraphrase This Document
Need a fresh take? Get an instant paraphrase of this document with our AI Paraphraser

2.2 Pivot Tables: Victim grouping/ profiling
Table 2
Table 2 intention is specifically to capture pattern of victim ideal profile; thus, it is useful for
both safety department of Baltimore, and the population. The three variables presence here
allows the knowledge extraction of the victim’s age, gender, and descent. Knowing each trait
contributed to the analysis of pattern, leading to future projection to minimize risks.
Furthermore, knowing the victim’s profile set can be useful for psychological reasoning,
analyzing the behavior pattern of offender. Presenting numbers in percentage form is
intended for a quicker visualization of the variable’s proportion in the situation.

2.3 Pie Chart
Figure 1
The pie chart clearly shows the crime percentage for each group of age of the victims in the
dataset. Through the visualization of pie chart, we can easily identify the highest crime rate,
following to the lowest, through the color coding feature. Rather than seeing multiple
numbers of counts, presenting inn percentage gives an instant overview, to give the idea that
young adults inn this situation is prone as target of criminals.
⊘ This is a preview!⊘
Do you want full access?
Subscribe today to unlock all pages.

Trusted by 1+ million students worldwide

2.4 Plots: Clustered Column
Figure 2
The clustered column is the extension of further breaking down the crime counts, through
victim’s sets of profile. Additionally, the column appears as to for each group, whereas it
further disaggregates the victim’s gender, to female and male; simplified in a generic
overview. As result, a comparison of gender with each age group is visible and creates
movement as the pattern changes over lifetime. Male in its younger stage is more reluctant to
become a target, as it matures, the awareness increases. In contradictory, female shows
otherwise, with most column clusters are almost high, indicating high target.
2.5 Plots: Scatter
Paraphrase This Document
Need a fresh take? Get an instant paraphrase of this document with our AI Paraphraser

Reference List
Alicke, K., Glatzel, C., Hoberg, K. and Karlsson, P., 2016. Big Data And The Supply Chain: The Big-
Supply-Chain Analytics Landscape (Part 1). [online] McKinsey & Company
<https://www.mckinsey.com/business-functions/operations/our-insights/big-data-and-the-supply-
chain-the-big-supply-chain-analytics-landscape-part-1> [Accessed 5 April 2020].
Cozzens, T., 2020. China Fights Coronavirus With Delivery Drones - GPS World. [online] GPS World.
<https://www.gpsworld.com/china-fights-coronavirus-with-delivery-drones/> [Accessed 5 April 2020].
Ibm.com. 2020. What Is Supply Chain Analytics. [online] <https://www.ibm.com/supply-chain/supply-
chain-analytics> [Accessed 5 April 2020].
Ittmann, H.W., 2015, ‘The impact of big data and business analytics on supply chain
management’, Journal of Transport and Supply Chain Management 9(1), Art. #165, 9 pages.
http://dx.doi. org/10.4102/jtscm.v9i1.165
1 out of 8
Related Documents

Your All-in-One AI-Powered Toolkit for Academic Success.
+13062052269
info@desklib.com
Available 24*7 on WhatsApp / Email
Unlock your academic potential
Copyright © 2020–2025 A2Z Services. All Rights Reserved. Developed and managed by ZUCOL.