Business Intelligence and Data Handling Report for Smile Clinic
VerifiedAdded on 2023/01/03
|13
|3091
|440
Report
AI Summary
This report delves into the critical aspects of data handling and business intelligence, focusing on a case study involving Smile Clinic. It explores the uses of Microsoft Excel for data preprocessing, including data storage, recovery, report generation, and research, as well as the application of the IF and lookup functions. The report then presents a clustering example using the audidealership.csv dataset with Weka, analyzing the results to identify key features. Furthermore, it evaluates common data mining techniques, such as statistical methods, pattern recognition, and deployment strategies, with real-world examples. Finally, the report compares the advantages and disadvantages of Weka over Microsoft Excel, providing a comprehensive overview of data analysis tools and techniques.

Data handling and
business intelligence
business intelligence
Paraphrase This Document
Need a fresh take? Get an instant paraphrase of this document with our AI Paraphraser
Contents
Contents...........................................................................................................................................2
INTRODUCTION...........................................................................................................................1
PART 1............................................................................................................................................1
1. Detailed examination of the uses that excel pre-processing data possess in the long run
scenario for different firms..........................................................................................................1
PART 2............................................................................................................................................4
2.1 By using audidealership.csv that was provided in conjunction with Weka gives a specific
example of clustering...................................................................................................................4
2.2 Detailed explanation as well as evaluation of the methods of common data mining that can
be used in the business relating with real examples that are prevailing in the market................7
2.3 Detailed analysis and evaluation of Advantages as well as disadvantages of Weka over
Microsoft Excel...........................................................................................................................9
CONCLUSION..............................................................................................................................10
REFERENCES..............................................................................................................................11
INTRODUCTION
As it is known that data handling is one of the most important as well as crucial aspect in
each and every business irrespective of the industry in which it is operating as it is related with
the facts and figures of the firm that possess a lot of importance in the current market scenario
(Boyles, 2019). In this report there is a brief discussion of various aspects that are related with a
firm that is Smile Clinic and a detailed evaluation of various factors that are involves in it so as
to do a systematic analysis as well as evaluation of different things that are pretty important from
the company’s point of view. Apart from that different types of functions that are performed in
Excel are also evaluated in this report according to the needs, requirements, and demand of the
business.
PART 1
1. Detailed examination of the uses that excel pre-processing data possess in the long run
scenario for different firms
There are many functions and uses of Microsoft Excel and an organisation can be listed in
it for the sake of its clients, managers of the company, owner of the enterprise, collection of data,
and constant as well as regular analysis of the functions of the Microsoft Excel. As there are
many functions that are included in Microsoft Excel all of them are described below in detail in a
systematic manner-
Analyzing and storing data- As there are many other ways also to analyze and evaluate
data and there are various ways too in which its storage can be done but in Microsoft
Excel both can be done in a systematic and accurate manner that helps in detailed
evaluation of all the aspects that carriers a lot of value in the industry. There are different
tools that can be used in it so that storage of data can be done in a precise manner which
would further result in improvement of the value of the firm in the market and thus
enabling the company to sustain in the industry for a much longer period of time as
compared to its competitors (Fatima and Linnes, 2019).
Data recovery- It is one of the most important as well as essential part as in Microsoft
Excel there is a tool which helps in recovering the data that is wrongfully deleted and
thus adding the value to the operations of the organizations.
⊘ This is a preview!⊘
Do you want full access?
Subscribe today to unlock all pages.
Trusted by 1+ million students worldwide
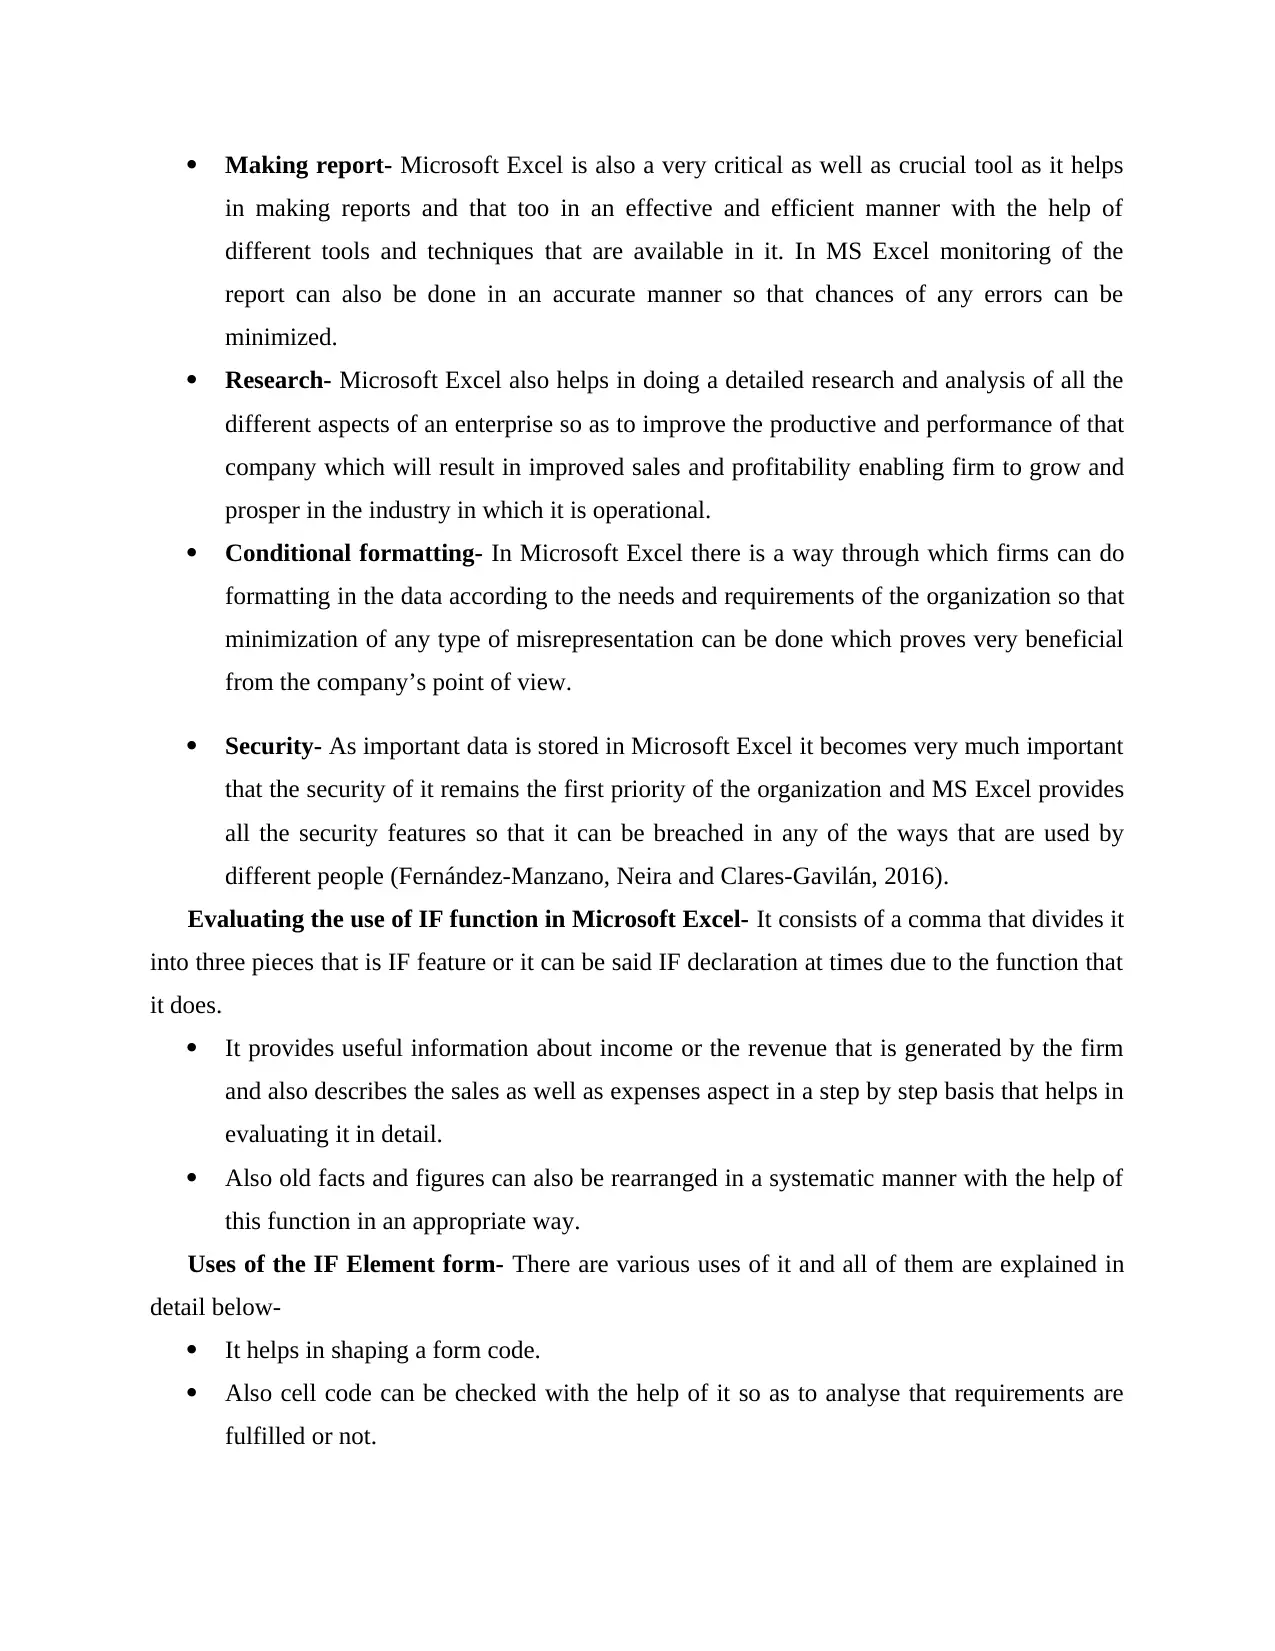
Making report- Microsoft Excel is also a very critical as well as crucial tool as it helps
in making reports and that too in an effective and efficient manner with the help of
different tools and techniques that are available in it. In MS Excel monitoring of the
report can also be done in an accurate manner so that chances of any errors can be
minimized.
Research- Microsoft Excel also helps in doing a detailed research and analysis of all the
different aspects of an enterprise so as to improve the productive and performance of that
company which will result in improved sales and profitability enabling firm to grow and
prosper in the industry in which it is operational.
Conditional formatting- In Microsoft Excel there is a way through which firms can do
formatting in the data according to the needs and requirements of the organization so that
minimization of any type of misrepresentation can be done which proves very beneficial
from the company’s point of view.
Security- As important data is stored in Microsoft Excel it becomes very much important
that the security of it remains the first priority of the organization and MS Excel provides
all the security features so that it can be breached in any of the ways that are used by
different people (Fernández-Manzano, Neira and Clares-Gavilán, 2016).
Evaluating the use of IF function in Microsoft Excel- It consists of a comma that divides it
into three pieces that is IF feature or it can be said IF declaration at times due to the function that
it does.
It provides useful information about income or the revenue that is generated by the firm
and also describes the sales as well as expenses aspect in a step by step basis that helps in
evaluating it in detail.
Also old facts and figures can also be rearranged in a systematic manner with the help of
this function in an appropriate way.
Uses of the IF Element form- There are various uses of it and all of them are explained in
detail below-
It helps in shaping a form code.
Also cell code can be checked with the help of it so as to analyse that requirements are
fulfilled or not.
Paraphrase This Document
Need a fresh take? Get an instant paraphrase of this document with our AI Paraphraser
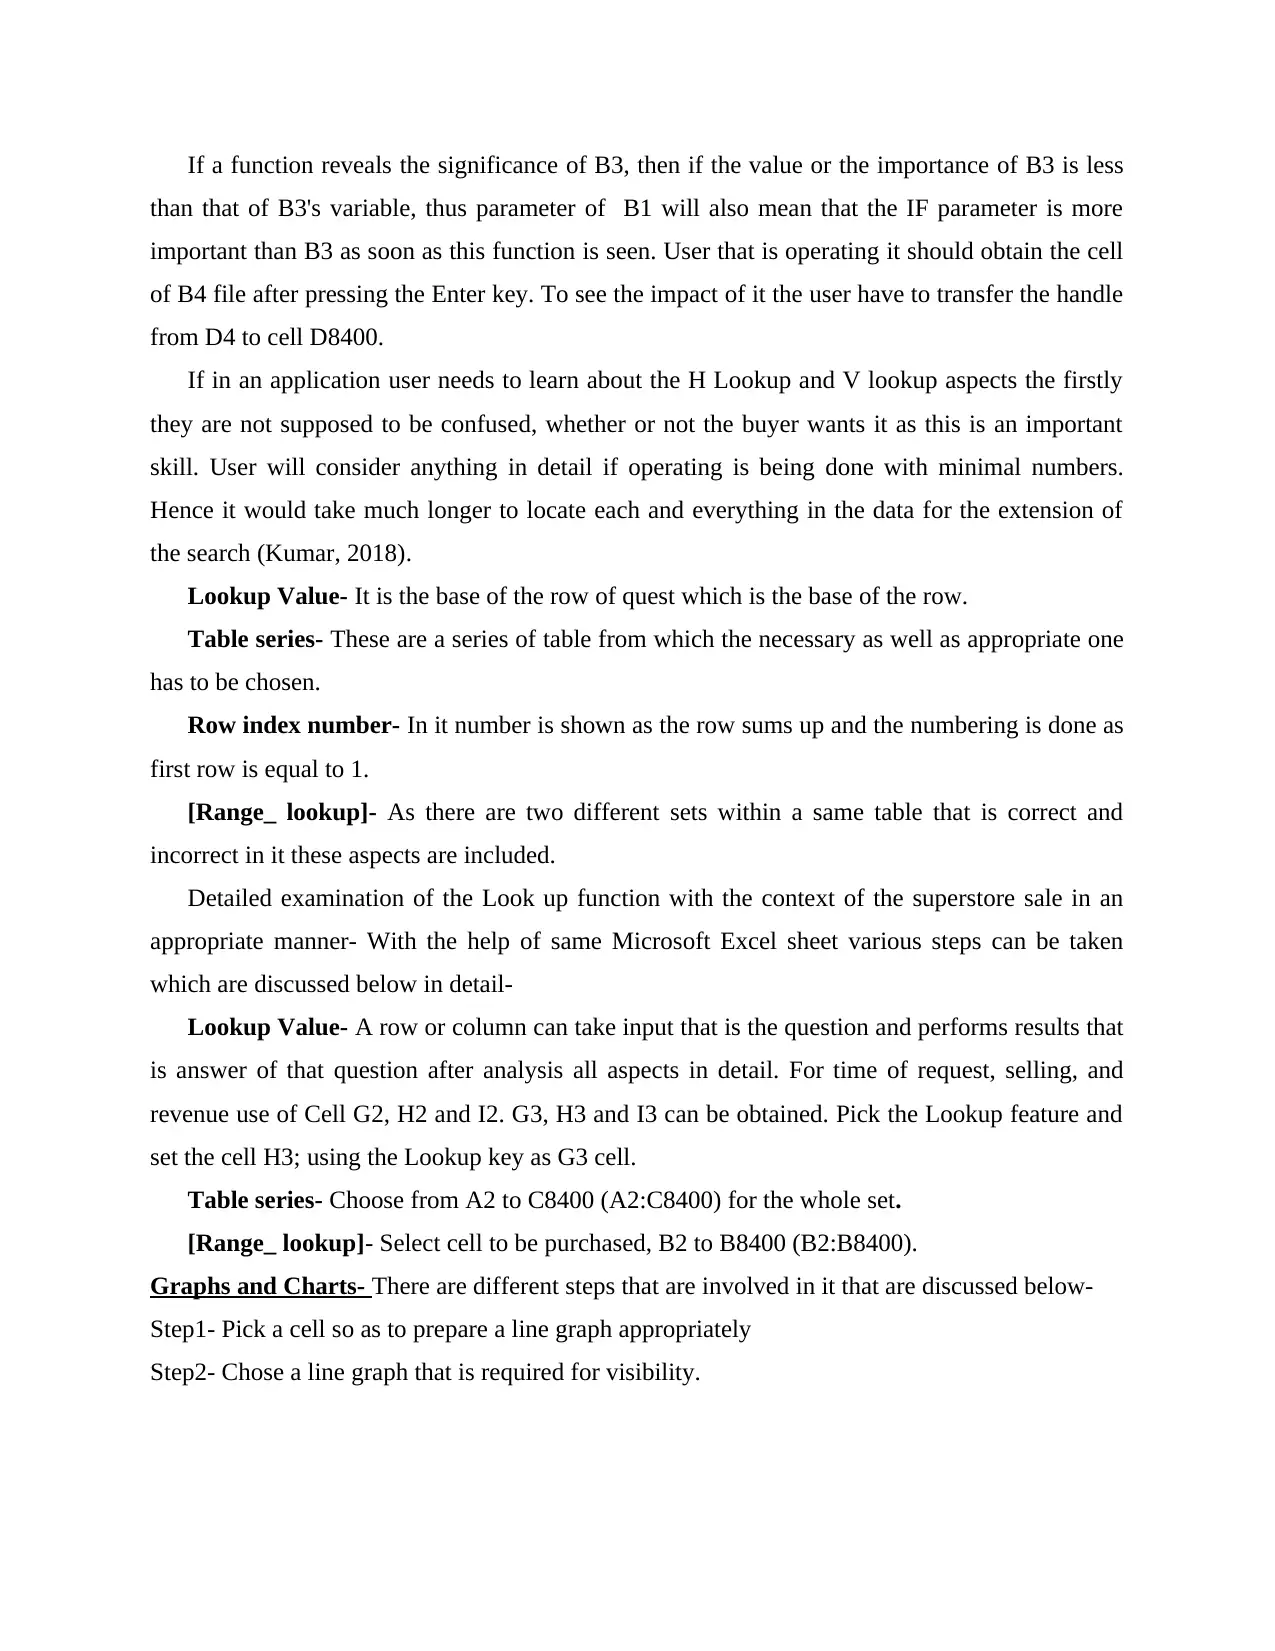
If a function reveals the significance of B3, then if the value or the importance of B3 is less
than that of B3's variable, thus parameter of B1 will also mean that the IF parameter is more
important than B3 as soon as this function is seen. User that is operating it should obtain the cell
of B4 file after pressing the Enter key. To see the impact of it the user have to transfer the handle
from D4 to cell D8400.
If in an application user needs to learn about the H Lookup and V lookup aspects the firstly
they are not supposed to be confused, whether or not the buyer wants it as this is an important
skill. User will consider anything in detail if operating is being done with minimal numbers.
Hence it would take much longer to locate each and everything in the data for the extension of
the search (Kumar, 2018).
Lookup Value- It is the base of the row of quest which is the base of the row.
Table series- These are a series of table from which the necessary as well as appropriate one
has to be chosen.
Row index number- In it number is shown as the row sums up and the numbering is done as
first row is equal to 1.
[Range_ lookup]- As there are two different sets within a same table that is correct and
incorrect in it these aspects are included.
Detailed examination of the Look up function with the context of the superstore sale in an
appropriate manner- With the help of same Microsoft Excel sheet various steps can be taken
which are discussed below in detail-
Lookup Value- A row or column can take input that is the question and performs results that
is answer of that question after analysis all aspects in detail. For time of request, selling, and
revenue use of Cell G2, H2 and I2. G3, H3 and I3 can be obtained. Pick the Lookup feature and
set the cell H3; using the Lookup key as G3 cell.
Table series- Choose from A2 to C8400 (A2:C8400) for the whole set.
[Range_ lookup]- Select cell to be purchased, B2 to B8400 (B2:B8400).
Graphs and Charts- There are different steps that are involved in it that are discussed below-
Step1- Pick a cell so as to prepare a line graph appropriately
Step2- Chose a line graph that is required for visibility.
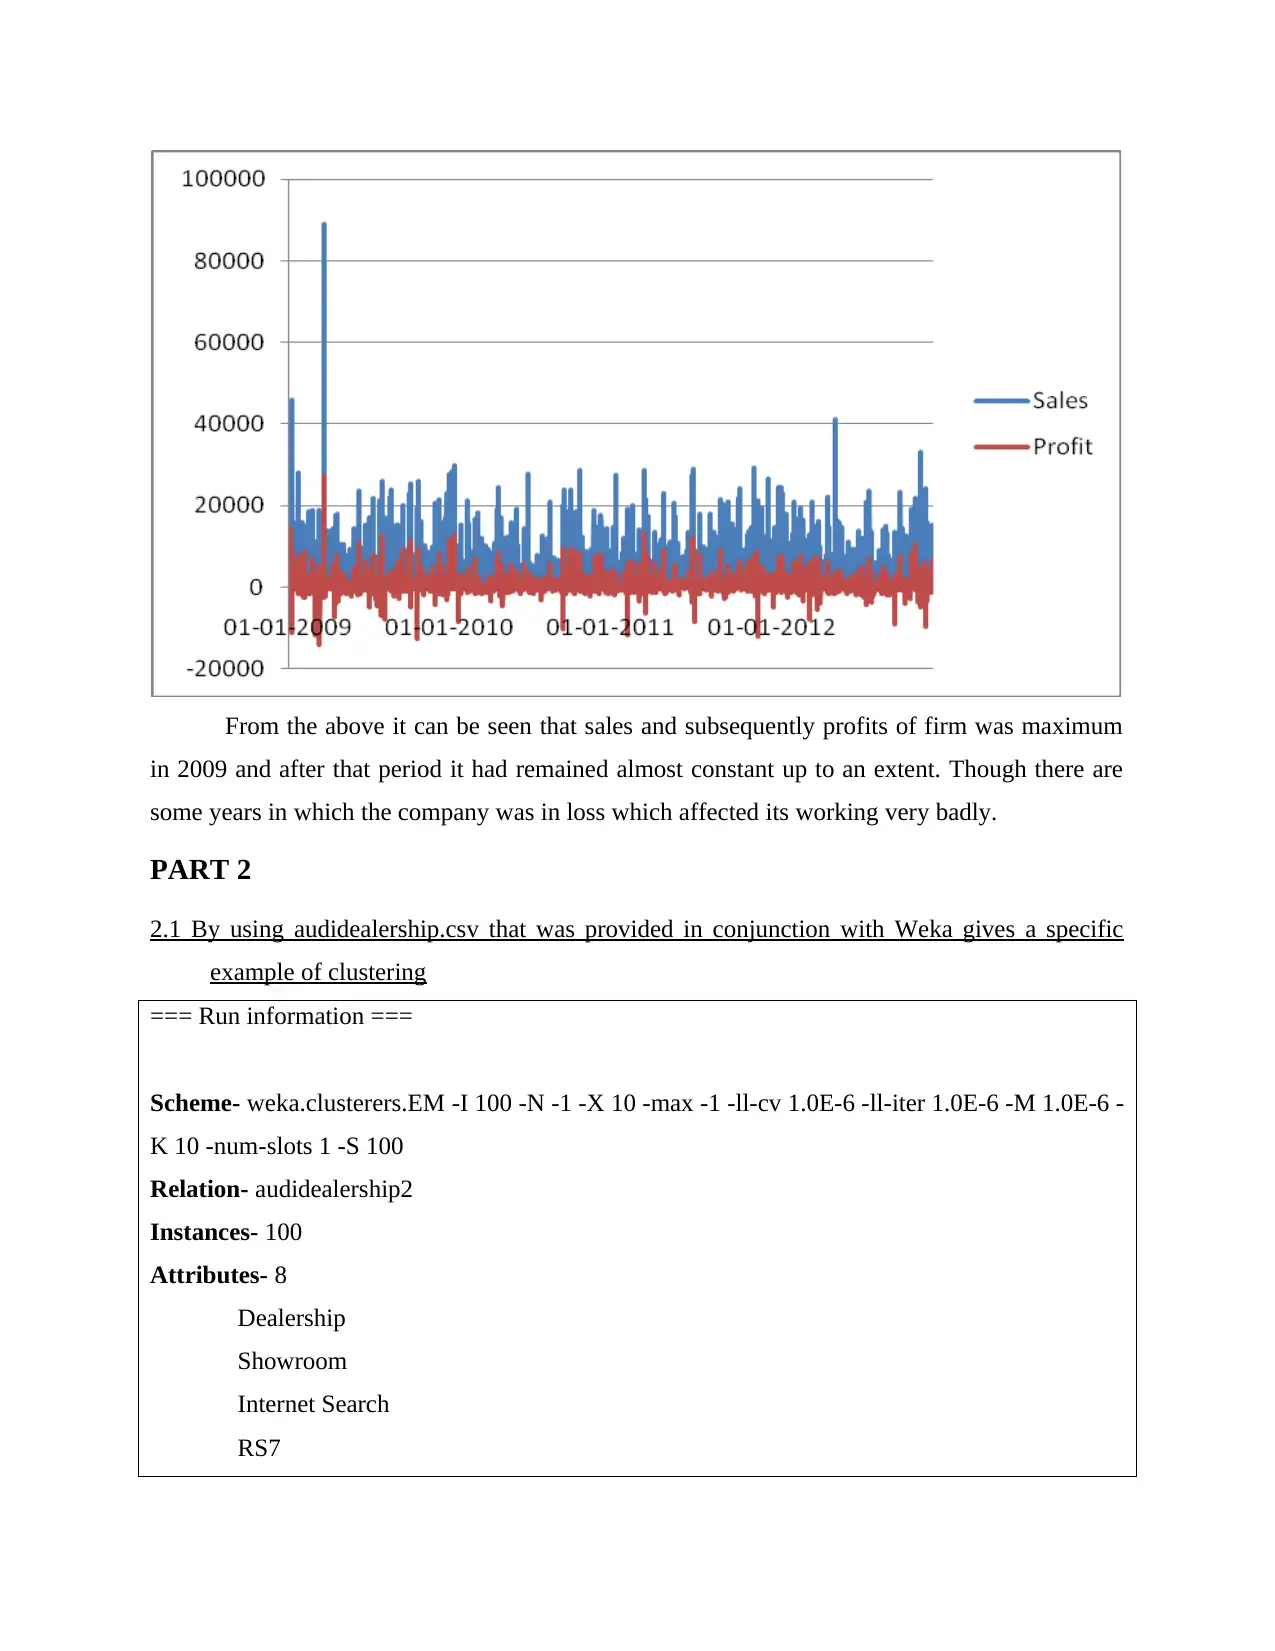
From the above it can be seen that sales and subsequently profits of firm was maximum
in 2009 and after that period it had remained almost constant up to an extent. Though there are
some years in which the company was in loss which affected its working very badly.
PART 2
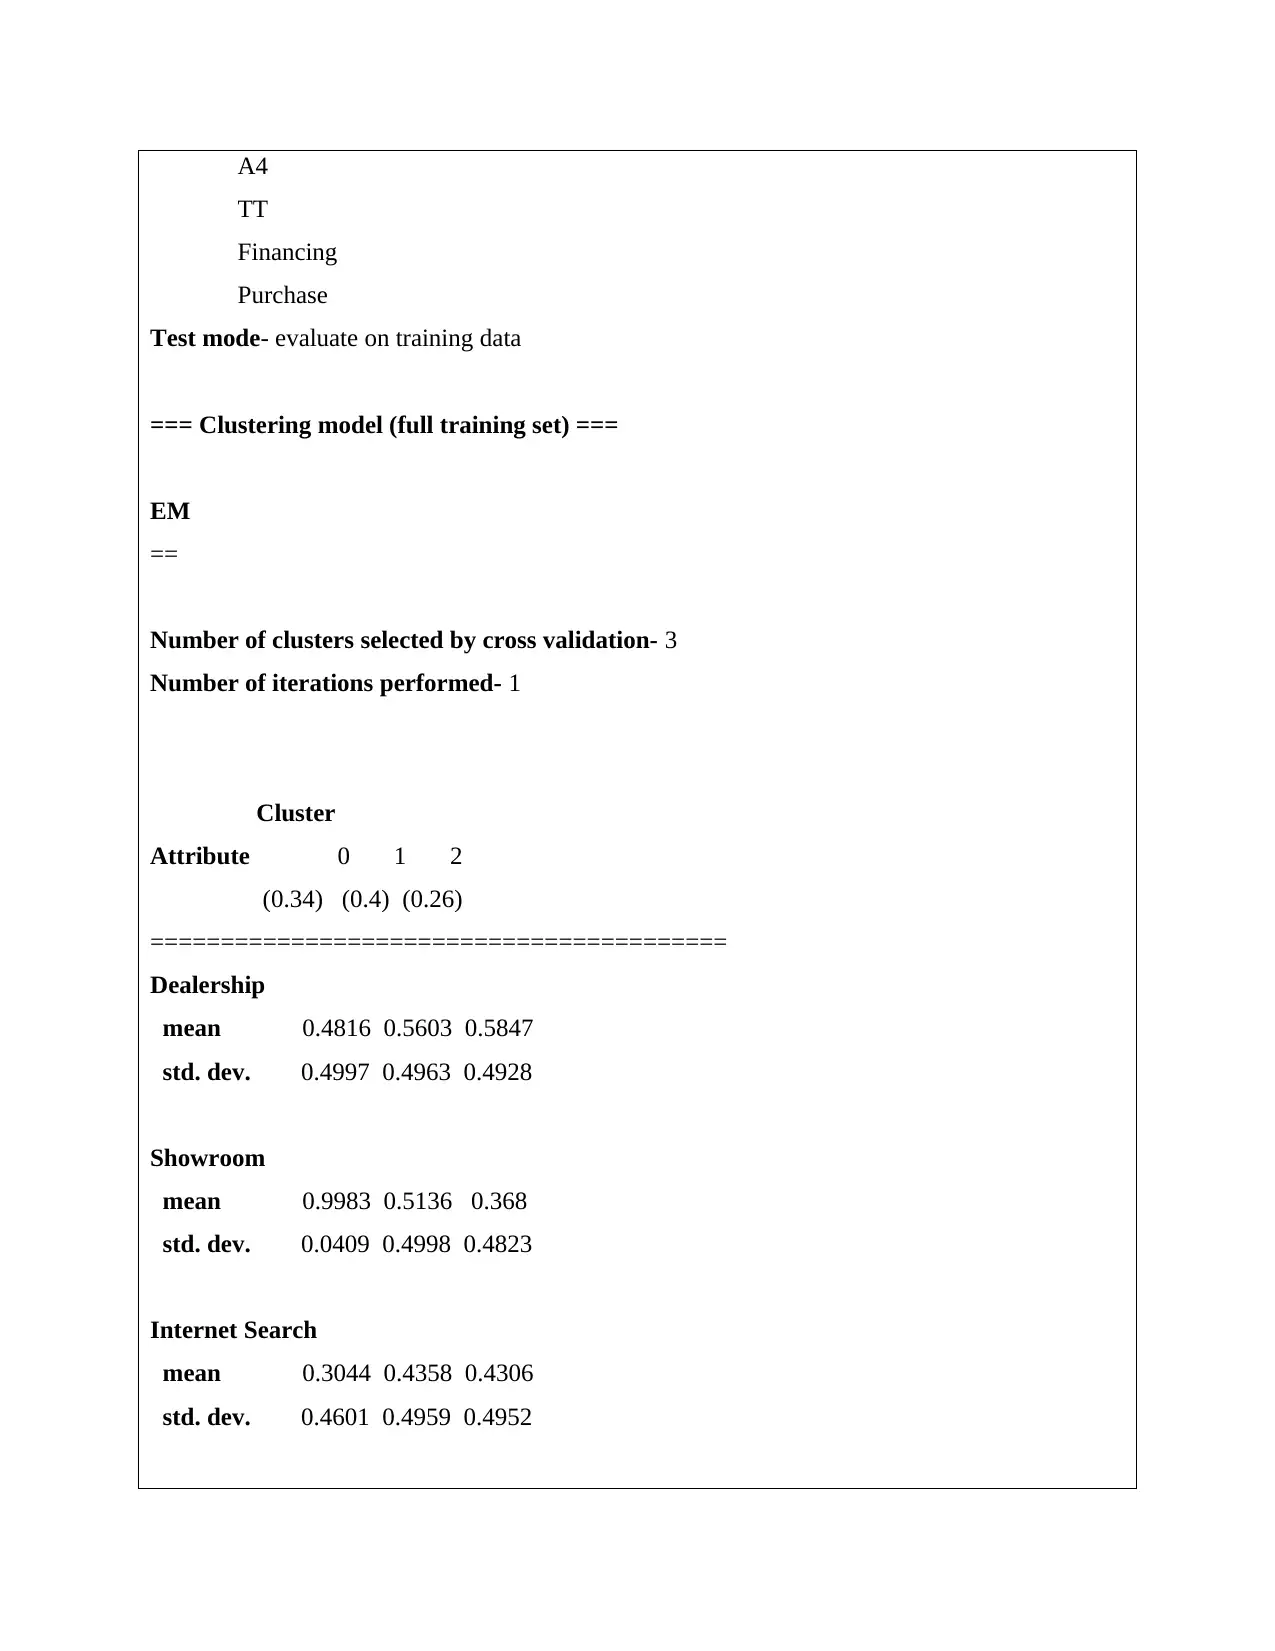
2.1 By using audidealership.csv that was provided in conjunction with Weka gives a specific
example of clustering
=== Run information ===
Scheme- weka.clusterers.EM -I 100 -N -1 -X 10 -max -1 -ll-cv 1.0E-6 -ll-iter 1.0E-6 -M 1.0E-6 -
K 10 -num-slots 1 -S 100
Relation- audidealership2
Instances- 100
Attributes- 8
Dealership
Showroom
Internet Search
RS7
in 2009 and after that period it had remained almost constant up to an extent. Though there are
some years in which the company was in loss which affected its working very badly.
PART 2
2.1 By using audidealership.csv that was provided in conjunction with Weka gives a specific
example of clustering
=== Run information ===
Scheme- weka.clusterers.EM -I 100 -N -1 -X 10 -max -1 -ll-cv 1.0E-6 -ll-iter 1.0E-6 -M 1.0E-6 -
K 10 -num-slots 1 -S 100
Relation- audidealership2
Instances- 100
Attributes- 8
Dealership
Showroom
Internet Search
RS7
⊘ This is a preview!⊘
Do you want full access?
Subscribe today to unlock all pages.
Trusted by 1+ million students worldwide
A4
TT
Financing
Purchase
Test mode- evaluate on training data
=== Clustering model (full training set) ===
EM
==
Number of clusters selected by cross validation- 3
Number of iterations performed- 1
Cluster
Attribute 0 1 2
(0.34) (0.4) (0.26)
=========================================
Dealership
mean 0.4816 0.5603 0.5847
std. dev. 0.4997 0.4963 0.4928
Showroom
mean 0.9983 0.5136 0.368
std. dev. 0.0409 0.4998 0.4823
Internet Search
mean 0.3044 0.4358 0.4306
std. dev. 0.4601 0.4959 0.4952
Paraphrase This Document
Need a fresh take? Get an instant paraphrase of this document with our AI Paraphraser
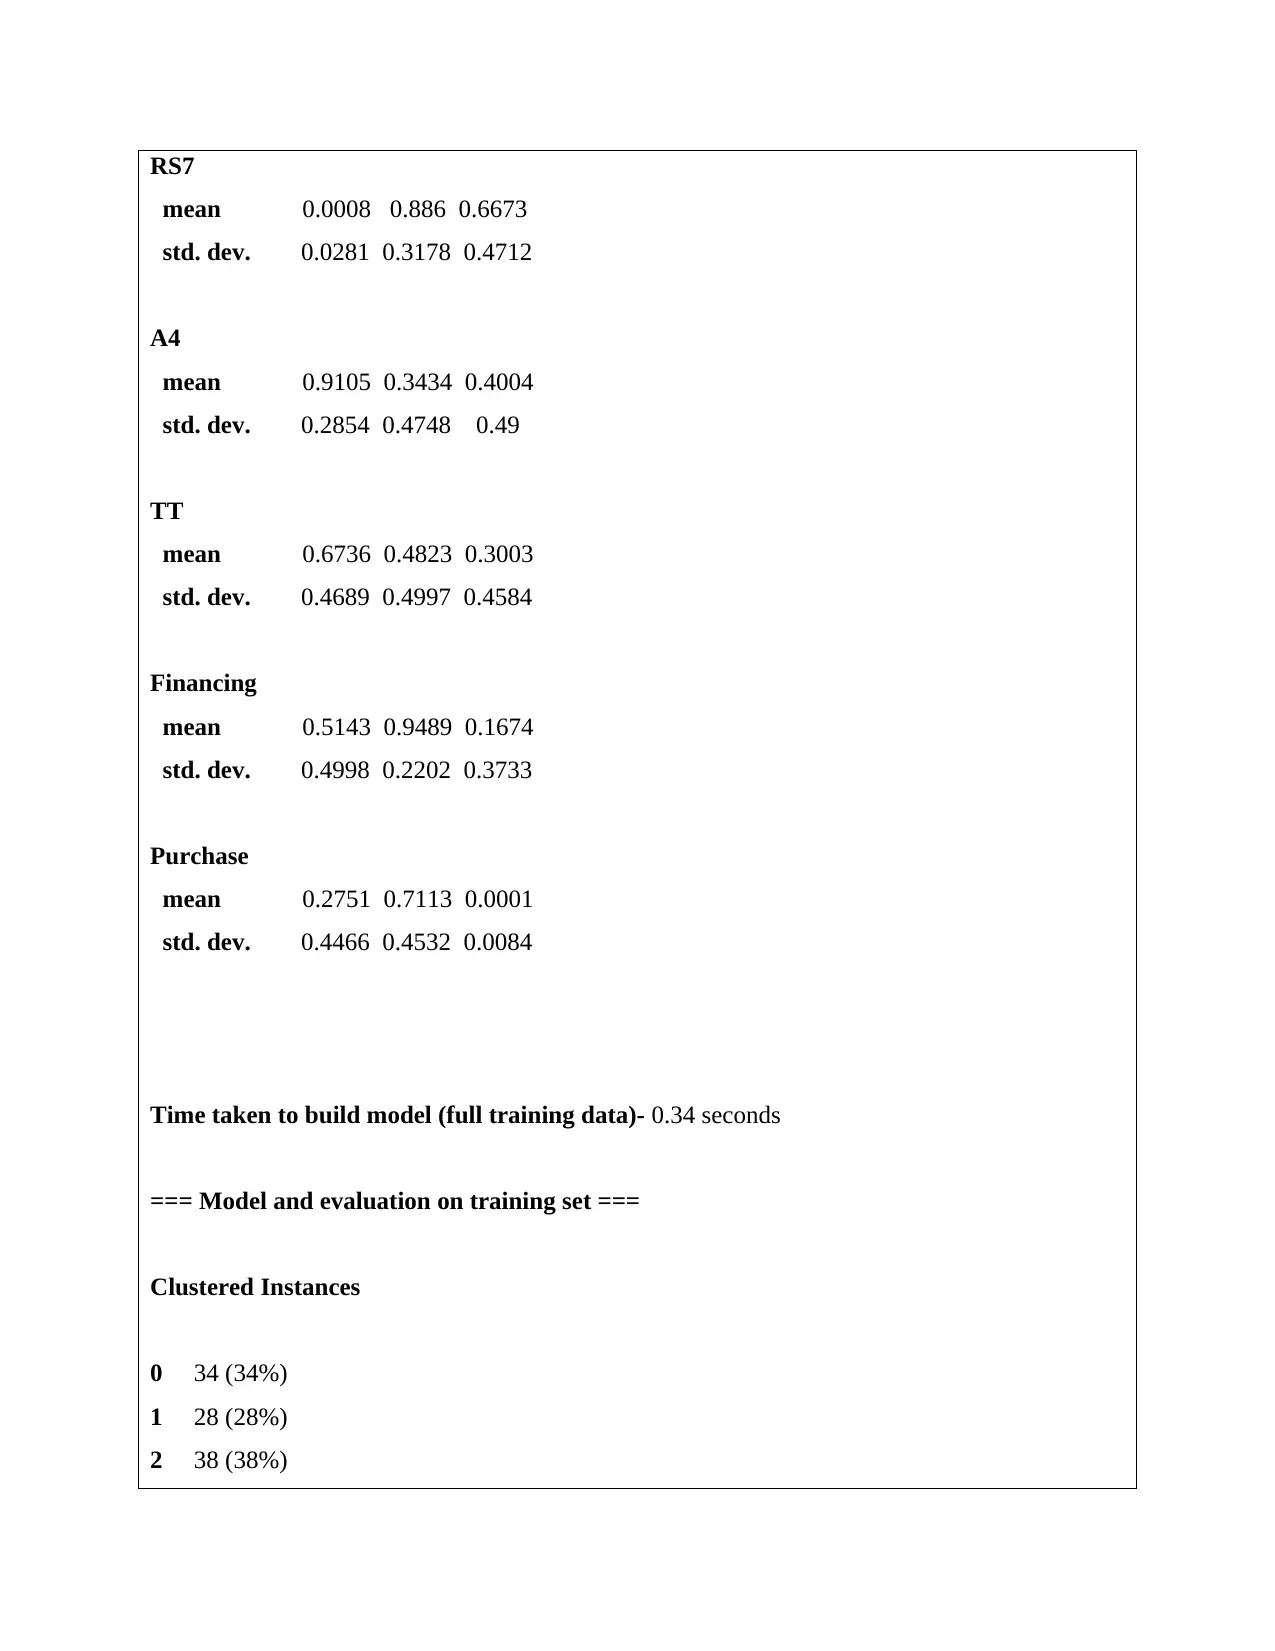
RS7
mean 0.0008 0.886 0.6673
std. dev. 0.0281 0.3178 0.4712
A4
mean 0.9105 0.3434 0.4004
std. dev. 0.2854 0.4748 0.49
TT
mean 0.6736 0.4823 0.3003
std. dev. 0.4689 0.4997 0.4584
Financing
mean 0.5143 0.9489 0.1674
std. dev. 0.4998 0.2202 0.3733
Purchase
mean 0.2751 0.7113 0.0001
std. dev. 0.4466 0.4532 0.0084
Time taken to build model (full training data)- 0.34 seconds
=== Model and evaluation on training set ===
Clustered Instances
0 34 (34%)
1 28 (28%)
2 38 (38%)
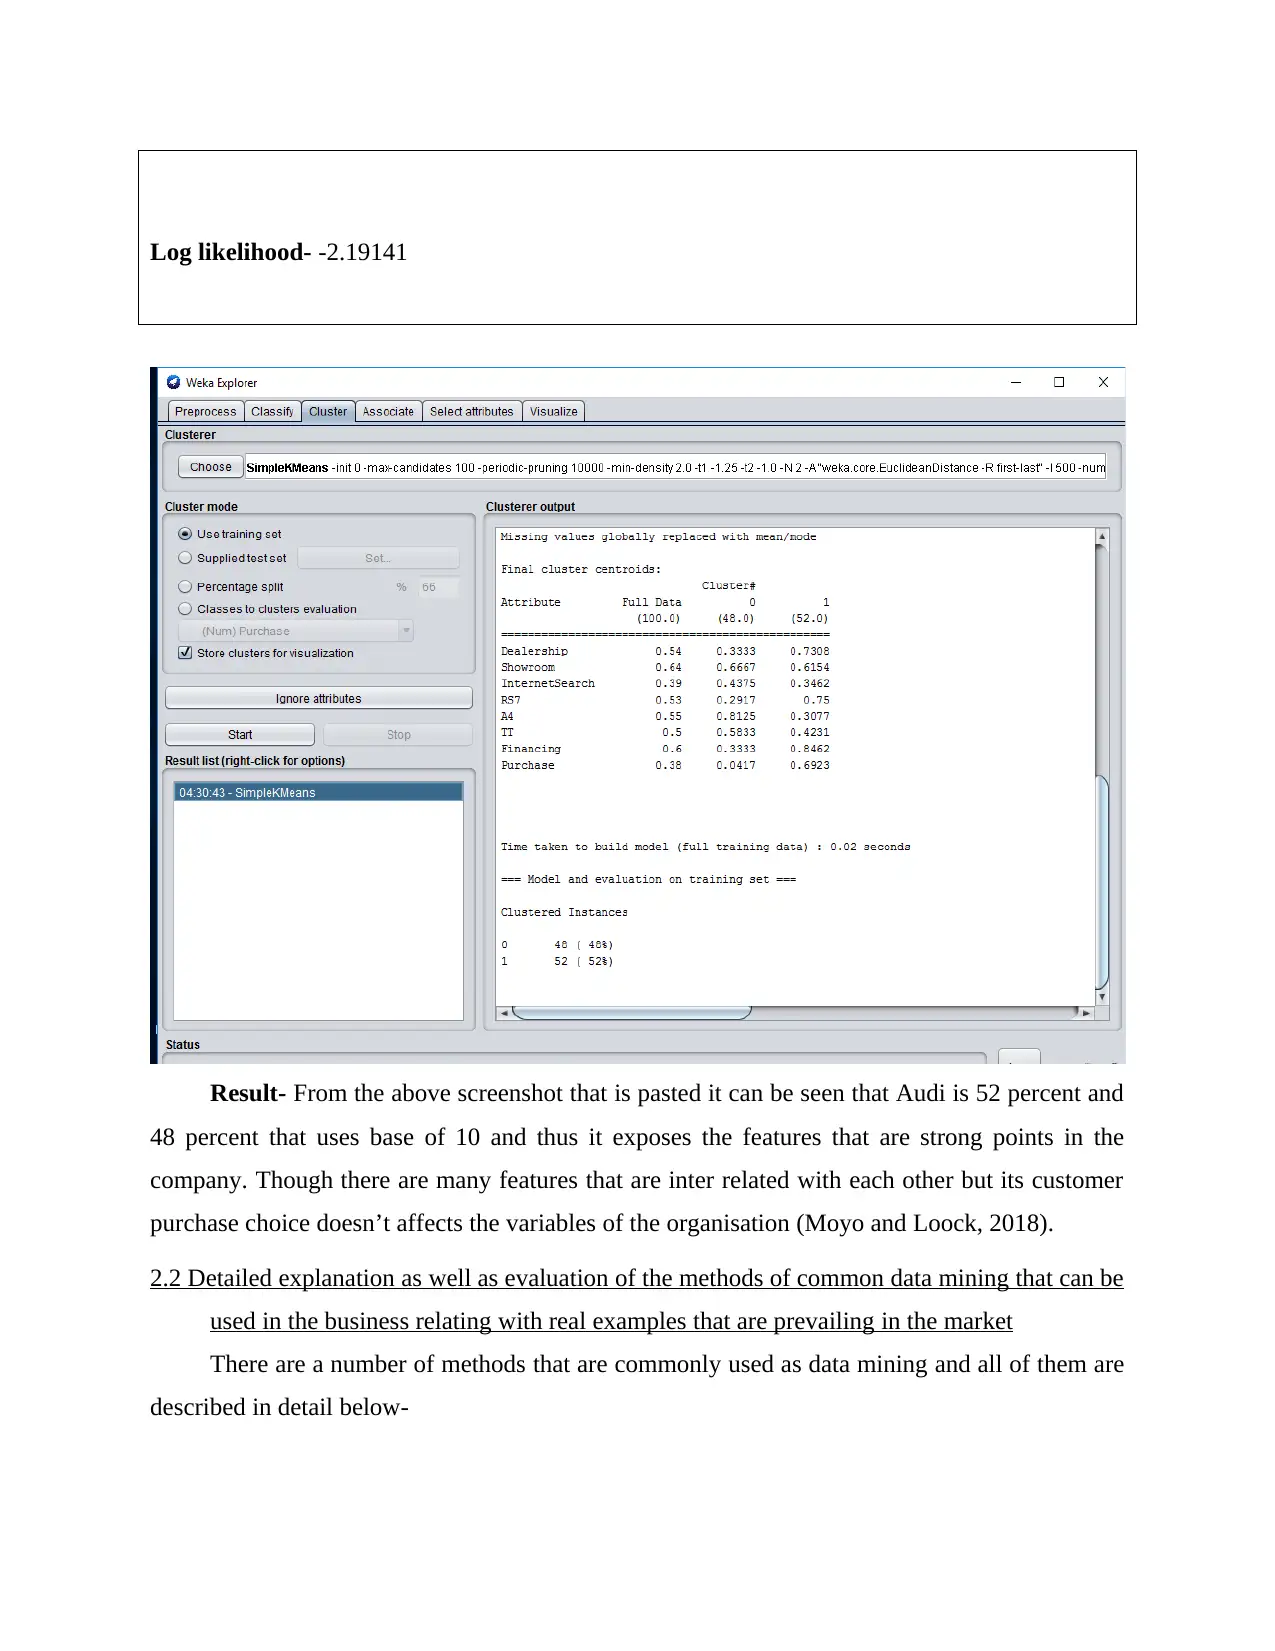
Log likelihood- -2.19141
Result- From the above screenshot that is pasted it can be seen that Audi is 52 percent and
48 percent that uses base of 10 and thus it exposes the features that are strong points in the
company. Though there are many features that are inter related with each other but its customer
purchase choice doesn’t affects the variables of the organisation (Moyo and Loock, 2018).
2.2 Detailed explanation as well as evaluation of the methods of common data mining that can be
used in the business relating with real examples that are prevailing in the market
There are a number of methods that are commonly used as data mining and all of them are
described in detail below-
⊘ This is a preview!⊘
Do you want full access?
Subscribe today to unlock all pages.
Trusted by 1+ million students worldwide
Data mining technique- It is a technique that is old, tried, as well as tested as it gives
maximum results and that to in positive aspect to each and every firm that uses it in an
appropriate manner. It includes various other factors too like classification analysis, learning of
associate rules, detection of anomaly or outlier, analysis of different types of clusters, regression
analysis, etc. and thus it carriers a lot of value in the current market situation. There are three
major steps that are needed in this technique and all of them are analysed below briefly-
Exploration- In this step data is transformed and cleared so as to measure the results in
an effective and efficient way (Mumtaz and Ashraf, 2017).
Pattern Recognition- This step includes the recognition of the strongest pattern that will
help in establishing a good market value and that too in long term.
Deployment- This step involves production of appropriate effects so as to determine
trends that can be used precisely.
Data mining technique- It is one of the most important perspective as application of a
correct as well as useful data mining techniques becomes a necessity for each firm that wants to
grow and expand in the market and it is also very useful in building long term sustainability. As
it is a wider concept and includes many things but majorly involves six most common used
techniques by firms that are evaluated below in detail-
Statistical Techniques- These are techniques that are involved in data mining method
and is regarded as one of the most important aspect as it is related with the statistical data
that is regarded as the most essential as well as integral part of each and every
organisation that is operating in the market. There are different issues that are related
with it so as to analyse the future prospects which will help the business to grow and
these are-
What is the trend of data network?
For how many occasions it can occur?
What are the patterns that possess a lot of value for the company?
What is a high-level description of the things that are found in the document?
Clustering Techniques- It is a technique in which certain groups are formed according
to a similarity and then subsequent clusters are formed so that analysis and evaluation can
be done quickly as well as in a systematic manner (Pahl and Voß, 2020). There are
various different methods that are involved in it and they are explained below-
Paraphrase This Document
Need a fresh take? Get an instant paraphrase of this document with our AI Paraphraser
Hierarchical agglomerative methods
Grid based methods
Model based methods
Division methods
Density based methods
View- It is regarded as one of the best way as it is related with imaging a situation that
has a great possibility of happening and after that a detailed study can be done on that
which would result in high level of success rate in the market as compared to other
competitors that are prevailing in the similar industry. Trend analysis is mainly done in it
so as to make necessary arrangements for the future prospects (Riker Jr, 2019).
Induction Decision Tree Technique- It is a technique in which a tree like structure is
formed and on the basis of it different evaluations are done so that all the aspects can be
studied in detailed making it a much better technique as compared to others that only
focuses on a single factor. It can be also used as pre-processing as it is closely related
with it.
Neural Network- It is a technique which involves human beings and artificial
intelligence technology is also used in depth in this factor as well as it involves certain
things that are described below-
How does nodes are linked in it?
What will be the production units and its amount?
When the training will complete?
Association Rule Technique- It is a technique that involves two aspects that are
associated with each other in some or the other aspect and analysis and evaluation of
those factors are included in this technique (Stepashko, 2017).
2.3 Detailed analysis and evaluation of Advantages as well as disadvantages of Weka over
Microsoft Excel
Weka is an open sources code that proves beneficial in evaluating the artificial intelligence
technology and also involves gaining of various types of knowledge in it too. It involves a UNIX
interface and a GUI Explorer. Advantages and disadvantages of it are explained below in detail-

Advantages of Weka over Microsoft Excel- As it is a compilation of different aspects
that are related with advanced technology and also allows submission of pictures and its editing
in a quicker as well as better manner which MS Excel lacks.
Disadvantages of Weka over Microsoft Excel- Weka involves use of high technology
which at times is not feasible for all the firms that are operating in the market while it is very
easy to operated Microsoft Excel (Wangoo, 2018).
CONCLUSION
From the above it can be concluded that Microsoft Excel is of high importance as it helps
the business in its operations and that too in a systematic as well as precise manner that proves
beneficial for the firm in increasing and improving its market value in the industry in which it
operates. Though there are some disadvantages of it too but its advantages outnumber them by a
huge margin.
⊘ This is a preview!⊘
Do you want full access?
Subscribe today to unlock all pages.
Trusted by 1+ million students worldwide
1 out of 13
Related Documents


Your All-in-One AI-Powered Toolkit for Academic Success.
+13062052269
info@desklib.com
Available 24*7 on WhatsApp / Email
![[object Object]](/_next/static/media/star-bottom.7253800d.svg)
Unlock your academic potential
Copyright © 2020–2026 A2Z Services. All Rights Reserved. Developed and managed by ZUCOL.