Data Design Report: Data Design, Analysis and Recommendations

Verified

Added on  2023/01/16

|9
|1502
|64
Report
AI Summary
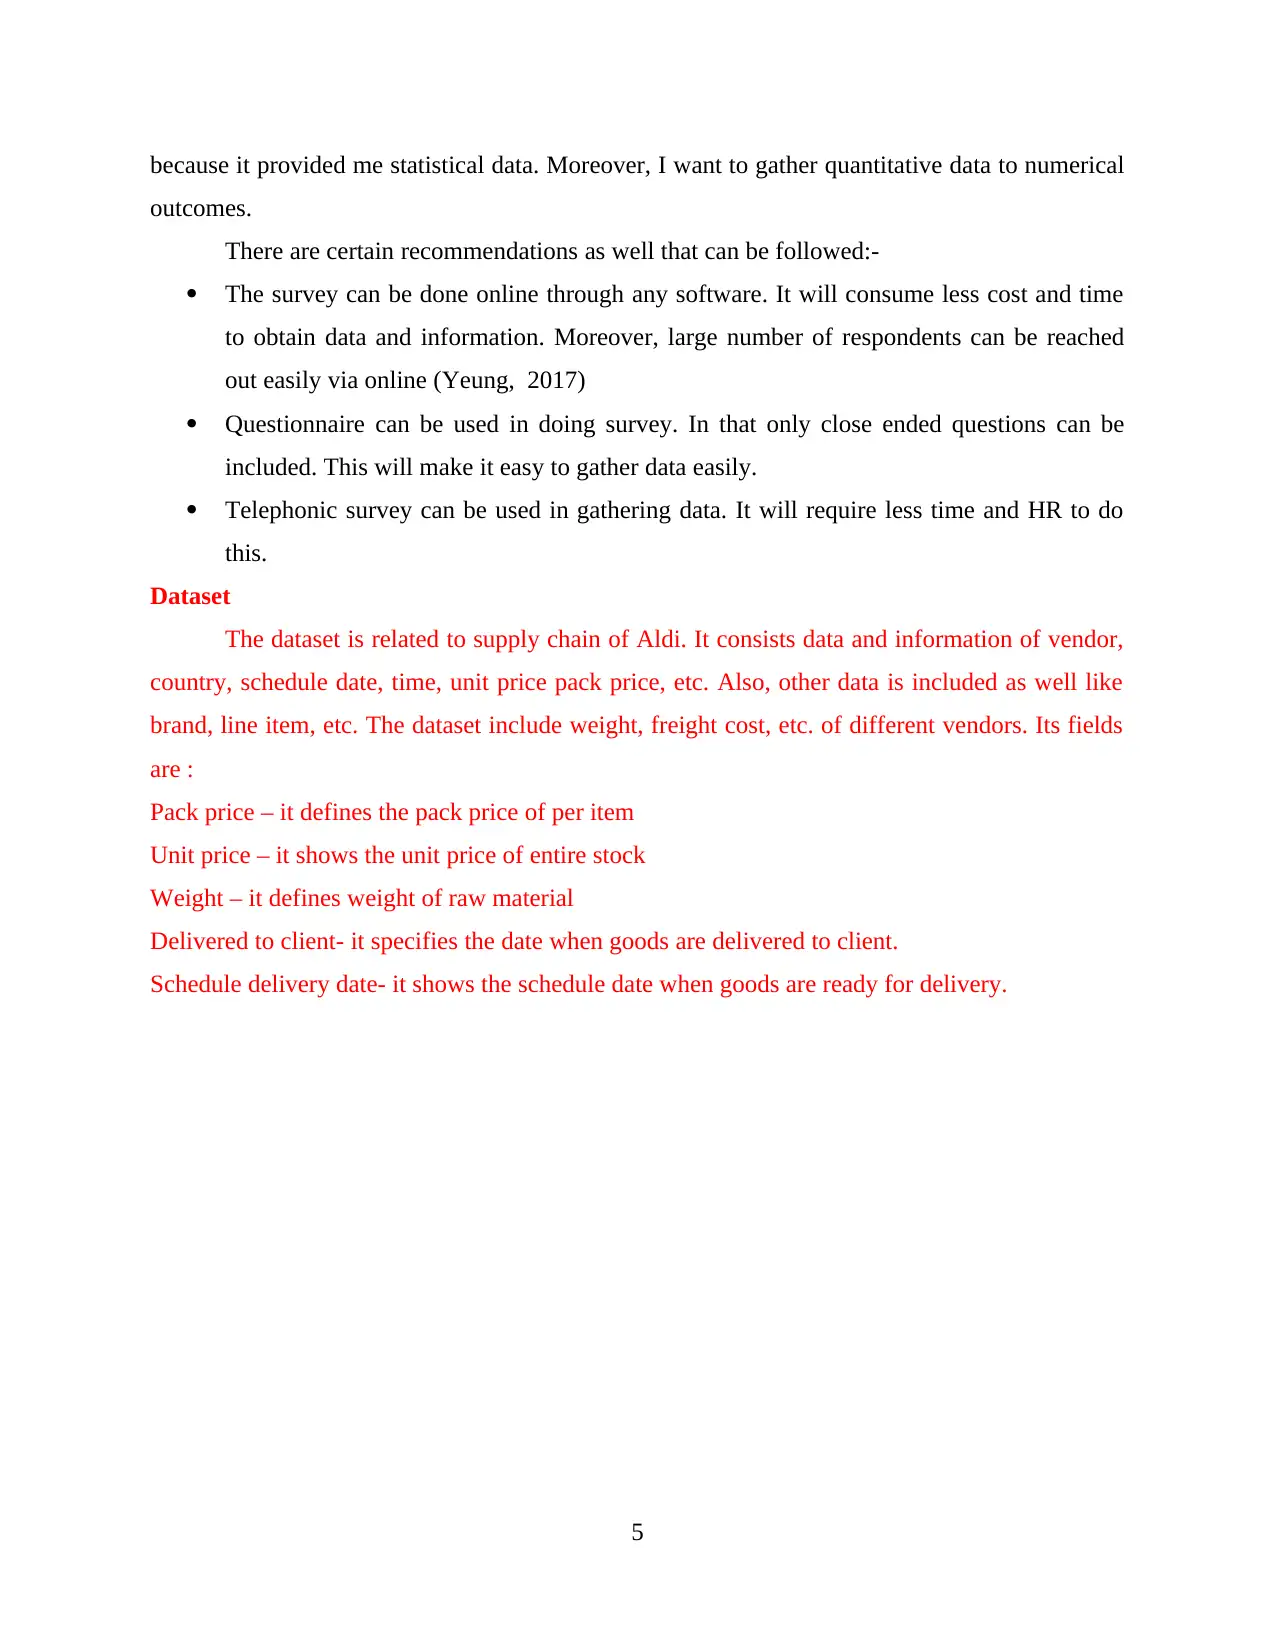
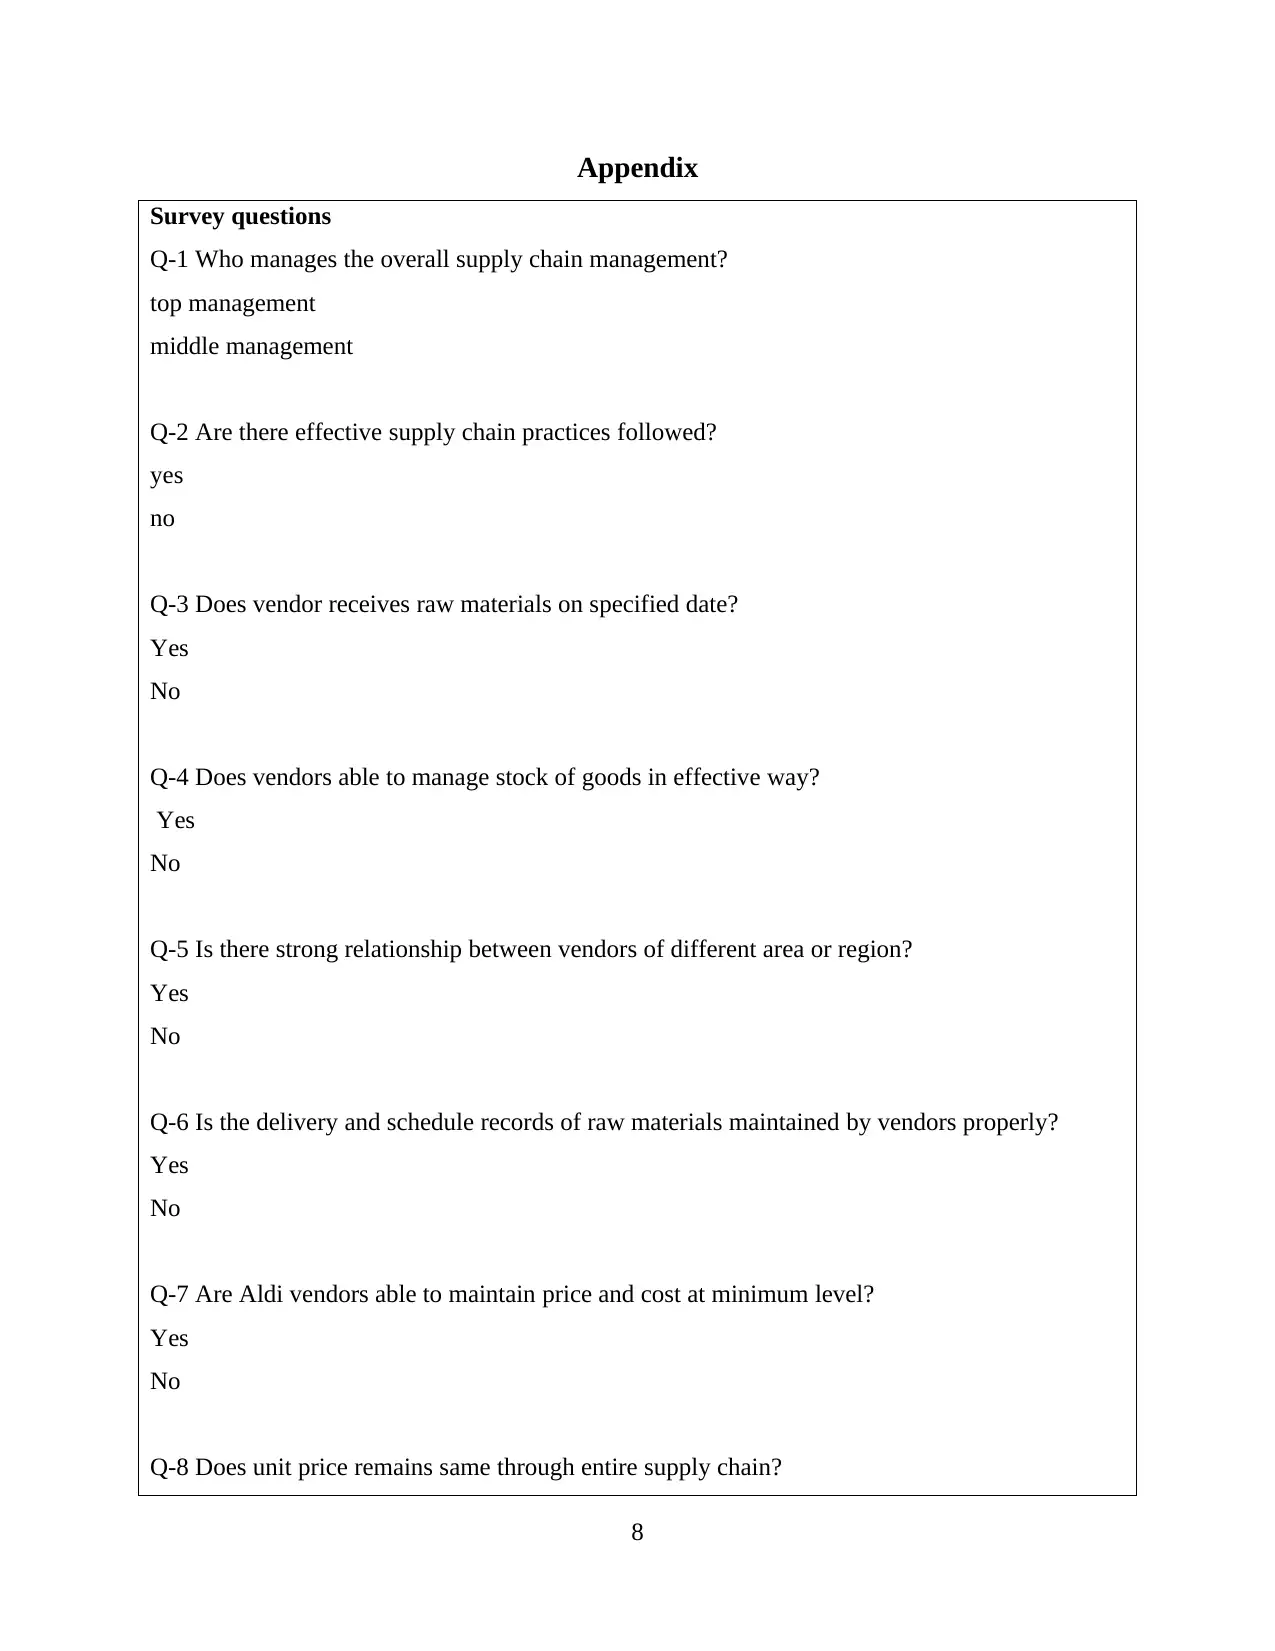
This report provides an overview of data design, focusing on data collection methods like surveys and interviews, and their respective strengths and weaknesses. It then applies these concepts to a real-world scenario involving Aldi's supply chain, detailing the types of data collected (pack price, unit price, weight, etc.) and the survey questions used to gather information from vendors. The analysis emphasizes the importance of data in supply chain management, particularly in optimizing costs and ensuring timely delivery. Recommendations include using online surveys and close-ended questionnaires for efficient data gathering. The report also touches upon the potential of technologies like RFID and blockchain in improving supply chain processes. Overall, the report aims to demonstrate how effective data design and analysis can lead to informed decision-making and process improvements within a supply chain context.
tabler-icon-diamond-filled.svg

Contribute Materials

Your contribution can guide someone’s learning journey. Share your documents today.
Document Page
Data Design- Part 1
1
tabler-icon-diamond-filled.svg

Secure Best Marks with AI Grader

Need help grading? Try our AI Grader for instant feedback on your assignments.
Document Page
Table of Contents
INTRODUCTION...........................................................................................................................3
REFERENCES................................................................................................................................6
Appendix..........................................................................................................................................7
2
Document Page
INTRODUCTION
Data design is a way of presenting data in proper way. The data is raw facts and figures that
is analysed to obtain relevant results. There are large data set which contain N number of raw
data (Boehner and DiSalvo, 2016). Also, data is designed according to type of survey conducted
or carried out. There are different ways in which data is collected or gathered. Basically, survey
and interview are ways of gathering data.
It is analysed that primary research can be conducted through various methods. It
depends on scholar willingness to choose a particular method. Also, it depends on nature and
type of research that what type of method is appropriate. However, the methods are survey,
interview, questionnaire, etc. A survey is conducted to collect large amount of data by asking
different questions. Basically, statistical data is collected from a target audience on specific topic.
moreover, survey can be in different ways as well like online, telephonic, face to face, etc. this
entirely depend on sample size and target people. but in recent times, technology has ease
process of conducting survey. Now e mails and many other websites are used to conduct survey.
Furthermore, the data gathered is in large quantity, so its analysis is done statistically. This
enabled in obtaining relevant results and information. For this there are some specialised
software as well such as SPSS, Minitab, etc. Additionally, in survey data can be filtered easily. It
is done to obtain only relevant data and eliminating other. But most important in survey method
is questions (Guerriero and et.al., 2016). The accuracy of outcomes depends on questions. The
questions asked in survey are close ended. Thus, it enables in obtaining precise data. (Pros and
cons of survey, 2018)
Strengths
They are cost effective as compared to other data collection methods
Through it, many types of data is gathered such as attitude, perception, etc.
Data is gathered from large number of participants.
Easy to administer as it is conducted online, e mail, telephonic, etc.
Weakness
They are time consuming as conducting survey is quite long procedure.
The respondents might not feel comfortable to provide answer of survey question
Answer given by respondents may not be accurate and honest.
Data error occur due to non response of answer to question.
3
Document Page
They have low validity rate due to close ended question
On contrary, interview is method of gathering qualitative data. It only includes certain
number of participants from which data is gathered. Usually, it is face to face method of data
collection. Here, scholar meet personally with target audience to collect data in depth. Moreover,
interview involve specific question that are asked (Kirk, 2016). There are various types of
interview that is structure, unstructured and semi structured. In this question asked can be either
close or open ended. So, it is difficult to evaluate data as the answers are not specifically given.
The interview can be conducted on focus groups as well but it is only limited to 10 – 20
individuals.
Strengths
The info is gathered in depth about the topic.
It is easy to conduct interview as it provides flexibility
Non verbal behaviour of respondent can be judged by researcher
Weakness
It is a costly method and time consuming.
The answer can be based on mood of candidate. It affects overall outcomes of research.
Questions asked are fixed which make it difficult to obtain data.
Supply chain plays a vital role in managing, storing, stock as well as inventory. It is an
integral part of business where all activities are interrelated to each other. The track records of
finished products and raw materials are kept to ensure they are delivered to vendors or suppliers
at right time. With help of supply chain, business is able to gain competitive advantage. Having a
better supply chain increases efficiency of business. If goods are delivered on time it helps in
generating customer value (Yandell, 2017). Moreover, entire operating cost depend on supply
chain.
As I am a supply chain specialist working in Aldi. My job role is to manage overall
logistics. Here, I do gather data regarding cost, country, arrival and departure date, etc. this
enables me to evaluate cost, profit, etc. in context to supply chain. In order to determine
strategies to reduce the cost of supply chain in organisation, I conducted a survey. Besides that,
via survey it will be easy for me to analyse how data is maintained by vendors. It is also suitable
for my job role. I can make some changes in supply chain by evaluating numeric data. This is
4
tabler-icon-diamond-filled.svg

Secure Best Marks with AI Grader

Need help grading? Try our AI Grader for instant feedback on your assignments.
Document Page
because it provided me statistical data. Moreover, I want to gather quantitative data to numerical
outcomes.
There are certain recommendations as well that can be followed:-
The survey can be done online through any software. It will consume less cost and time
to obtain data and information. Moreover, large number of respondents can be reached
out easily via online (Yeung, 2017)
Questionnaire can be used in doing survey. In that only close ended questions can be
included. This will make it easy to gather data easily.
Telephonic survey can be used in gathering data. It will require less time and HR to do
this.
Dataset
The dataset is related to supply chain of Aldi. It consists data and information of vendor,
country, schedule date, time, unit price pack price, etc. Also, other data is included as well like
brand, line item, etc. The dataset include weight, freight cost, etc. of different vendors. Its fields
are :
Pack price – it defines the pack price of per item
Unit price – it shows the unit price of entire stock
Weight – it defines weight of raw material
Delivered to client- it specifies the date when goods are delivered to client.
Schedule delivery date- it shows the schedule date when goods are ready for delivery.
5
Document Page
6
Document Page
REFERENCES
Books and journals
Boehner, K. and DiSalvo, C., 2016, May. Data, design and civics: An exploratory study of civic
tech. In Proceedings of the 2016 CHI Conference on Human Factors in Computing
Systems (pp. 2970-2981). ACM.
Guerriero, M. and et.al., 2016, May. Towards a model-driven design tool for big data
architectures. In Proceedings of the 2nd International Workshop on BIG Data Software
Engineering (pp. 37-43). ACM.
Kirk, A., 2016. Data visualisation: a handbook for data driven design. Sage.
Yandell, B., 2017. Practical data analysis for designed experiments. Routledge.
Yeung, K., 2017. ‘Hypernudge’: Big Data as a mode of regulation by design. Information,
Communication & Society. 20(1). pp.118-136.
Online
Pros and cons of survey, 2018. [online] Available through : <
https://www.snapsurveys.com/blog/advantages-disadvantages-surveys/>
7
tabler-icon-diamond-filled.svg

Paraphrase This Document

Need a fresh take? Get an instant paraphrase of this document with our AI Paraphraser
Document Page
Appendix
Survey questions
Q-1 Who manages the overall supply chain management?
top management
middle management
Q-2 Are there effective supply chain practices followed?
yes
no
Q-3 Does vendor receives raw materials on specified date?
Yes
No
Q-4 Does vendors able to manage stock of goods in effective way?
Yes
No
Q-5 Is there strong relationship between vendors of different area or region?
Yes
No
Q-6 Is the delivery and schedule records of raw materials maintained by vendors properly?
Yes
No
Q-7 Are Aldi vendors able to maintain price and cost at minimum level?
Yes
No
Q-8 Does unit price remains same through entire supply chain?
8
Document Page
Yes
No
Q-9 What are key attributes in supply chain of Aldi?
Cost
Quality
Speed of delivery
Q-10 Is RFID technology used by suppliers to manage activities?
Yes
No
Q-11 Blockchain technology will be useful in reducing cost?
Yes
No
9
chevron_up_icon
1 out of 9
circle_padding
hide_on_mobile
zoom_out_icon
logo.png

Your All-in-One AI-Powered Toolkit for Academic Success.

Available 24*7 on WhatsApp / Email

[object Object]