Data-Driven Marketing Report: Voucher Campaign Performance Analysis
VerifiedAdded on 2023/03/20
|17
|2666
|98
Report
AI Summary
This report analyzes the marketing performance of a multinational supermarket chain's toy voucher campaign. The analysis focuses on a dataset containing customer information and their responses to the voucher. The report begins with an introduction differentiating between data and information, followed by an analysis of the campaign's overall response rate, investment, and ROI. It uses SPSS to analyze variables such as gender, email provision, loyalty status, geographical region, and region. The report then develops a predictive model using logistic regression to determine customer types with a higher probability of response, identifying statistically significant variables. The report also includes a classification table (confusion matrix) to evaluate the model's performance. The report then provides recommendations on customer selection for future campaigns and suggests transitioning from postal mail to email for marketing communications, highlighting the advantages of email marketing such as speed and cost-effectiveness. The report concludes by emphasizing the influence of multiple factors on customer responses.
Data-Driven Marketing
Module Title: Data-Driven Marketing
MANG6230
Student ID: 30531721
Word Count:
Submission Date:
Module Title: Data-Driven Marketing
MANG6230
Student ID: 30531721
Word Count:
Submission Date:
Paraphrase This Document
Need a fresh take? Get an instant paraphrase of this document with our AI Paraphraser
1
Table of Contents
Introduction......................................................................................................................................2
Marketing Performance of the Primary Campaign .........................................................................3
Consideration of Customers from the Higher Probability Response ..............................................6
Selection Method of 2,000 Customers ..........................................................................................12
Take on Email use for product Campaign.....................................................................................12
Conclusion …………………………………………………………………………………………………………………………………………….13
References……………………………………………………………………………………………………………………………….14
Appendix……………………………………………………………………………………………………………………………………………….15
2
Introduction
It would be very important to differentiate the meaning of data and information. Data is raw facts
collected about a study variable or study variables and has not yet been processed and therefore
needs analysis to be understood (De Mauro, Greco and Grimaldi, 2016). Information, on the
other hand, processes or analyzed data to put forth an informed idea (Althubaiti, 2016). Each
every business that looks at improving the profits that it makes, must, by all means, knows how
to handle data and information that is related to its customers.
In this report, I as the multinational supermarket chain marketing analyst, have been mandated
by my manager to do analysis on a vouchers dataset that was sent to customers in a bit of testing
the response rate to the supermarket's toys commodity. The reasons for this analysis is to assist
determine a new reasonable plot for marketing communication that could be used.
⊘ This is a preview!⊘
Do you want full access?
Subscribe today to unlock all pages.
Trusted by 1+ million students worldwide
3
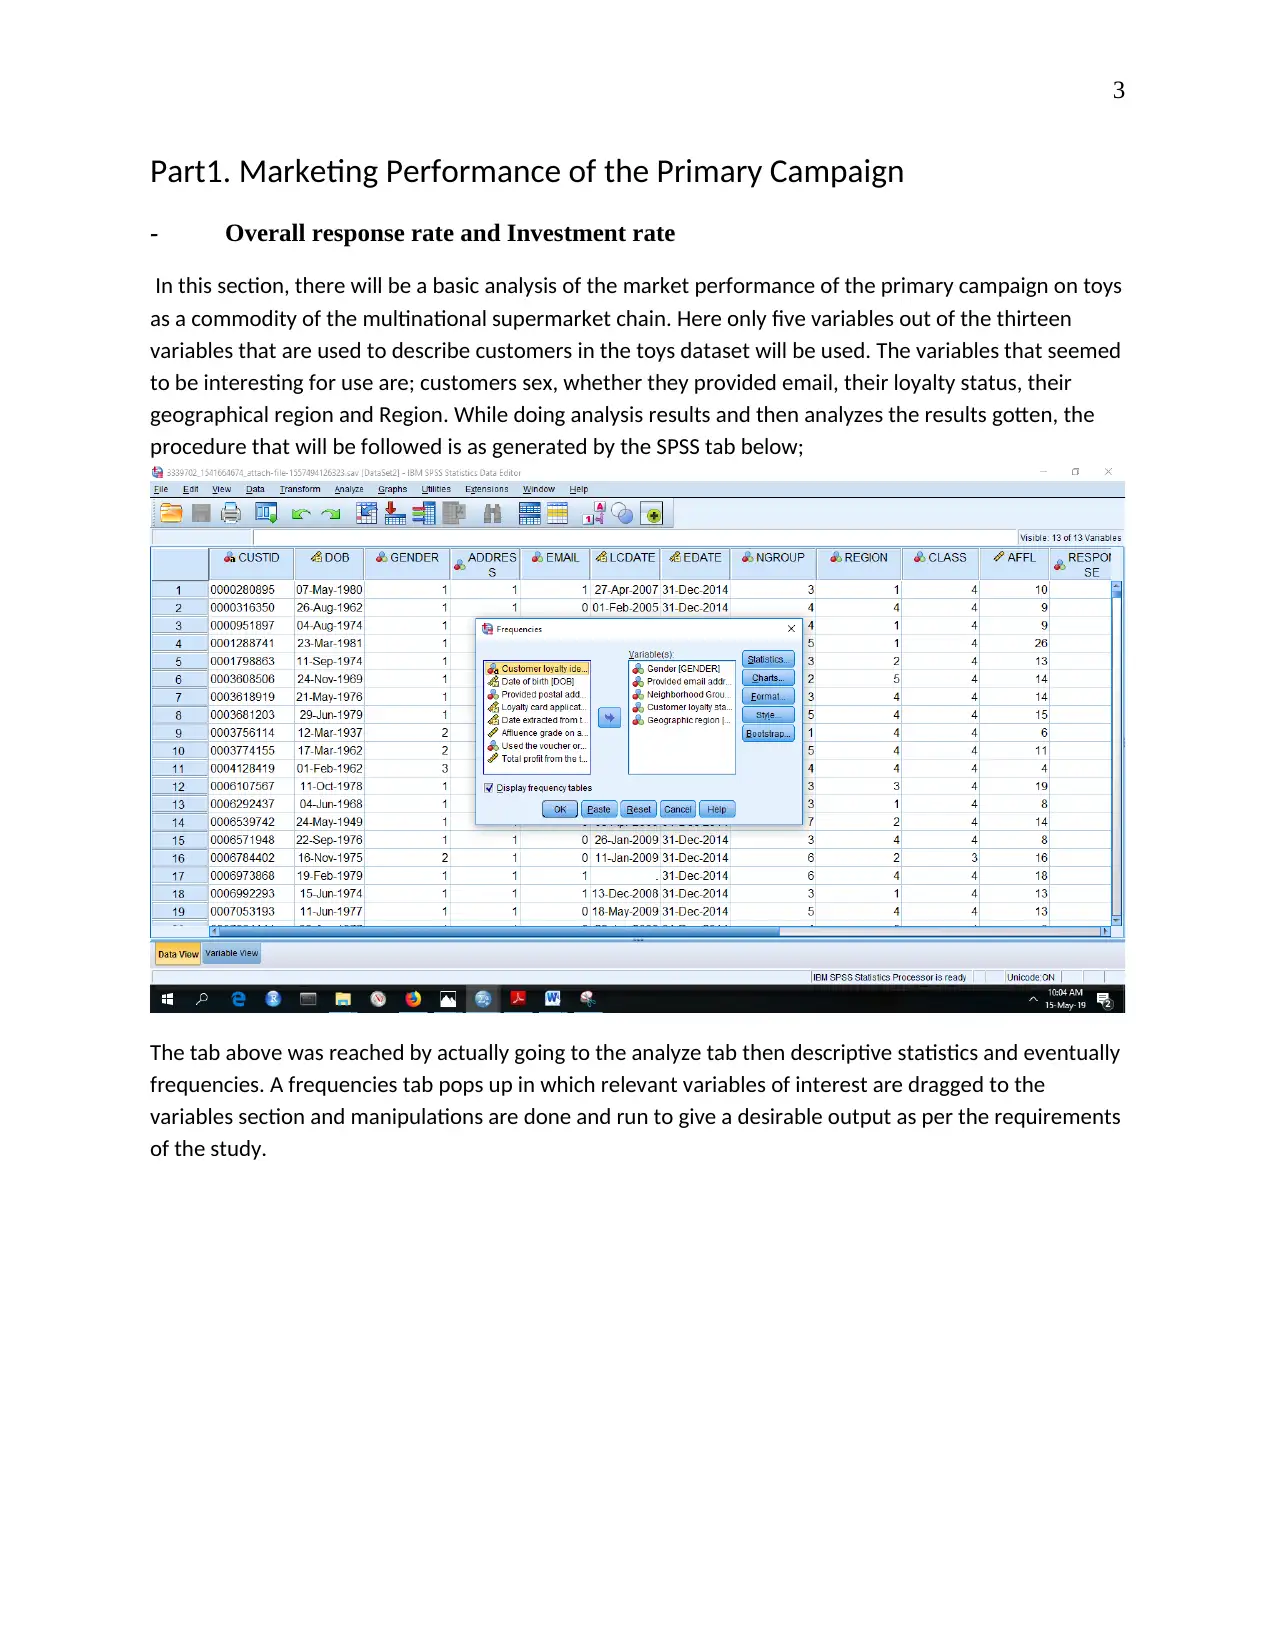
Part1. Marketing Performance of the Primary Campaign
- Overall response rate and Investment rate
In this section, there will be a basic analysis of the market performance of the primary campaign on toys
as a commodity of the multinational supermarket chain. Here only five variables out of the thirteen
variables that are used to describe customers in the toys dataset will be used. The variables that seemed
to be interesting for use are; customers sex, whether they provided email, their loyalty status, their
geographical region and Region. While doing analysis results and then analyzes the results gotten, the
procedure that will be followed is as generated by the SPSS tab below;
The tab above was reached by actually going to the analyze tab then descriptive statistics and eventually
frequencies. A frequencies tab pops up in which relevant variables of interest are dragged to the
variables section and manipulations are done and run to give a desirable output as per the requirements
of the study.
Paraphrase This Document
Need a fresh take? Get an instant paraphrase of this document with our AI Paraphraser
4
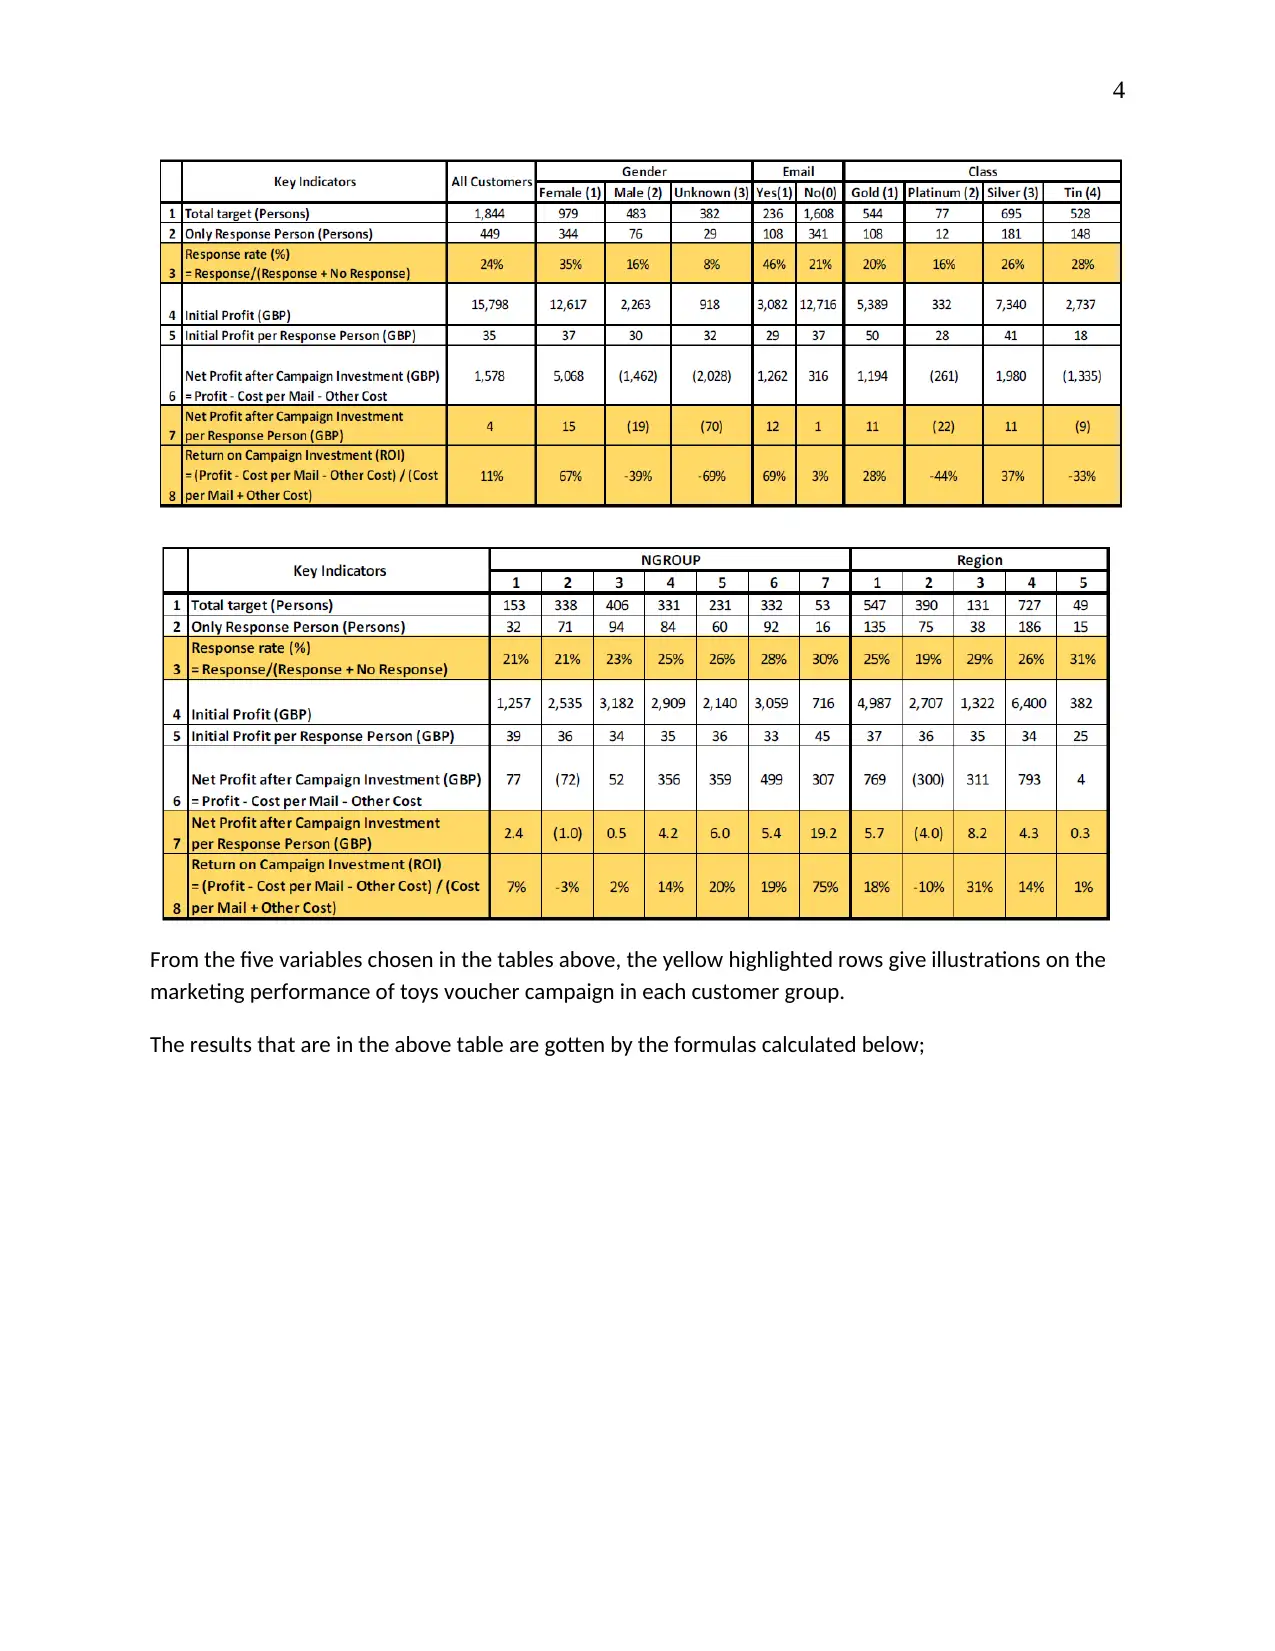
From the five variables chosen in the tables above, the yellow highlighted rows give illustrations on the
marketing performance of toys voucher campaign in each customer group.
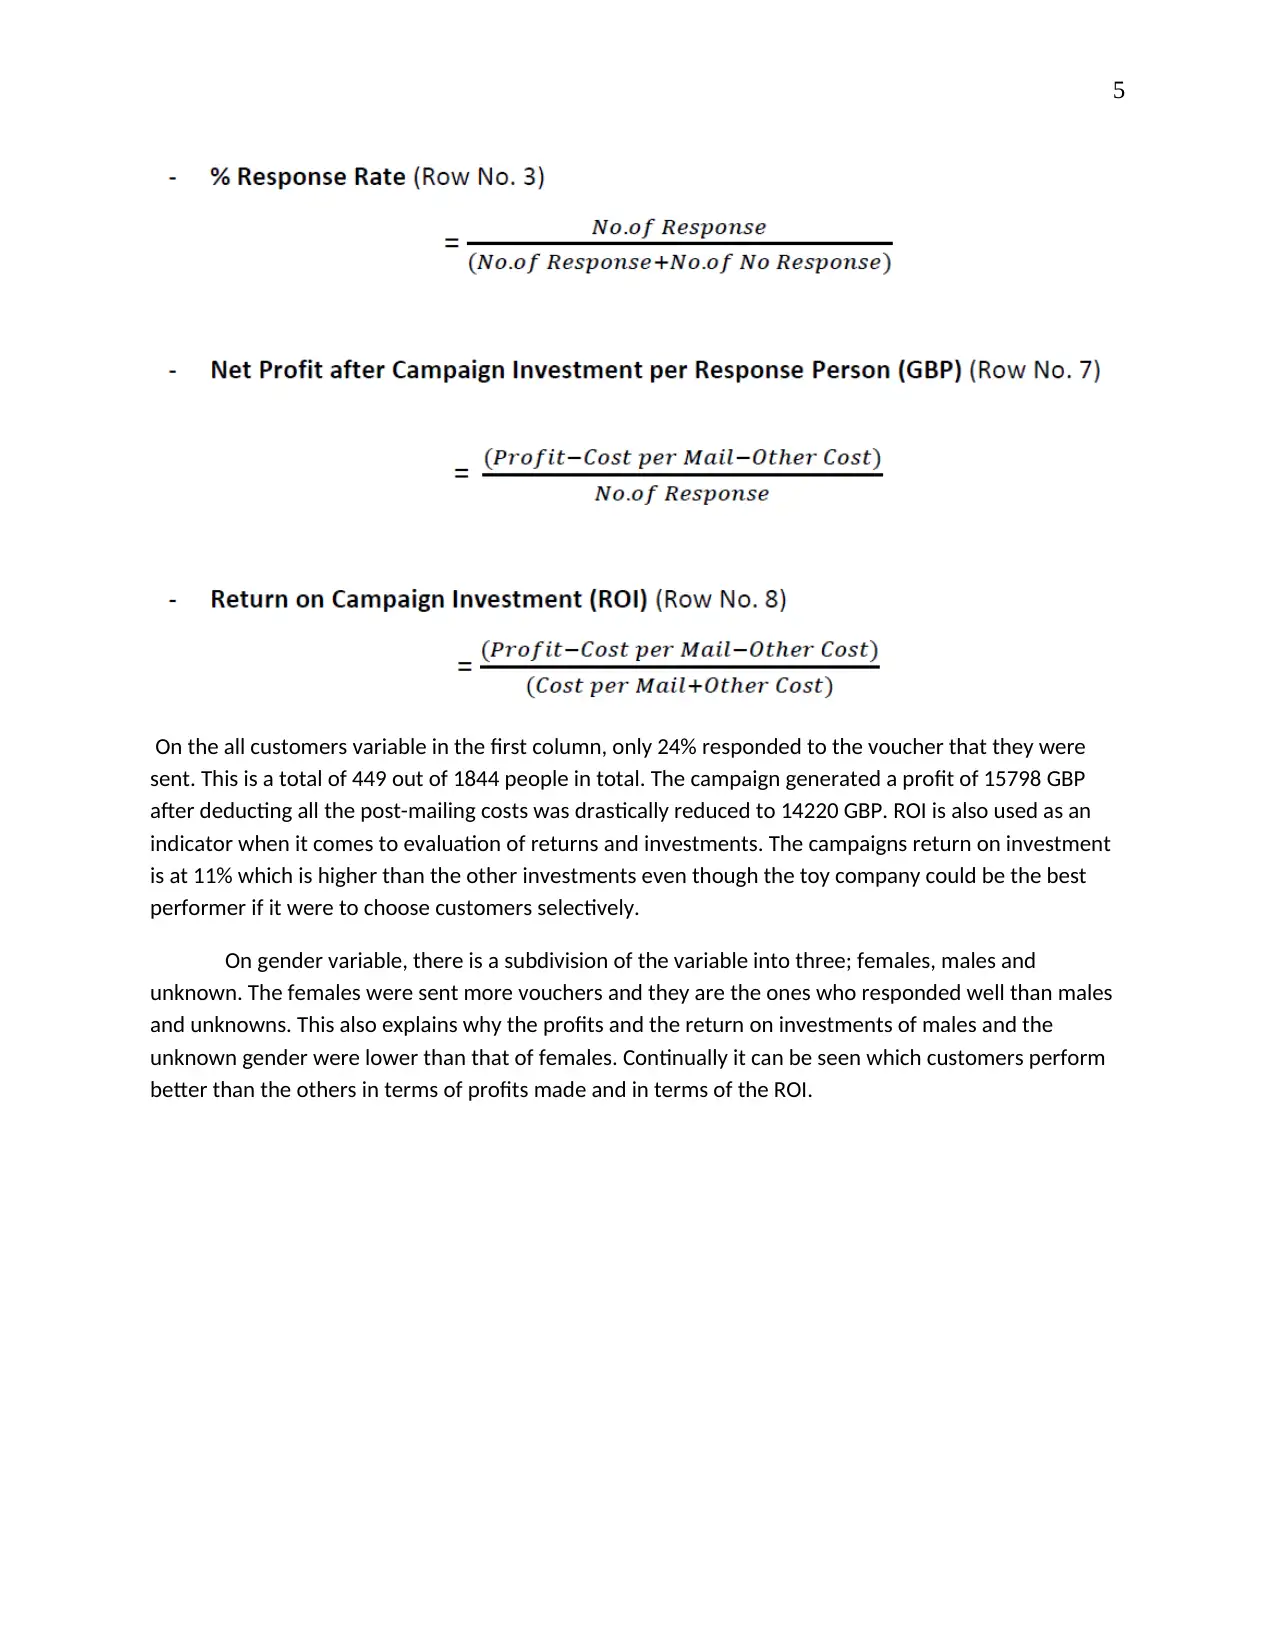
The results that are in the above table are gotten by the formulas calculated below;
From the five variables chosen in the tables above, the yellow highlighted rows give illustrations on the
marketing performance of toys voucher campaign in each customer group.
The results that are in the above table are gotten by the formulas calculated below;
5
On the all customers variable in the first column, only 24% responded to the voucher that they were
sent. This is a total of 449 out of 1844 people in total. The campaign generated a profit of 15798 GBP
after deducting all the post-mailing costs was drastically reduced to 14220 GBP. ROI is also used as an
indicator when it comes to evaluation of returns and investments. The campaigns return on investment
is at 11% which is higher than the other investments even though the toy company could be the best
performer if it were to choose customers selectively.
On gender variable, there is a subdivision of the variable into three; females, males and
unknown. The females were sent more vouchers and they are the ones who responded well than males
and unknowns. This also explains why the profits and the return on investments of males and the
unknown gender were lower than that of females. Continually it can be seen which customers perform
better than the others in terms of profits made and in terms of the ROI.
⊘ This is a preview!⊘
Do you want full access?
Subscribe today to unlock all pages.
Trusted by 1+ million students worldwide
6
2. Consideration of Customers from the Higher Probability Response
In this case development of a descriptive model is needed to elaborately explain the actual
probability response among other statistical illustrations.
Step 1
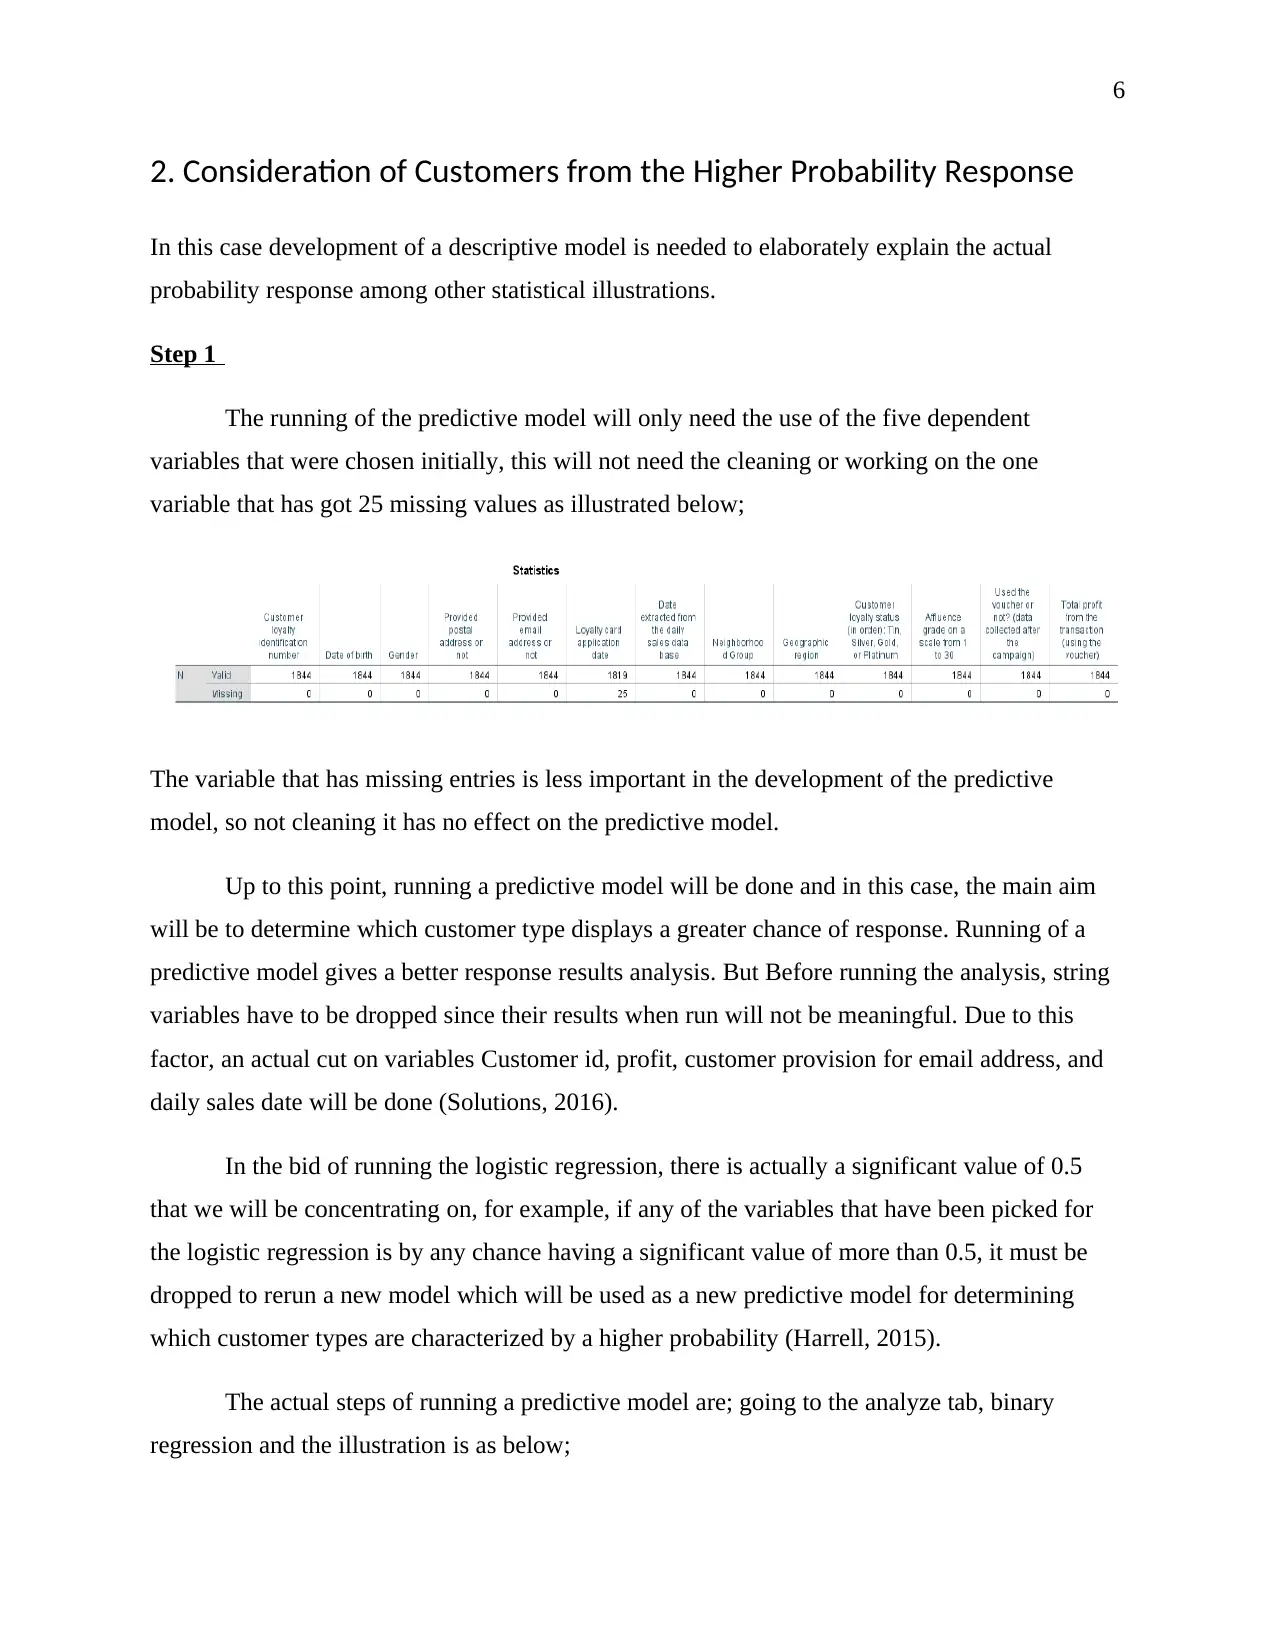
The running of the predictive model will only need the use of the five dependent
variables that were chosen initially, this will not need the cleaning or working on the one
variable that has got 25 missing values as illustrated below;
The variable that has missing entries is less important in the development of the predictive
model, so not cleaning it has no effect on the predictive model.
Up to this point, running a predictive model will be done and in this case, the main aim
will be to determine which customer type displays a greater chance of response. Running of a
predictive model gives a better response results analysis. But Before running the analysis, string
variables have to be dropped since their results when run will not be meaningful. Due to this
factor, an actual cut on variables Customer id, profit, customer provision for email address, and
daily sales date will be done (Solutions, 2016).
In the bid of running the logistic regression, there is actually a significant value of 0.5
that we will be concentrating on, for example, if any of the variables that have been picked for
the logistic regression is by any chance having a significant value of more than 0.5, it must be
dropped to rerun a new model which will be used as a new predictive model for determining
which customer types are characterized by a higher probability (Harrell, 2015).
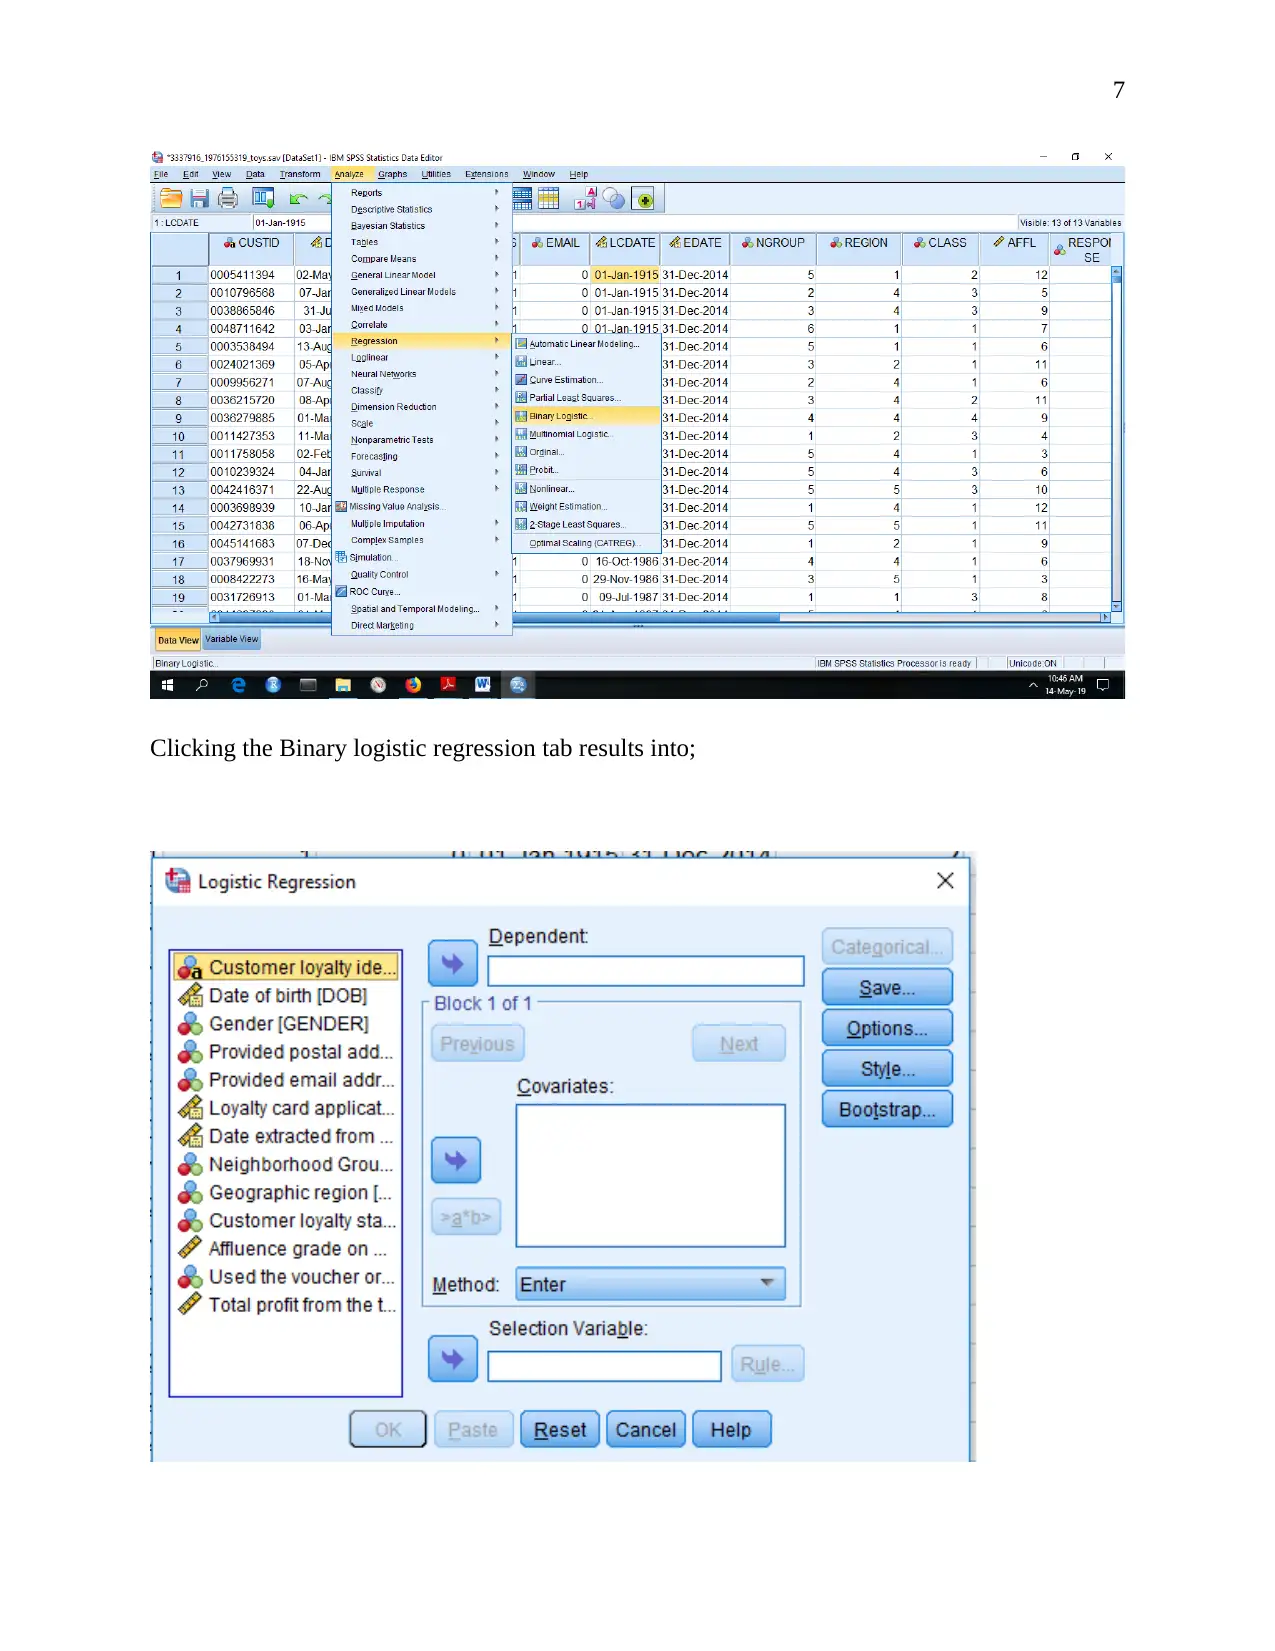
The actual steps of running a predictive model are; going to the analyze tab, binary
regression and the illustration is as below;
2. Consideration of Customers from the Higher Probability Response
In this case development of a descriptive model is needed to elaborately explain the actual
probability response among other statistical illustrations.
Step 1
The running of the predictive model will only need the use of the five dependent
variables that were chosen initially, this will not need the cleaning or working on the one
variable that has got 25 missing values as illustrated below;
The variable that has missing entries is less important in the development of the predictive
model, so not cleaning it has no effect on the predictive model.
Up to this point, running a predictive model will be done and in this case, the main aim
will be to determine which customer type displays a greater chance of response. Running of a
predictive model gives a better response results analysis. But Before running the analysis, string
variables have to be dropped since their results when run will not be meaningful. Due to this
factor, an actual cut on variables Customer id, profit, customer provision for email address, and
daily sales date will be done (Solutions, 2016).
In the bid of running the logistic regression, there is actually a significant value of 0.5
that we will be concentrating on, for example, if any of the variables that have been picked for
the logistic regression is by any chance having a significant value of more than 0.5, it must be
dropped to rerun a new model which will be used as a new predictive model for determining
which customer types are characterized by a higher probability (Harrell, 2015).
The actual steps of running a predictive model are; going to the analyze tab, binary
regression and the illustration is as below;
Paraphrase This Document
Need a fresh take? Get an instant paraphrase of this document with our AI Paraphraser
7
Clicking the Binary logistic regression tab results into;
Clicking the Binary logistic regression tab results into;
8
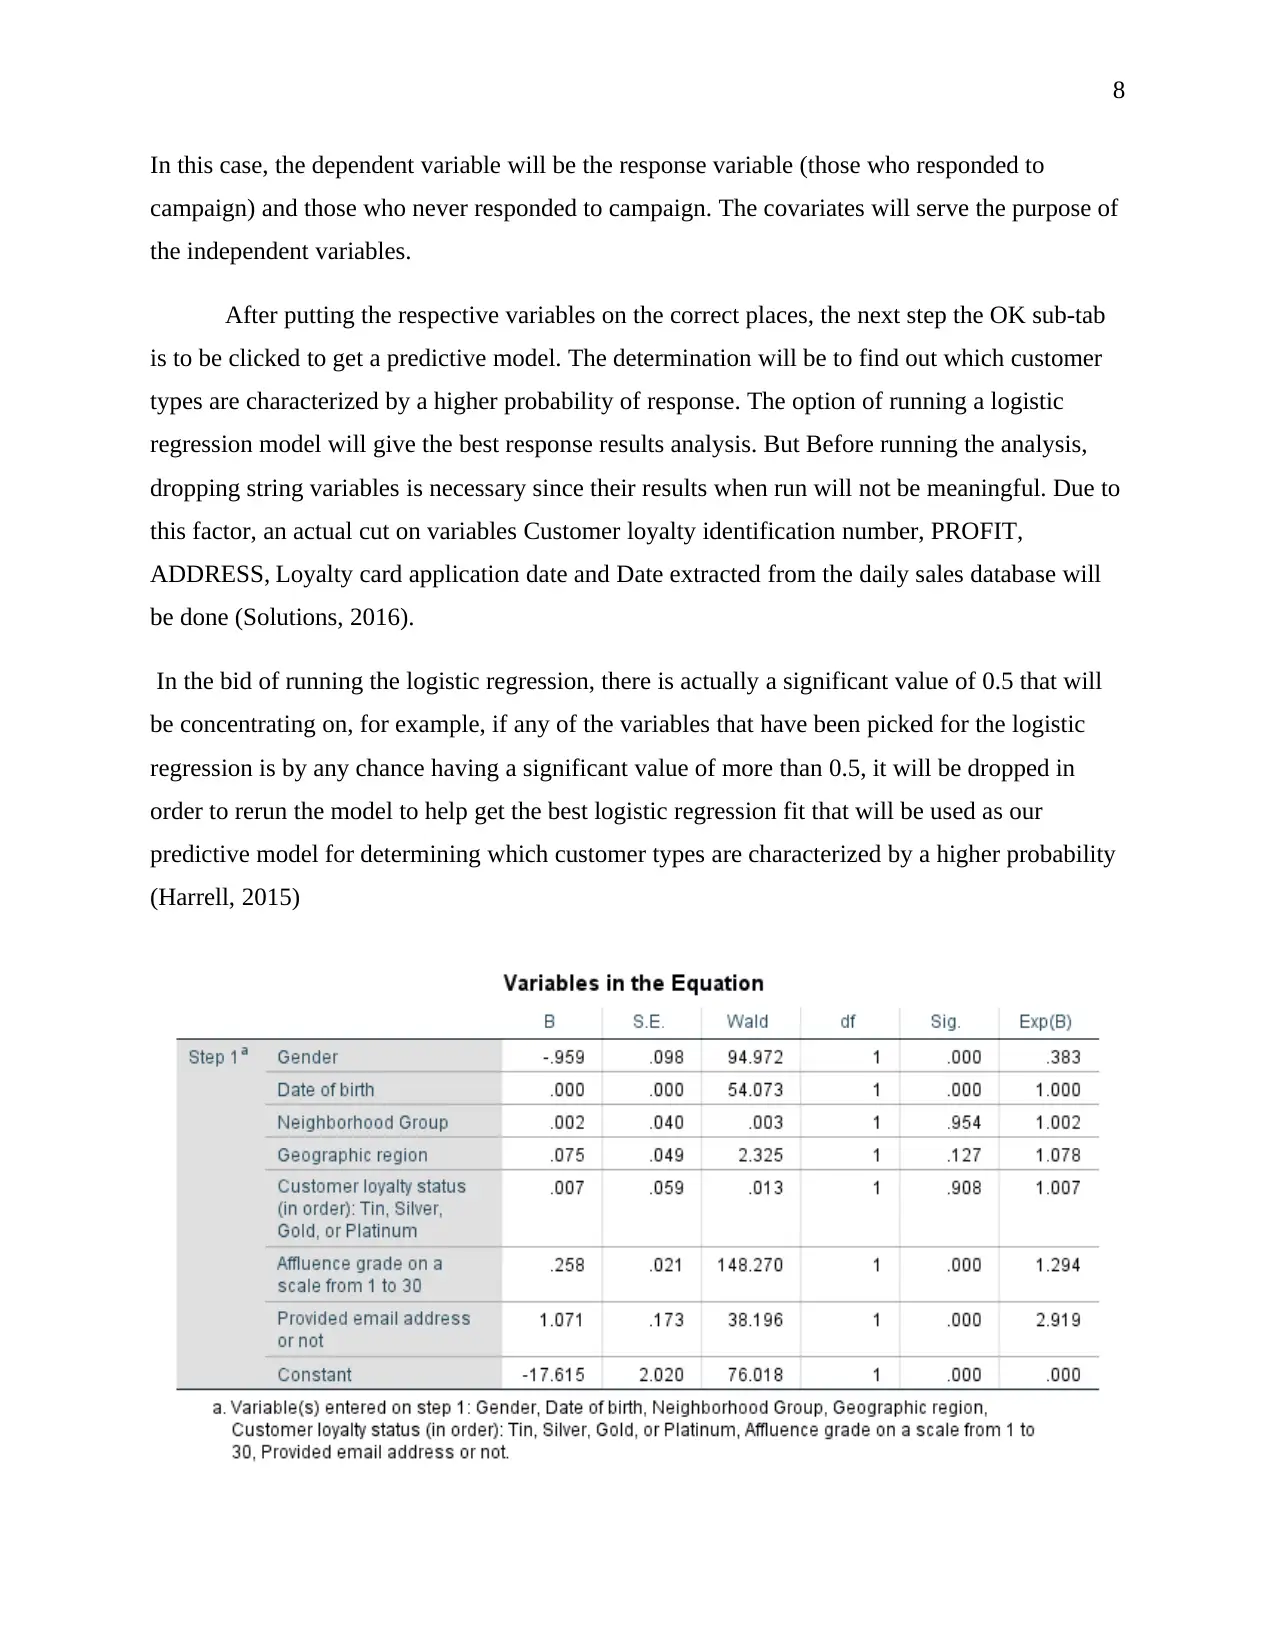
In this case, the dependent variable will be the response variable (those who responded to
campaign) and those who never responded to campaign. The covariates will serve the purpose of
the independent variables.
After putting the respective variables on the correct places, the next step the OK sub-tab
is to be clicked to get a predictive model. The determination will be to find out which customer
types are characterized by a higher probability of response. The option of running a logistic
regression model will give the best response results analysis. But Before running the analysis,
dropping string variables is necessary since their results when run will not be meaningful. Due to
this factor, an actual cut on variables Customer loyalty identification number, PROFIT,
ADDRESS, Loyalty card application date and Date extracted from the daily sales database will
be done (Solutions, 2016).
In the bid of running the logistic regression, there is actually a significant value of 0.5 that will
be concentrating on, for example, if any of the variables that have been picked for the logistic
regression is by any chance having a significant value of more than 0.5, it will be dropped in
order to rerun the model to help get the best logistic regression fit that will be used as our
predictive model for determining which customer types are characterized by a higher probability
(Harrell, 2015)
⊘ This is a preview!⊘
Do you want full access?
Subscribe today to unlock all pages.
Trusted by 1+ million students worldwide
9
Figure 5
This above shows us how two of the significant values corresponding to variables
neighbourhood group and customer loyalty status are more than 0.5 values. This prompts the
dropping of the duo so that there can be the ability to run the model with more statistically
significant variables.
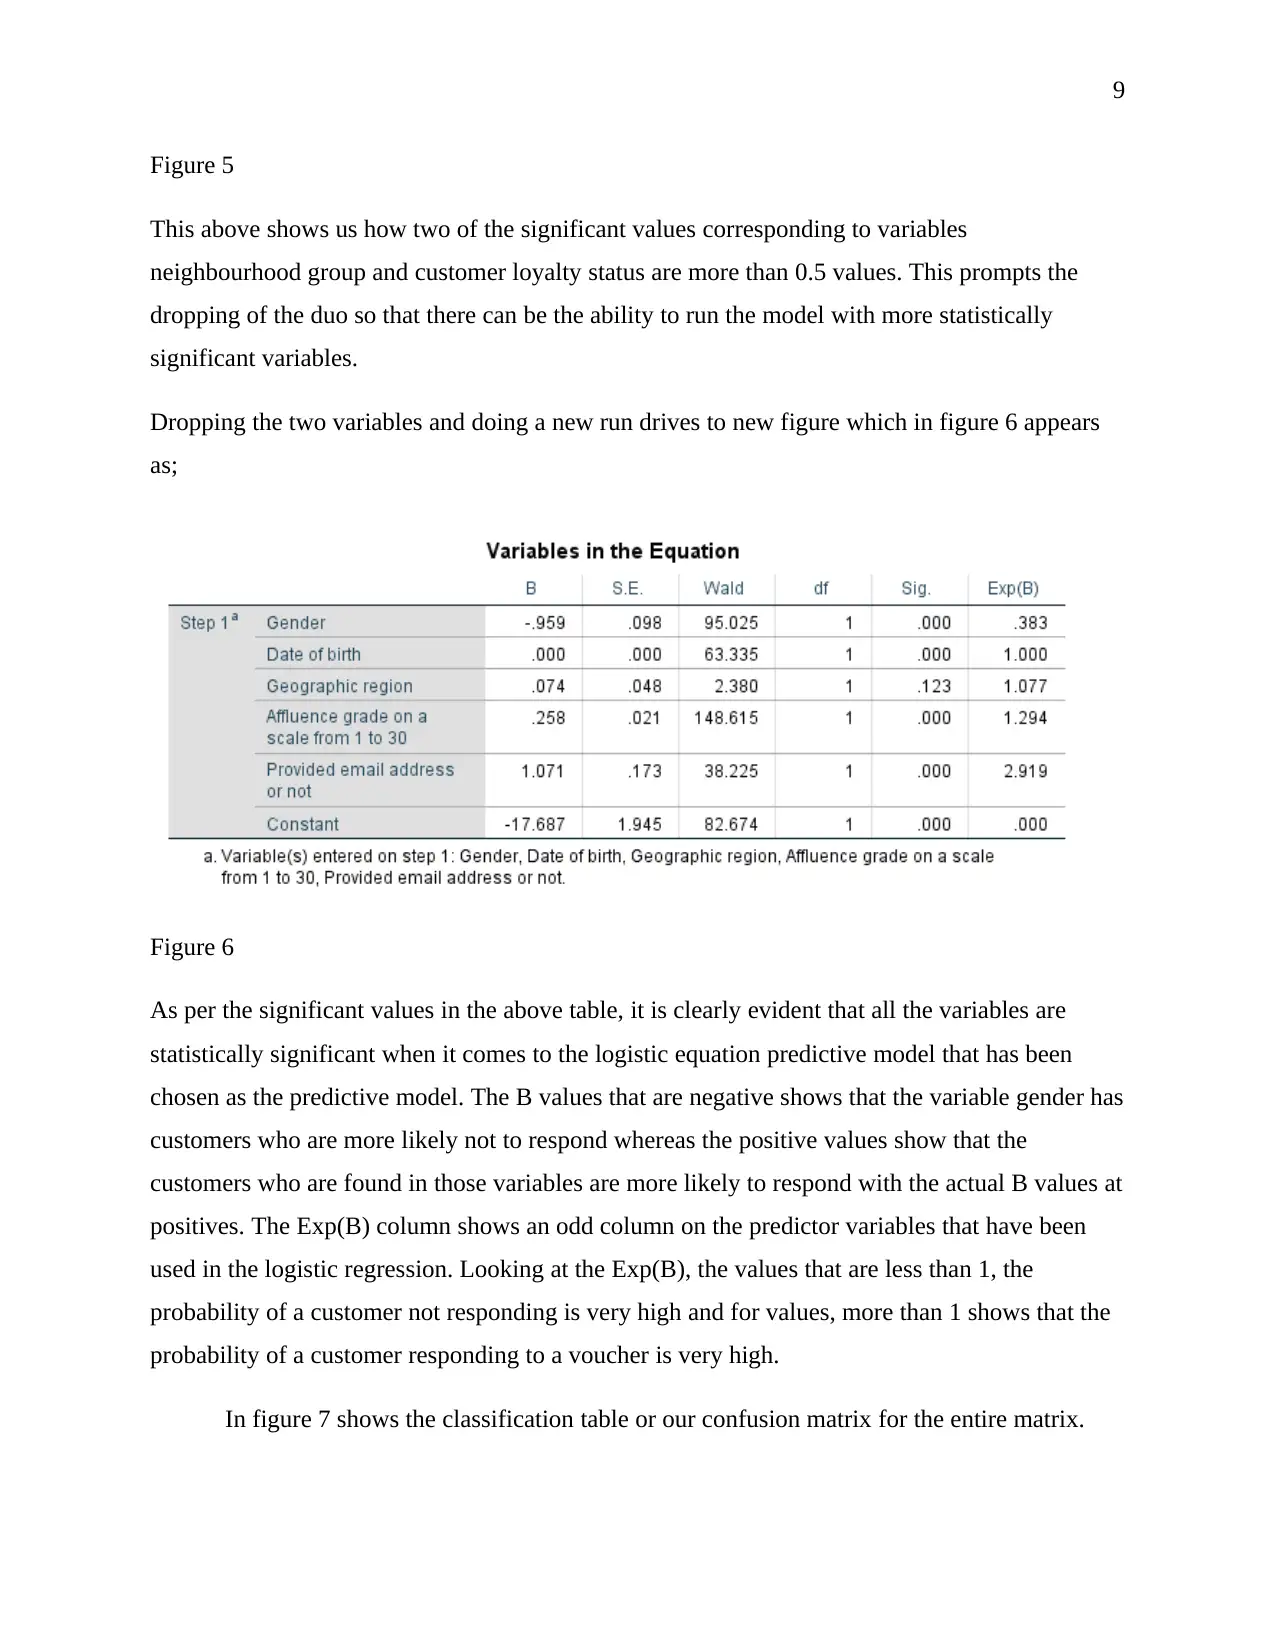
Dropping the two variables and doing a new run drives to new figure which in figure 6 appears
as;
Figure 6
As per the significant values in the above table, it is clearly evident that all the variables are
statistically significant when it comes to the logistic equation predictive model that has been
chosen as the predictive model. The B values that are negative shows that the variable gender has
customers who are more likely not to respond whereas the positive values show that the
customers who are found in those variables are more likely to respond with the actual B values at
positives. The Exp(B) column shows an odd column on the predictor variables that have been
used in the logistic regression. Looking at the Exp(B), the values that are less than 1, the
probability of a customer not responding is very high and for values, more than 1 shows that the
probability of a customer responding to a voucher is very high.
In figure 7 shows the classification table or our confusion matrix for the entire matrix.
Figure 5
This above shows us how two of the significant values corresponding to variables
neighbourhood group and customer loyalty status are more than 0.5 values. This prompts the
dropping of the duo so that there can be the ability to run the model with more statistically
significant variables.
Dropping the two variables and doing a new run drives to new figure which in figure 6 appears
as;
Figure 6
As per the significant values in the above table, it is clearly evident that all the variables are
statistically significant when it comes to the logistic equation predictive model that has been
chosen as the predictive model. The B values that are negative shows that the variable gender has
customers who are more likely not to respond whereas the positive values show that the
customers who are found in those variables are more likely to respond with the actual B values at
positives. The Exp(B) column shows an odd column on the predictor variables that have been
used in the logistic regression. Looking at the Exp(B), the values that are less than 1, the
probability of a customer not responding is very high and for values, more than 1 shows that the
probability of a customer responding to a voucher is very high.
In figure 7 shows the classification table or our confusion matrix for the entire matrix.
Paraphrase This Document
Need a fresh take? Get an instant paraphrase of this document with our AI Paraphraser
10
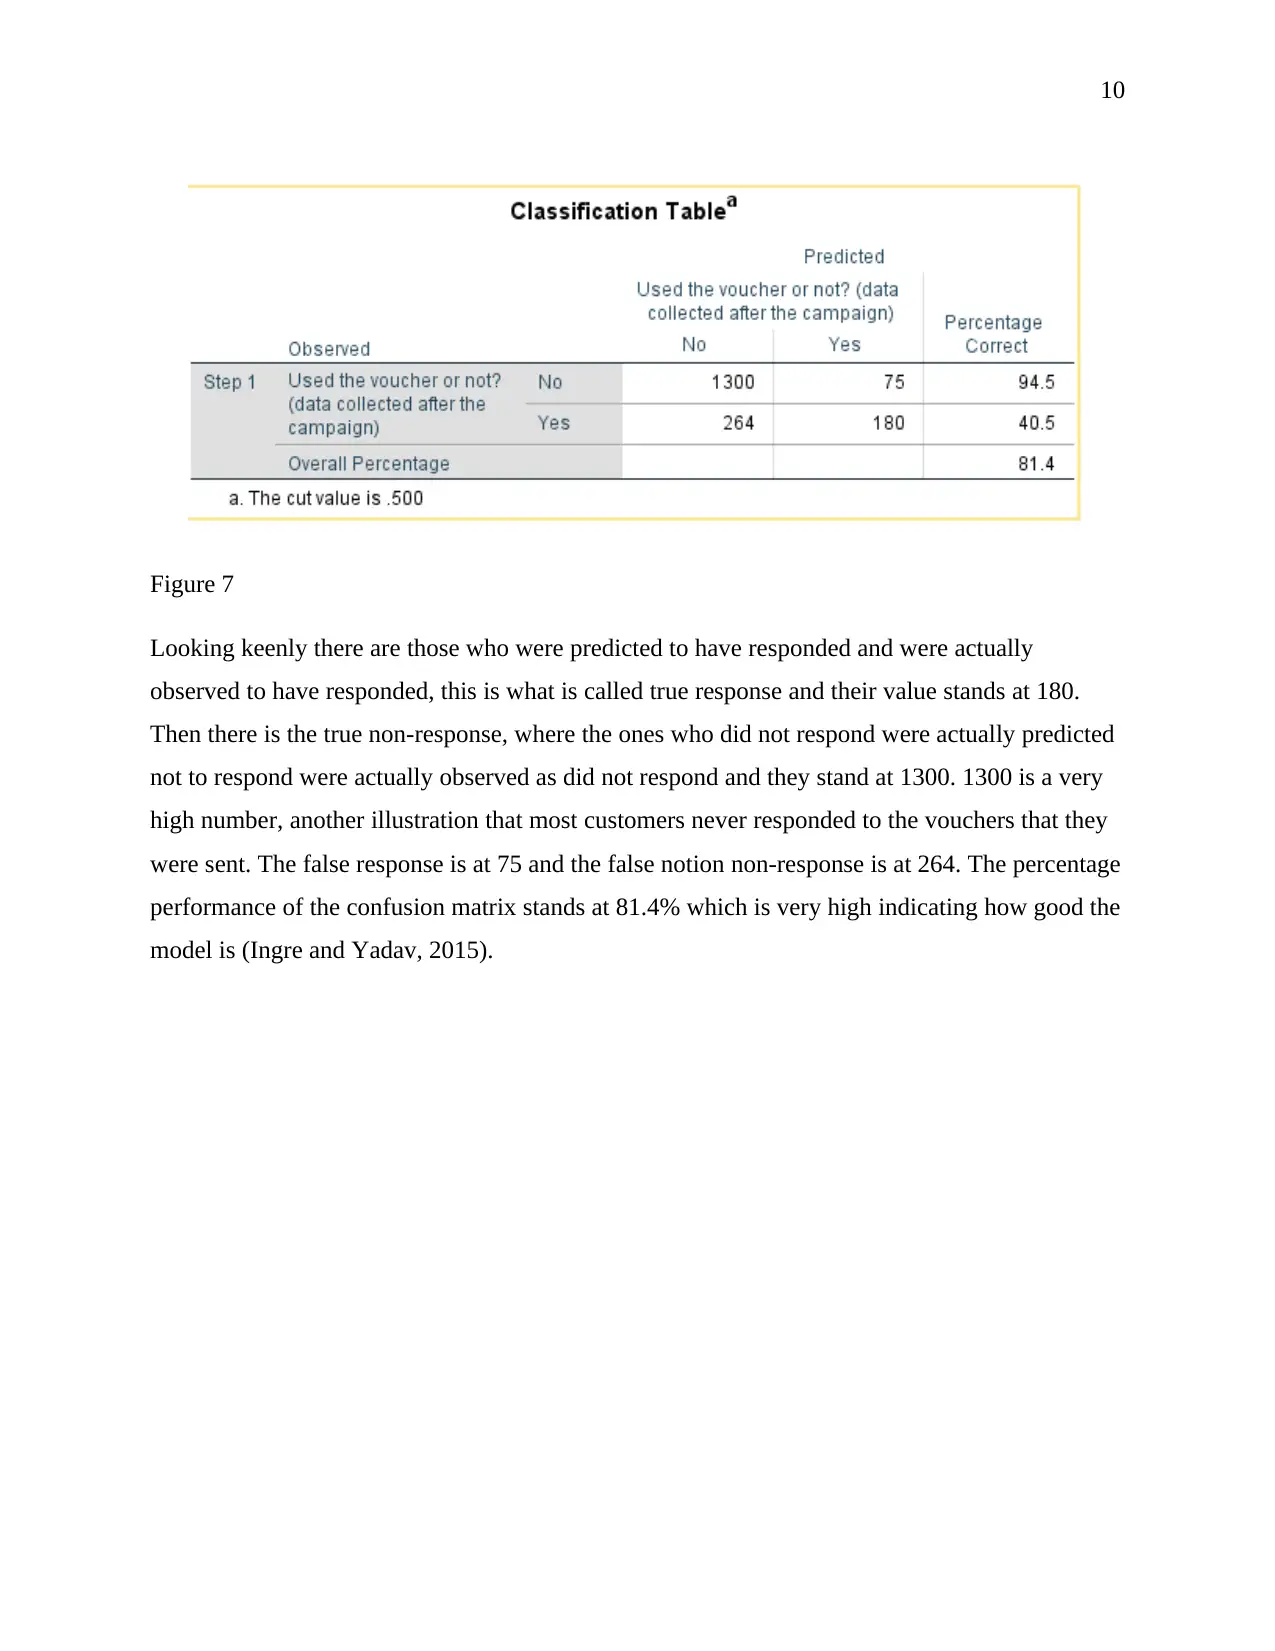
Figure 7
Looking keenly there are those who were predicted to have responded and were actually
observed to have responded, this is what is called true response and their value stands at 180.
Then there is the true non-response, where the ones who did not respond were actually predicted
not to respond were actually observed as did not respond and they stand at 1300. 1300 is a very
high number, another illustration that most customers never responded to the vouchers that they
were sent. The false response is at 75 and the false notion non-response is at 264. The percentage
performance of the confusion matrix stands at 81.4% which is very high indicating how good the
model is (Ingre and Yadav, 2015).
11
Selection Method of 2,000 Customers
Of the entire variables that have been provided for use in choosing the 2000 customers
with whom the vouchers were to be sent, I would only choose using a customer's loyalty status.
A more loyal customer deserves a more befitting reward because with them we are assured of a
continuous purchase and therefore more profits and more turn over. Giving such a customer a
voucher assures us of the success of the campaign.
Replacing the Postal Campaign with Recommendations
Most customers as per the data of email provision prefer being communicated to via the
post. This is what customers have been used to. If the supermarket wants to shift from using post
then it should not do so completely, rather it should keep using the post as it welcomes or creates
awareness to its customers that it would like using emails for creation of campaigns. This then
would enable customers gradually shift from the use of post and adapt the use of emails, without
lots of discomforts as opposed to when they are rushed by the supermarket to once chance from
the use of post into the actual use of email.
Strong recommendations that would be given to the supermarket would be the
supermarket should embrace the use of emails and not post in the creation of campaigns and in
product promotions. There are strong reasons for this and they are; email usage is a very first
means of communication. Take for instance an individual with a smartphone, something that is
more of a norm than a despise, an individual can easily tap on the email or Gmail app that
they've got on their phones and easily read emails unlike when an individual uses to post. Post
mail communications take time because the actual days for a post email to be delivered are three
days in the least. If there were two companies and both were doing campaigns or creating
awareness on a product and one was using emails to communicate and the other was using post
mails to communicate, then be rest assured that the one which uses emails will reach intended
customers faster as opposed to the one using post mails. This is as a factor of change in time,
people have shied away from the post and they have embraced phone and social media
⊘ This is a preview!⊘
Do you want full access?
Subscribe today to unlock all pages.
Trusted by 1+ million students worldwide
1 out of 17


Your All-in-One AI-Powered Toolkit for Academic Success.
+13062052269
info@desklib.com
Available 24*7 on WhatsApp / Email
![[object Object]](/_next/static/media/star-bottom.7253800d.svg)
Unlock your academic potential
Copyright © 2020–2026 A2Z Services. All Rights Reserved. Developed and managed by ZUCOL.