Business Intelligence Report: Data-Driven Decision Making Analysis

Verified

Added on  2023/06/10

|12
|1410
|180
Report
AI Summary
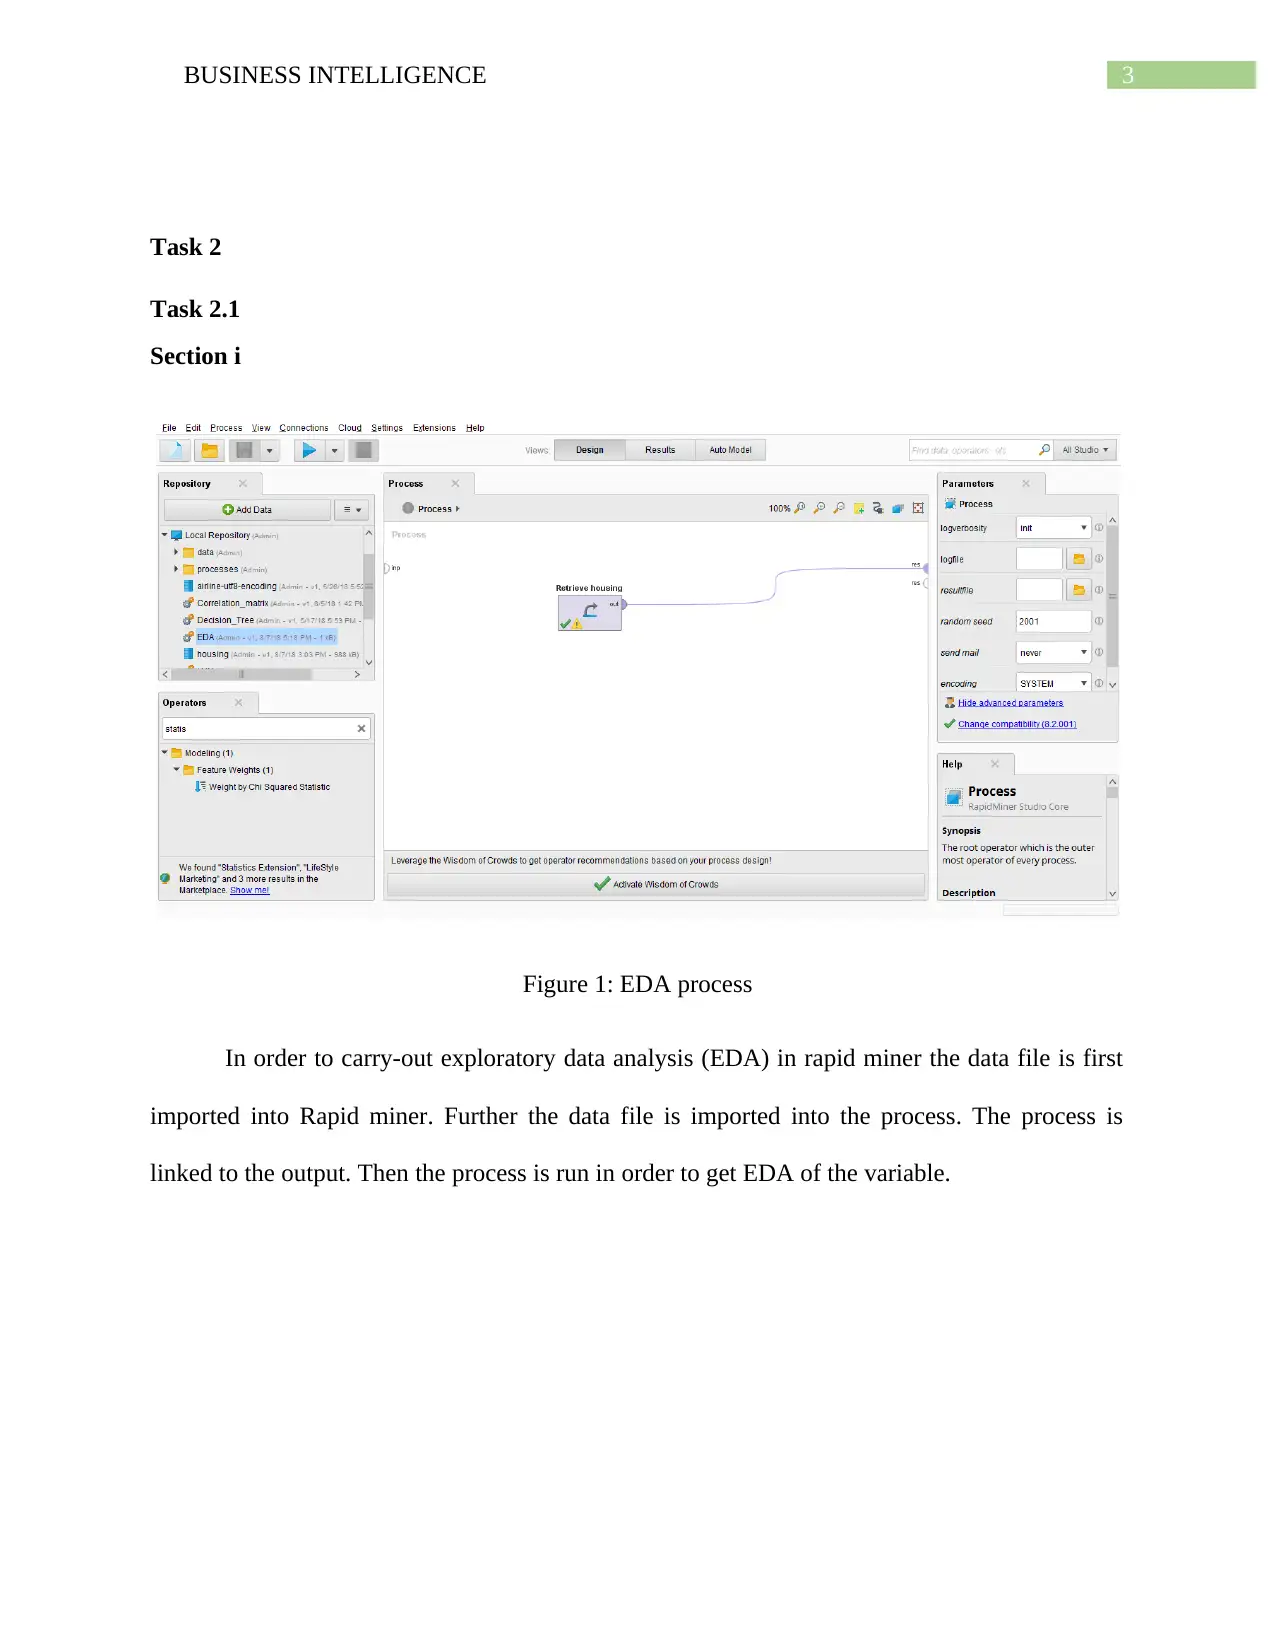
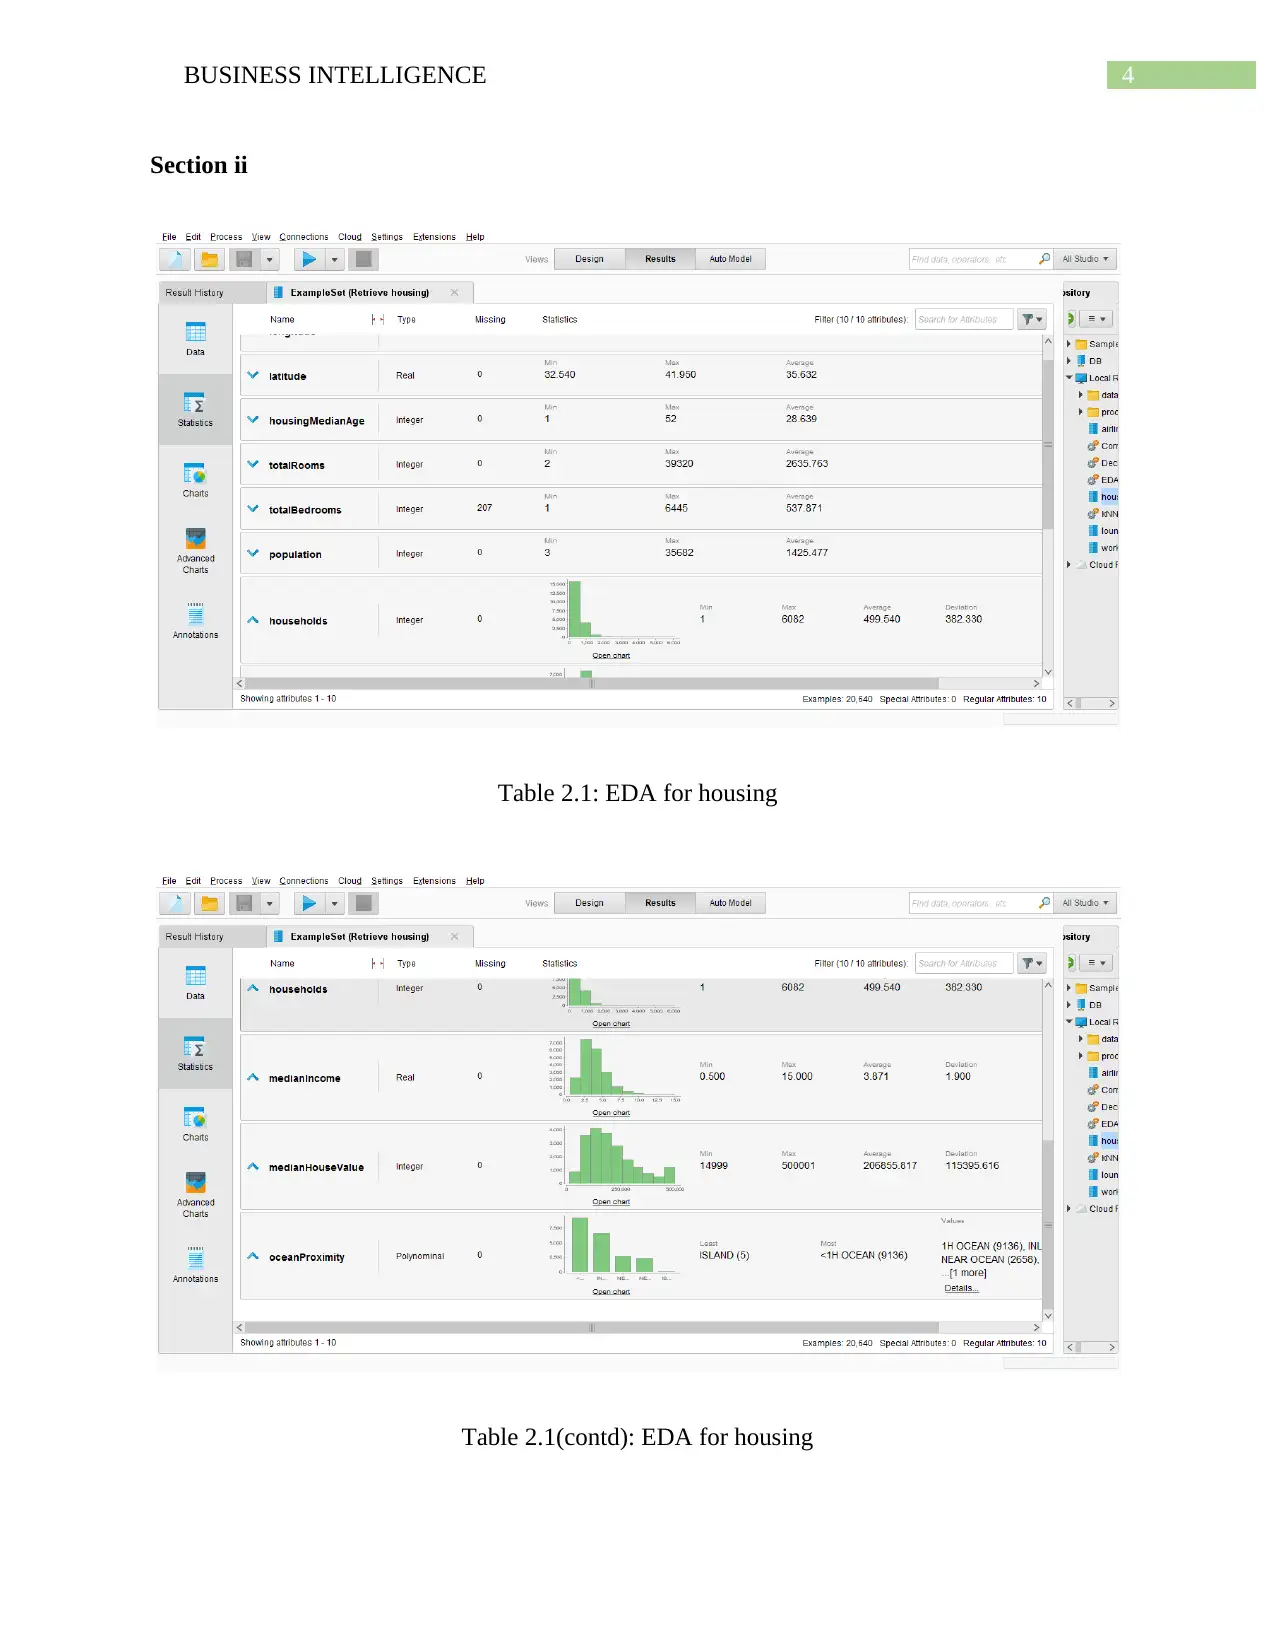
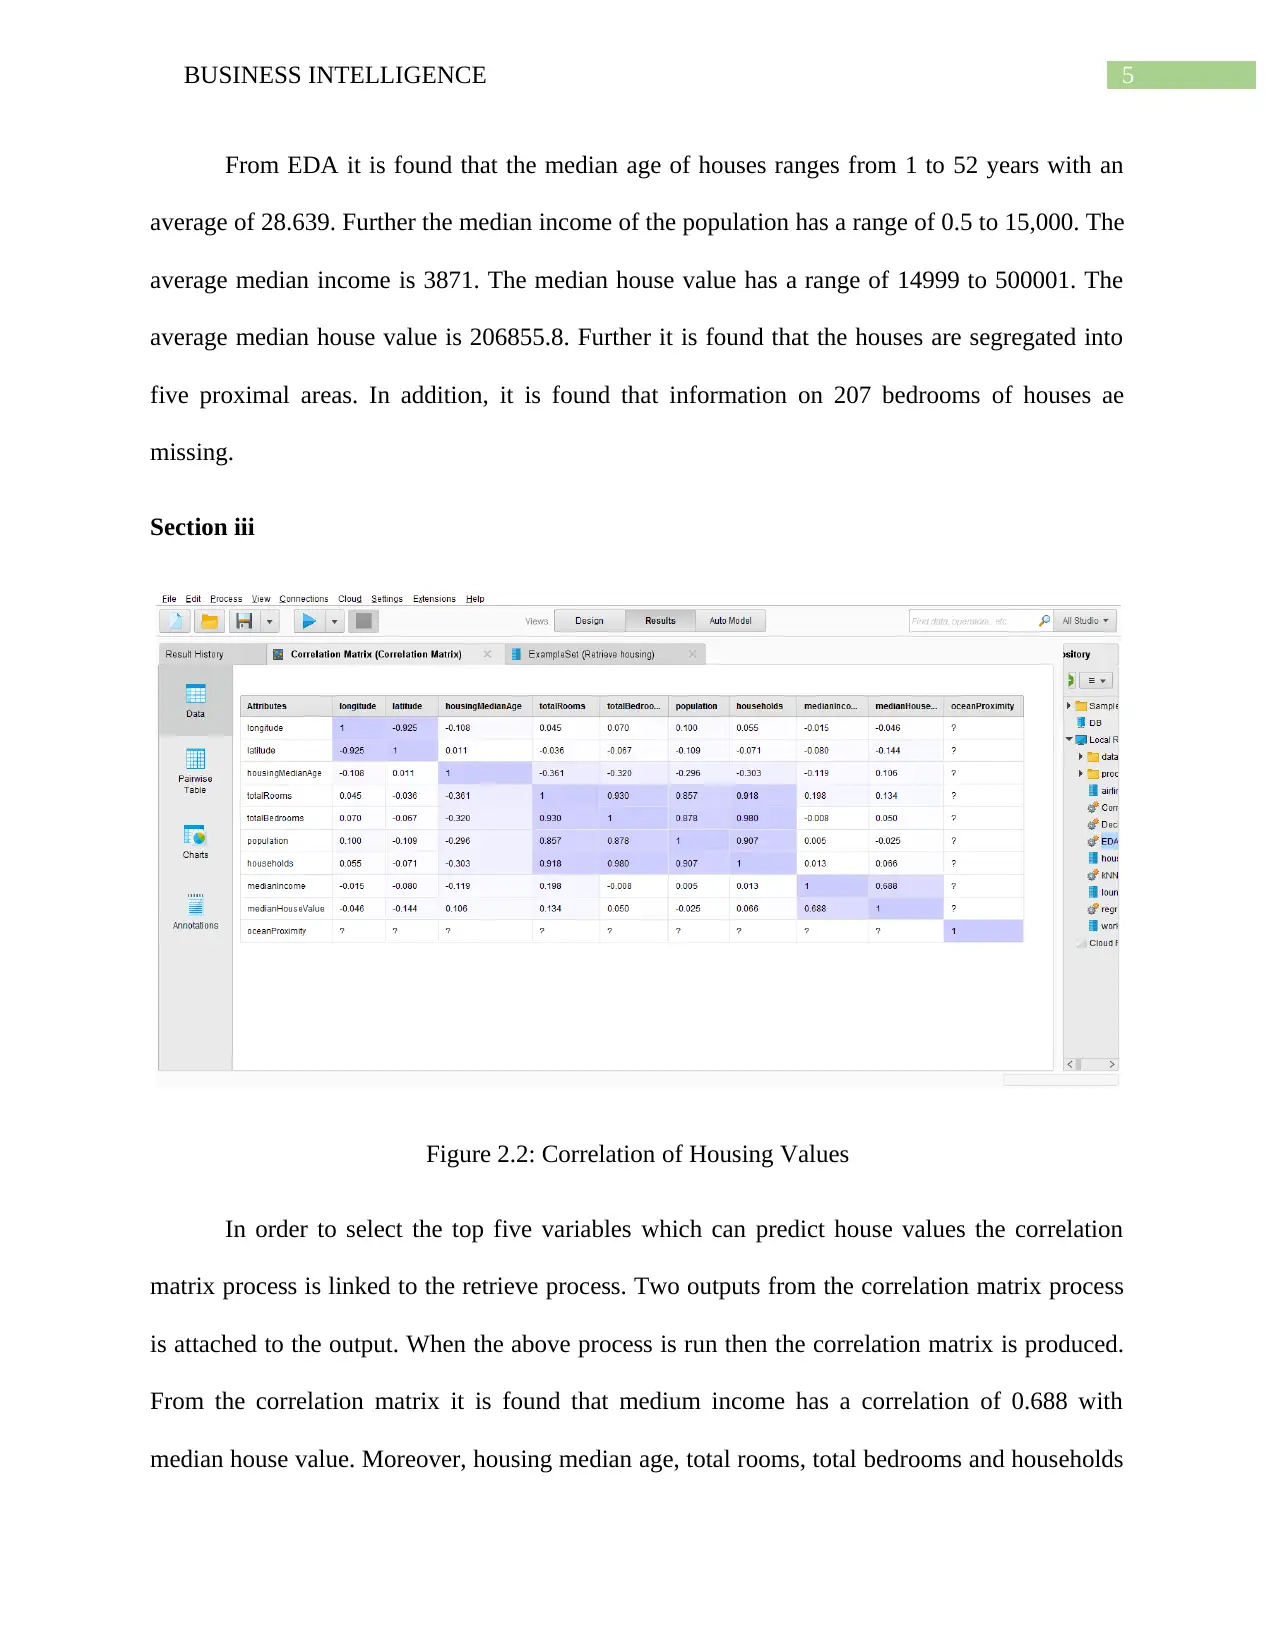
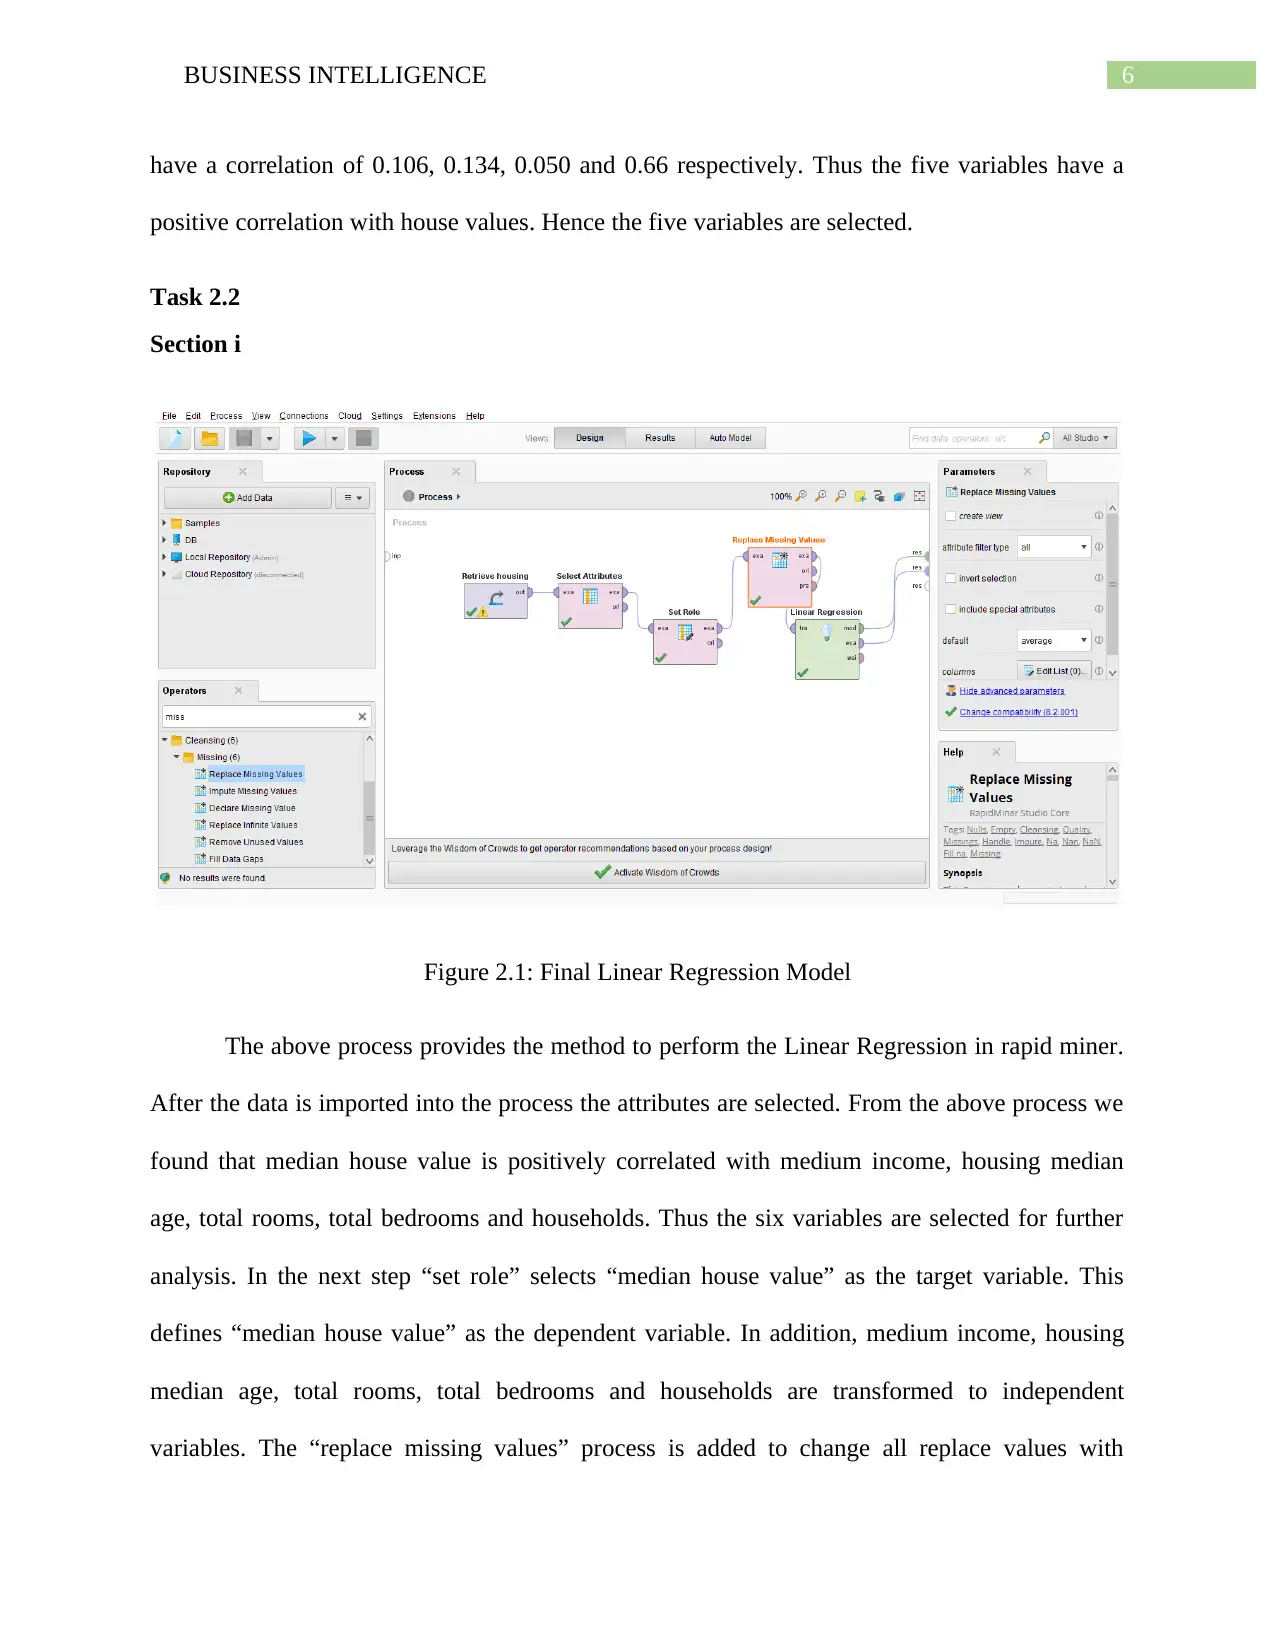
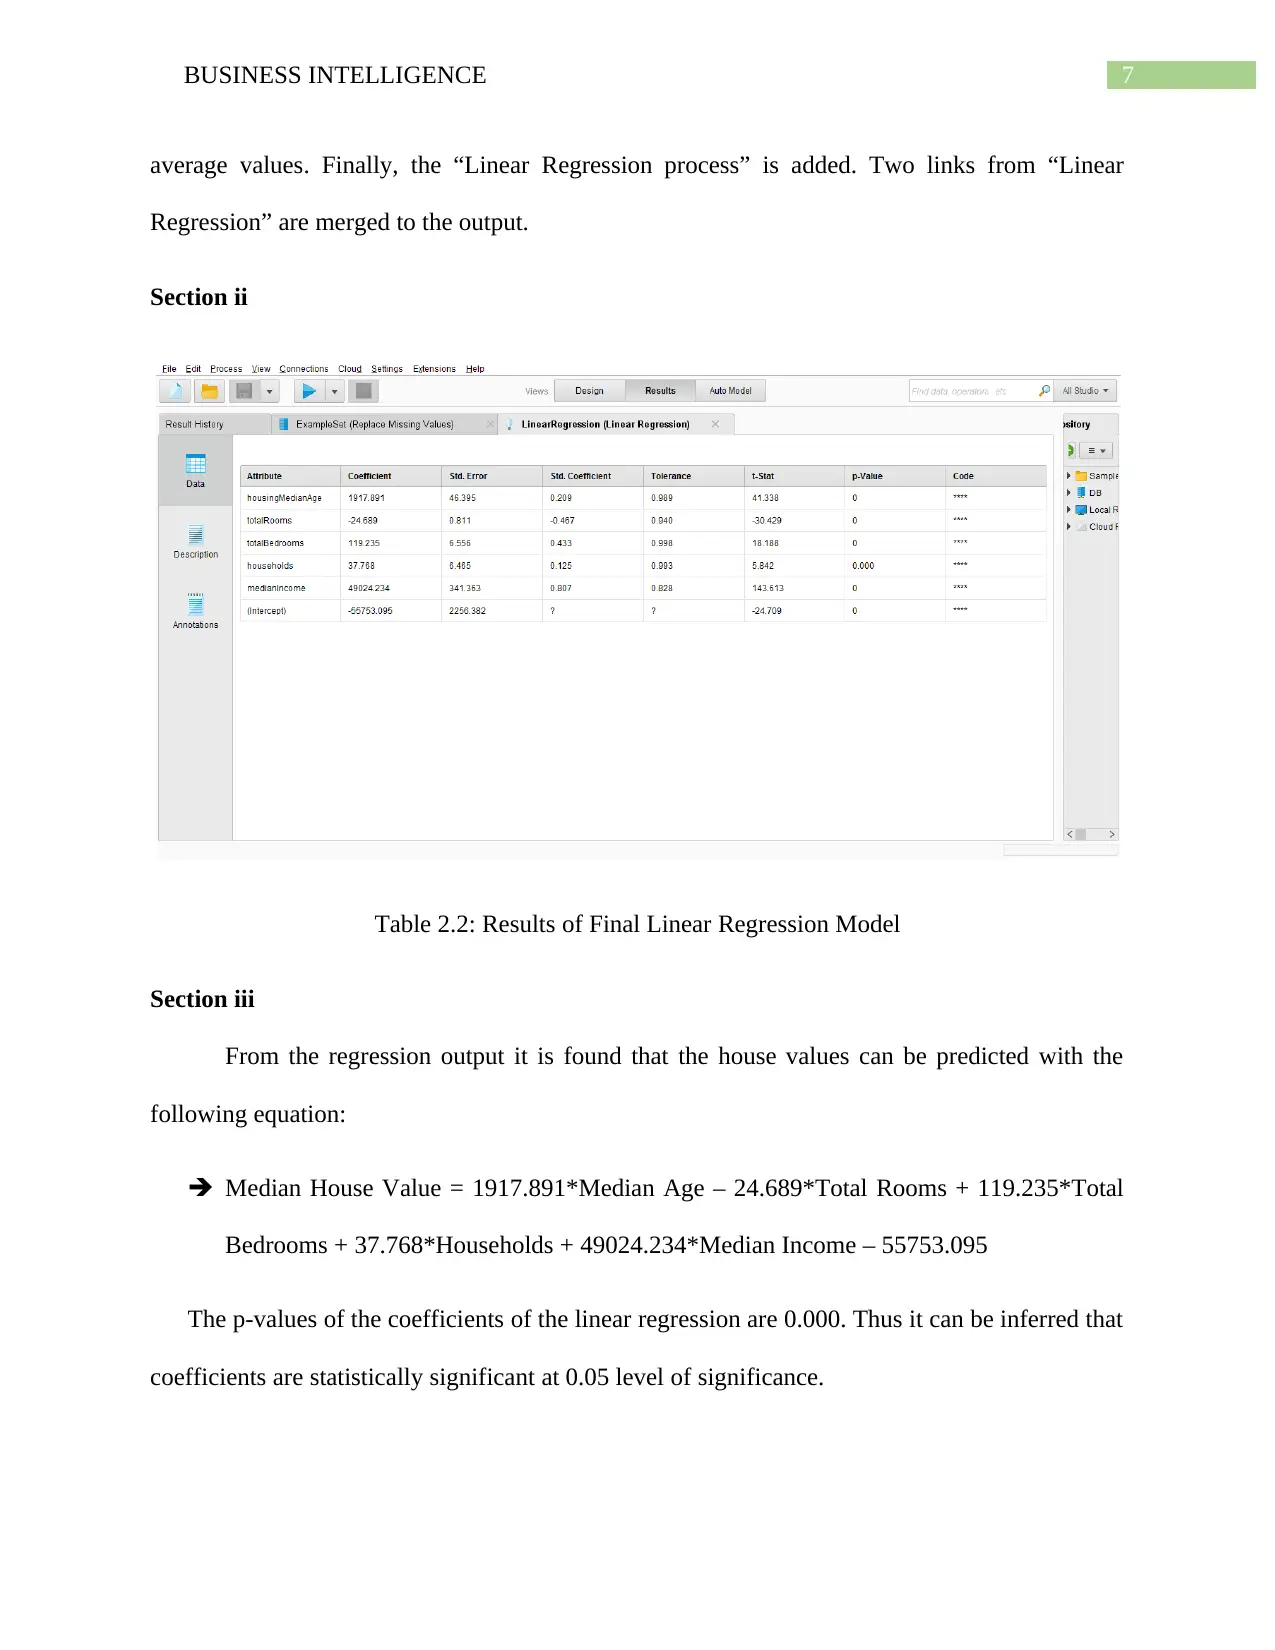
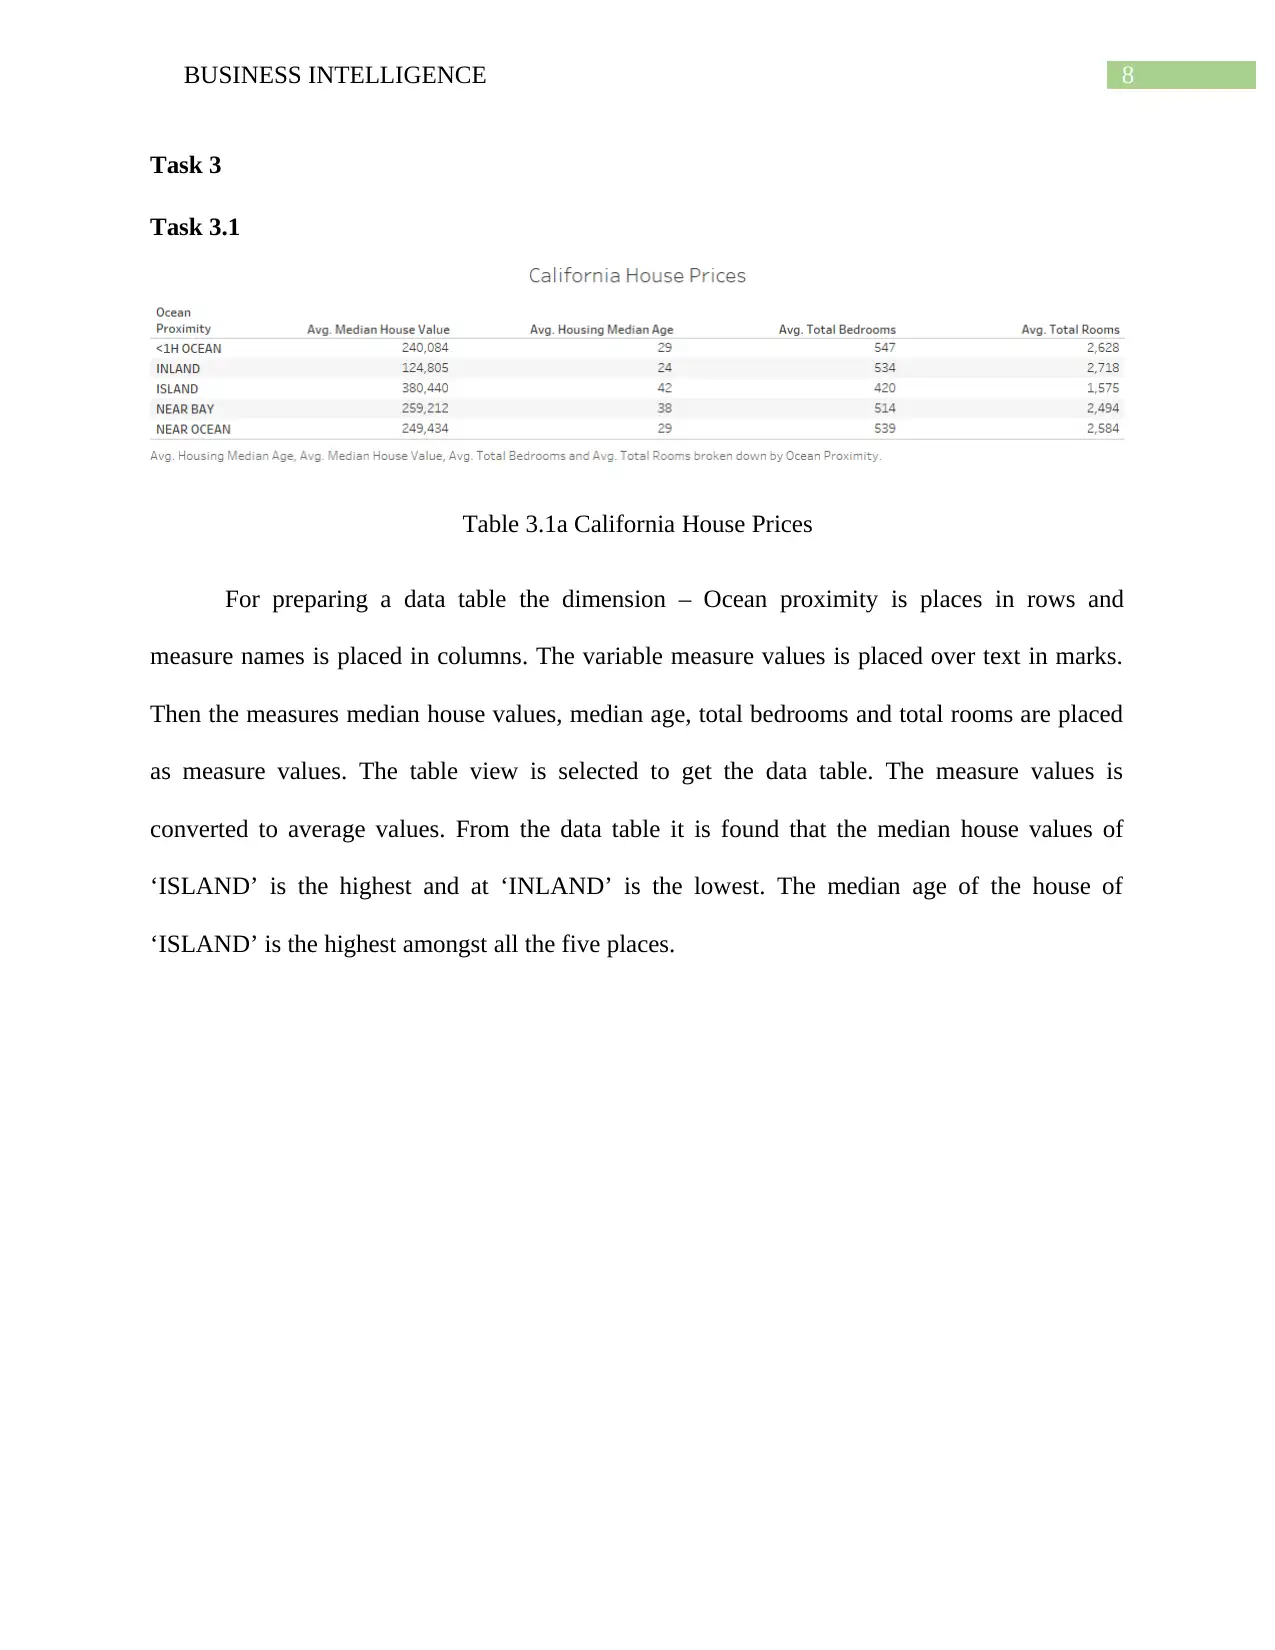
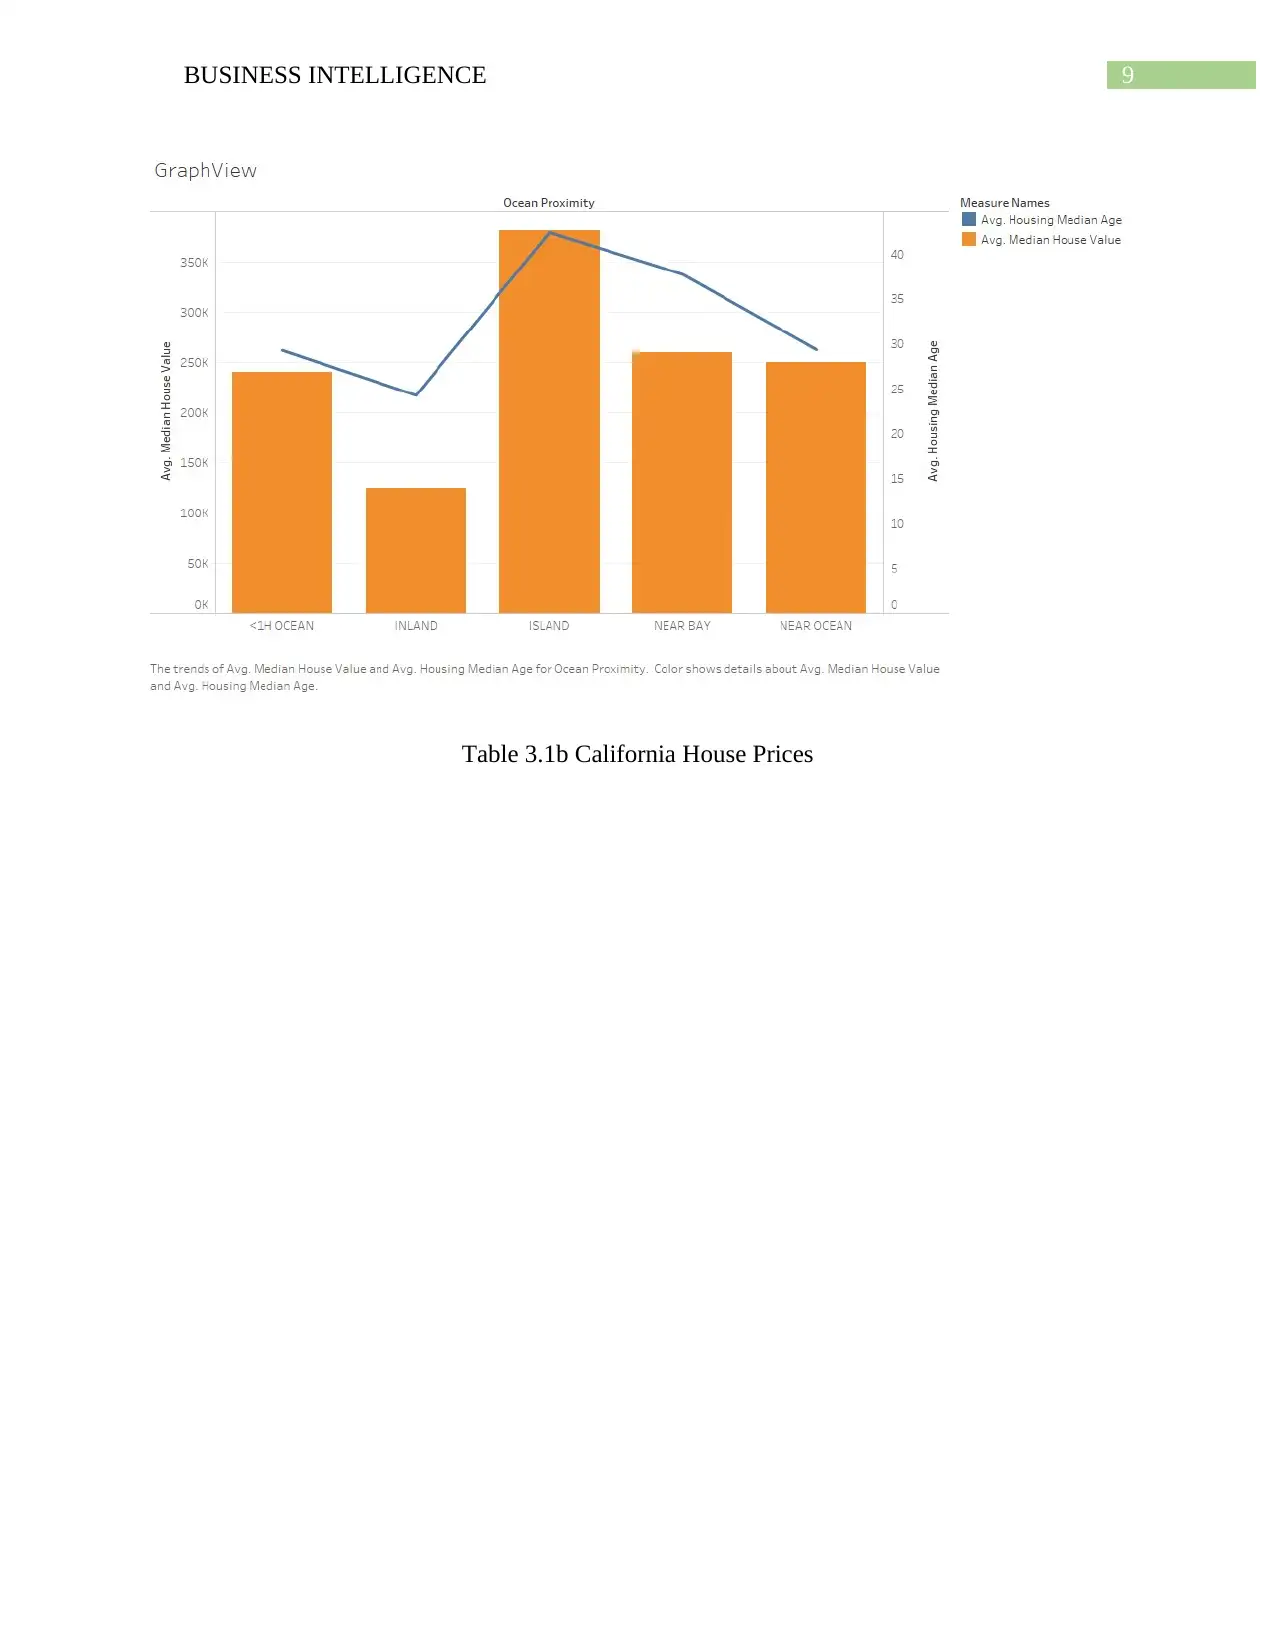
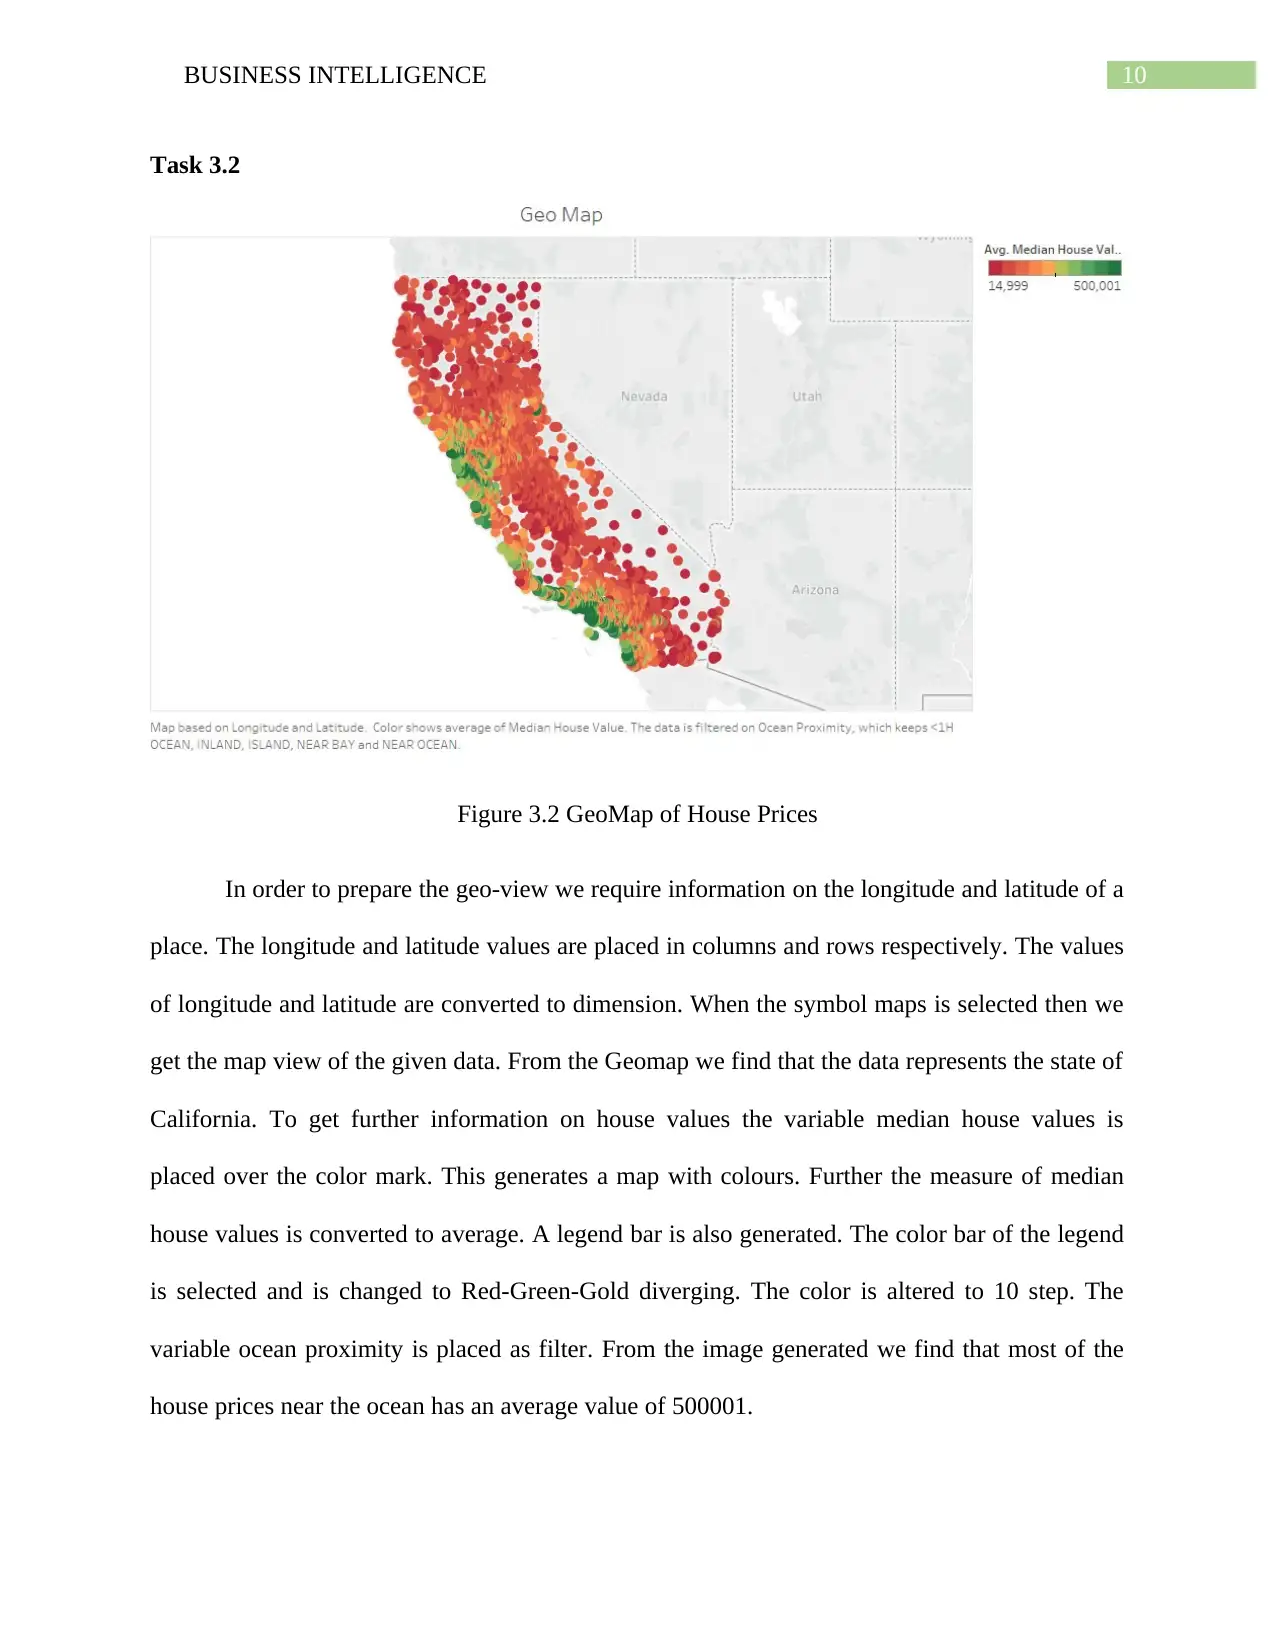
This report explores the role of business intelligence in data-driven decision-making (DDDM). It discusses the impact of DDDM on organizational culture and outlines how data analysis can provide a competitive advantage. The report details an exploratory data analysis (EDA) process using RapidMiner, focusing on housing data and identifying key variables for predicting house values. Furthermore, it demonstrates linear regression modeling to predict house values based on selected variables and visualizes California house prices using Tableau, highlighting geographical price variations. This document is available on Desklib, a platform offering a wide range of study resources, including past papers and solved assignments.
Document Page
Running Head: BUSINESS INTELLIGENCE
Business Intelligence
Name of the Student
Name of the University
Author Note
tabler-icon-diamond-filled.svg

Paraphrase This Document

Need a fresh take? Get an instant paraphrase of this document with our AI Paraphraser
Document Page
1BUSINESS INTELLIGENCE
Table of Contents
Task 1...............................................................................................................................................2
Task 1.1........................................................................................................................................2
Task 1.2........................................................................................................................................2
Task 2...............................................................................................................................................3
Task 2.1........................................................................................................................................3
Section i.......................................................................................................................................3
Section ii......................................................................................................................................4
Section iii.....................................................................................................................................5
Task 2.2........................................................................................................................................6
Section i.......................................................................................................................................6
Section ii......................................................................................................................................7
Section iii.....................................................................................................................................7
Task 3...............................................................................................................................................8
Task 3.1........................................................................................................................................8
Task 3.2......................................................................................................................................10
References......................................................................................................................................11
Document Page
2BUSINESS INTELLIGENCE
Task 1
Task 1.1
Organization culture represents the values, morals beliefs that define the organisation.
These values and beliefs are unique to the organization and they help to build the psychological
environment within the organization. The culture represents the business process conducted by
the organization. Moreover, wider implications are how the organization treats its employees and
customers. The productivity of an organization is affected by its Culture (Alvesson and
Sveningsson, 2015).
Data driven decision making (DDDM) is the process of taking a decision on the basis of
facts. For DDDM to be effective large amount of information is necessary. In addition, analysis
of the data has to be effective such that informed decision can be taken. The decision making
process is not intuitive rather (Provost and Fawcett, 2013).
Task 1.2
The DDDM has a great impact on the practice of organizational culture. The information
regarding customer’s preferences for an organization provides them with competitive advantage.
The information can be used to provide personalised service to the customer thus increasing the
productivity of the organization. Gathering of customer information can be a culture with the
organization. Large amount of data can help the organization in predicting outputs. Thus the
organization can plan for the future and thus initiate necessary changes. This process improves
the decision taking and decision making process within the organization. Moreover, the financial
ability of the organization is also improved thus enhancing the value of the organization. The
presence of huge amount of data can provide the organization with information pertaining to the
opportunities wherein investments can be made (Peltier, Zahay and Lehmann, 2013).
Document Page
3BUSINESS INTELLIGENCE
Task 2
Task 2.1
Section i
Figure 1: EDA process
In order to carry-out exploratory data analysis (EDA) in rapid miner the data file is first
imported into Rapid miner. Further the data file is imported into the process. The process is
linked to the output. Then the process is run in order to get EDA of the variable.
tabler-icon-diamond-filled.svg

Paraphrase This Document

Need a fresh take? Get an instant paraphrase of this document with our AI Paraphraser
Document Page
4BUSINESS INTELLIGENCE
Section ii
Table 2.1: EDA for housing
Table 2.1(contd): EDA for housing
Document Page
5BUSINESS INTELLIGENCE
From EDA it is found that the median age of houses ranges from 1 to 52 years with an
average of 28.639. Further the median income of the population has a range of 0.5 to 15,000. The
average median income is 3871. The median house value has a range of 14999 to 500001. The
average median house value is 206855.8. Further it is found that the houses are segregated into
five proximal areas. In addition, it is found that information on 207 bedrooms of houses ae
missing.
Section iii
Figure 2.2: Correlation of Housing Values
In order to select the top five variables which can predict house values the correlation
matrix process is linked to the retrieve process. Two outputs from the correlation matrix process
is attached to the output. When the above process is run then the correlation matrix is produced.
From the correlation matrix it is found that medium income has a correlation of 0.688 with
median house value. Moreover, housing median age, total rooms, total bedrooms and households
Document Page
6BUSINESS INTELLIGENCE
have a correlation of 0.106, 0.134, 0.050 and 0.66 respectively. Thus the five variables have a
positive correlation with house values. Hence the five variables are selected.
Task 2.2
Section i
Figure 2.1: Final Linear Regression Model
The above process provides the method to perform the Linear Regression in rapid miner.
After the data is imported into the process the attributes are selected. From the above process we
found that median house value is positively correlated with medium income, housing median
age, total rooms, total bedrooms and households. Thus the six variables are selected for further
analysis. In the next step “set role” selects “median house value” as the target variable. This
defines “median house value” as the dependent variable. In addition, medium income, housing
median age, total rooms, total bedrooms and households are transformed to independent
variables. The “replace missing values” process is added to change all replace values with
tabler-icon-diamond-filled.svg

Paraphrase This Document

Need a fresh take? Get an instant paraphrase of this document with our AI Paraphraser
Document Page
7BUSINESS INTELLIGENCE
average values. Finally, the “Linear Regression process” is added. Two links from “Linear
Regression” are merged to the output.
Section ii
Table 2.2: Results of Final Linear Regression Model
Section iii
From the regression output it is found that the house values can be predicted with the
following equation:
Median House Value = 1917.891*Median Age – 24.689*Total Rooms + 119.235*Total
Bedrooms + 37.768*Households + 49024.234*Median Income – 55753.095
The p-values of the coefficients of the linear regression are 0.000. Thus it can be inferred that
coefficients are statistically significant at 0.05 level of significance.
Document Page
8BUSINESS INTELLIGENCE
Task 3
Task 3.1
Table 3.1a California House Prices
For preparing a data table the dimension – Ocean proximity is places in rows and
measure names is placed in columns. The variable measure values is placed over text in marks.
Then the measures median house values, median age, total bedrooms and total rooms are placed
as measure values. The table view is selected to get the data table. The measure values is
converted to average values. From the data table it is found that the median house values of
‘ISLAND’ is the highest and at ‘INLAND’ is the lowest. The median age of the house of
‘ISLAND’ is the highest amongst all the five places.
Document Page
9BUSINESS INTELLIGENCE
Table 3.1b California House Prices
tabler-icon-diamond-filled.svg

Paraphrase This Document

Need a fresh take? Get an instant paraphrase of this document with our AI Paraphraser
Document Page
10BUSINESS INTELLIGENCE
Task 3.2
Figure 3.2 GeoMap of House Prices
In order to prepare the geo-view we require information on the longitude and latitude of a
place. The longitude and latitude values are placed in columns and rows respectively. The values
of longitude and latitude are converted to dimension. When the symbol maps is selected then we
get the map view of the given data. From the Geomap we find that the data represents the state of
California. To get further information on house values the variable median house values is
placed over the color mark. This generates a map with colours. Further the measure of median
house values is converted to average. A legend bar is also generated. The color bar of the legend
is selected and is changed to Red-Green-Gold diverging. The color is altered to 10 step. The
variable ocean proximity is placed as filter. From the image generated we find that most of the
house prices near the ocean has an average value of 500001.
Document Page
11BUSINESS INTELLIGENCE
References
Alvesson, M. and Sveningsson, S. (2015) Changing organizational culture: Cultural change
work in progress. Routledge.
Peltier, J. W., Zahay, D. and Lehmann, D. R. (2013) ‘Organizational learning and CRM success:
a model for linking organizational practices, customer data quality, and performance’, Journal of
Interactive Marketing, 27(1), pp. 1–13.
Provost, F. and Fawcett, T. (2013) ‘Data science and its relationship to big data and data-driven
decision making’, Big data, 1(1), pp. 51–59.
chevron_up_icon
1 out of 12
circle_padding
hide_on_mobile
zoom_out_icon
[object Object]