MSc Management: Data Driven Decisions for Business Coursework Report
VerifiedAdded on 2022/11/30
|20
|3632
|162
Report
AI Summary
This report delves into the realm of data-driven decision-making for businesses, analyzing the impact of marketing campaigns on sales performance within the UK market. The study begins by outlining the key changes and trends in data analysis, such as the Internet of Things (IoT), the 4Vs of data analysis (Volume, Velocity, Variety, Veracity), cloud computing, and the utilization of big data. It then describes the analytical approach employed, primarily using Microsoft Excel's pivot tables, filters, and graphs to extract and present key findings from three years of sales data. The analysis section details the steps taken to clean the data and presents a comparative analysis of sales value and volume across different countries, highlighting the sales performance for 2020. The report also provides a comparative analysis of sales values for the 5th month of 2020 across different product categories. Finally, the report concludes with a summary of key findings, including the positive impact of marketing campaigns on UK sales, and recommends ways to improve marketing strategies through econometric analysis.

Data driven decision for business
Paraphrase This Document
Need a fresh take? Get an instant paraphrase of this document with our AI Paraphraser
TABLE OF CONTENTS
INTRODUCTION...........................................................................................................................2
a) Presenting the key changes and trends of data analysis..........................................................2
b) Describing the analytical approach used by business.............................................................3
c) Analysis...................................................................................................................................4
i) Outline the steps to clean data..................................................................................................4
ii) Presenting the highlight of key point drawn from analysis.....................................................4
d) Conclusion and next steps.......................................................................................................9
i) Summary and recommendations..............................................................................................9
ii) Econometric analysis for Bangles.........................................................................................10
Key finding through presentation..............................................................................................11
REFERENCES..............................................................................................................................20
INTRODUCTION
Data driven is an approach that is used to gain a great deal of tactics that helps a business
to generate sales. On the other side, it is all about utilization of data in order to inform as well as
enhance the process for business. Also, the present study will highlight the importance of using
data analysis techniques within a business in order to make valid decision for future. The report
will based upon the data of last 3 years that helps to determine the impact of marketing
campaigns upon the sales performance in the UK. For that study will summarize the key changes
and trends that increases the importance of data analysis within Bangles. Moreover, study will
justify the analytical approach used in order to examine the relationship over other. Further, with
the help graphs and tables, study will highlight the key points. Lastly, it recommends the ways
through which marketing campaigns may improve by using econometric analysis.
a) Presenting the key changes and trends of data analysis
The trend and changes within data analysis may shift towards downward and upward,
that enable company to predict the changes within company, so that it will run in effective
manner. Also, there are many changes of data analysis which are as mentioned below:
Internet of Things (IoT): Continuous intelligence is also called as a real-time
intelligence which increases the possible technologies such as IoT that grow more connected.
Through this change, company is able to analyze the large data volume and organization also
derive number of benefits like, control process automatically, engage more customers and
empower employees (5 Big trends in Data analytics, 2021).
4V’s: Another key trend implemented under the data analysis in which company analyze
the data in effective manner. Such that through volume, velocity, variety and veracity, Bangles
may easily analyze the huge business and helps a business to develop a deep understanding about
data analysis. Large organizations uses such tool and analytics in order to reveal meaningful
information that contribute to overall results as well. That is why, with the help of advance trend,
it become easy to analyze big data sets (Pasupathi and et.al., 2021).
Cloud computing: it is recognized as a cornerstone of data analytics in cloud computing.
Through such advance technology, company is able to track the social media engagement and
statistics that helps to make effective decision for future. With the help of cloud computing,
⊘ This is a preview!⊘
Do you want full access?
Subscribe today to unlock all pages.
Trusted by 1+ million students worldwide
companies can scale and adapt the speed in order to accelerate innovation in order to reduce cost
(Liu, 2020). That is why, it helps Bangles to analyze the data in an effective manner to generate
the best outcome.
Big data: it is another form of trend in which experts effectively use the big data in order
to make future prediction. Under this, social media marketers use big data which increases the
certainty regard to customer need and how it creates a direct impact upon the sales performance
of a company. That is why, it can be stated that through big data, company is able to analyze the
data in effective manner and assist to identify the loopholes which can be overcome by
implementing competent strategies.
Data analytics helps the business to add value such that it assist to extract data from
different sources like social media, cloud computing etc. Within Bangles, company is able to
interpret the data and analyze the results through different statistical techniques (Güçlü, 2020).
Also, with the help of data it create dashboards which interpret across the business and also helps
to monitoring the data quality too.
b) Describing the analytical approach used by business
In order to analyze the data in effective manner, it is necessary to use analytical approach
which helps to answer the business question i.e. impact of marketing campaign of UK upon the
sales performance. Under this, some of the major key function of Excel has been used that helps
to extract the data and determine the key points through data. Excel is one of the most important
tool that helps to make decision and create meaningful charts that helps to extract the data in an
effective manner. Similarly, to extract the data of summative, Excel as a tool will be used in
which different functions used that assist to answer the Bangle’s question. These are as
mentioned :
Pivot table: It is the major approach used within excel that helps to summarize and
analyze the excel data (Introduction to data analysis through excel, 2021). Through this,
sit will be easy to determine the monthly sales value and volume for the year of 2020
within each country. This in turn shows that it allow to extract the significance about the
data set and also assist to identify the sales for each month and impact of marketing
campaigns over the UK sales.
Paraphrase This Document
Need a fresh take? Get an instant paraphrase of this document with our AI Paraphraser
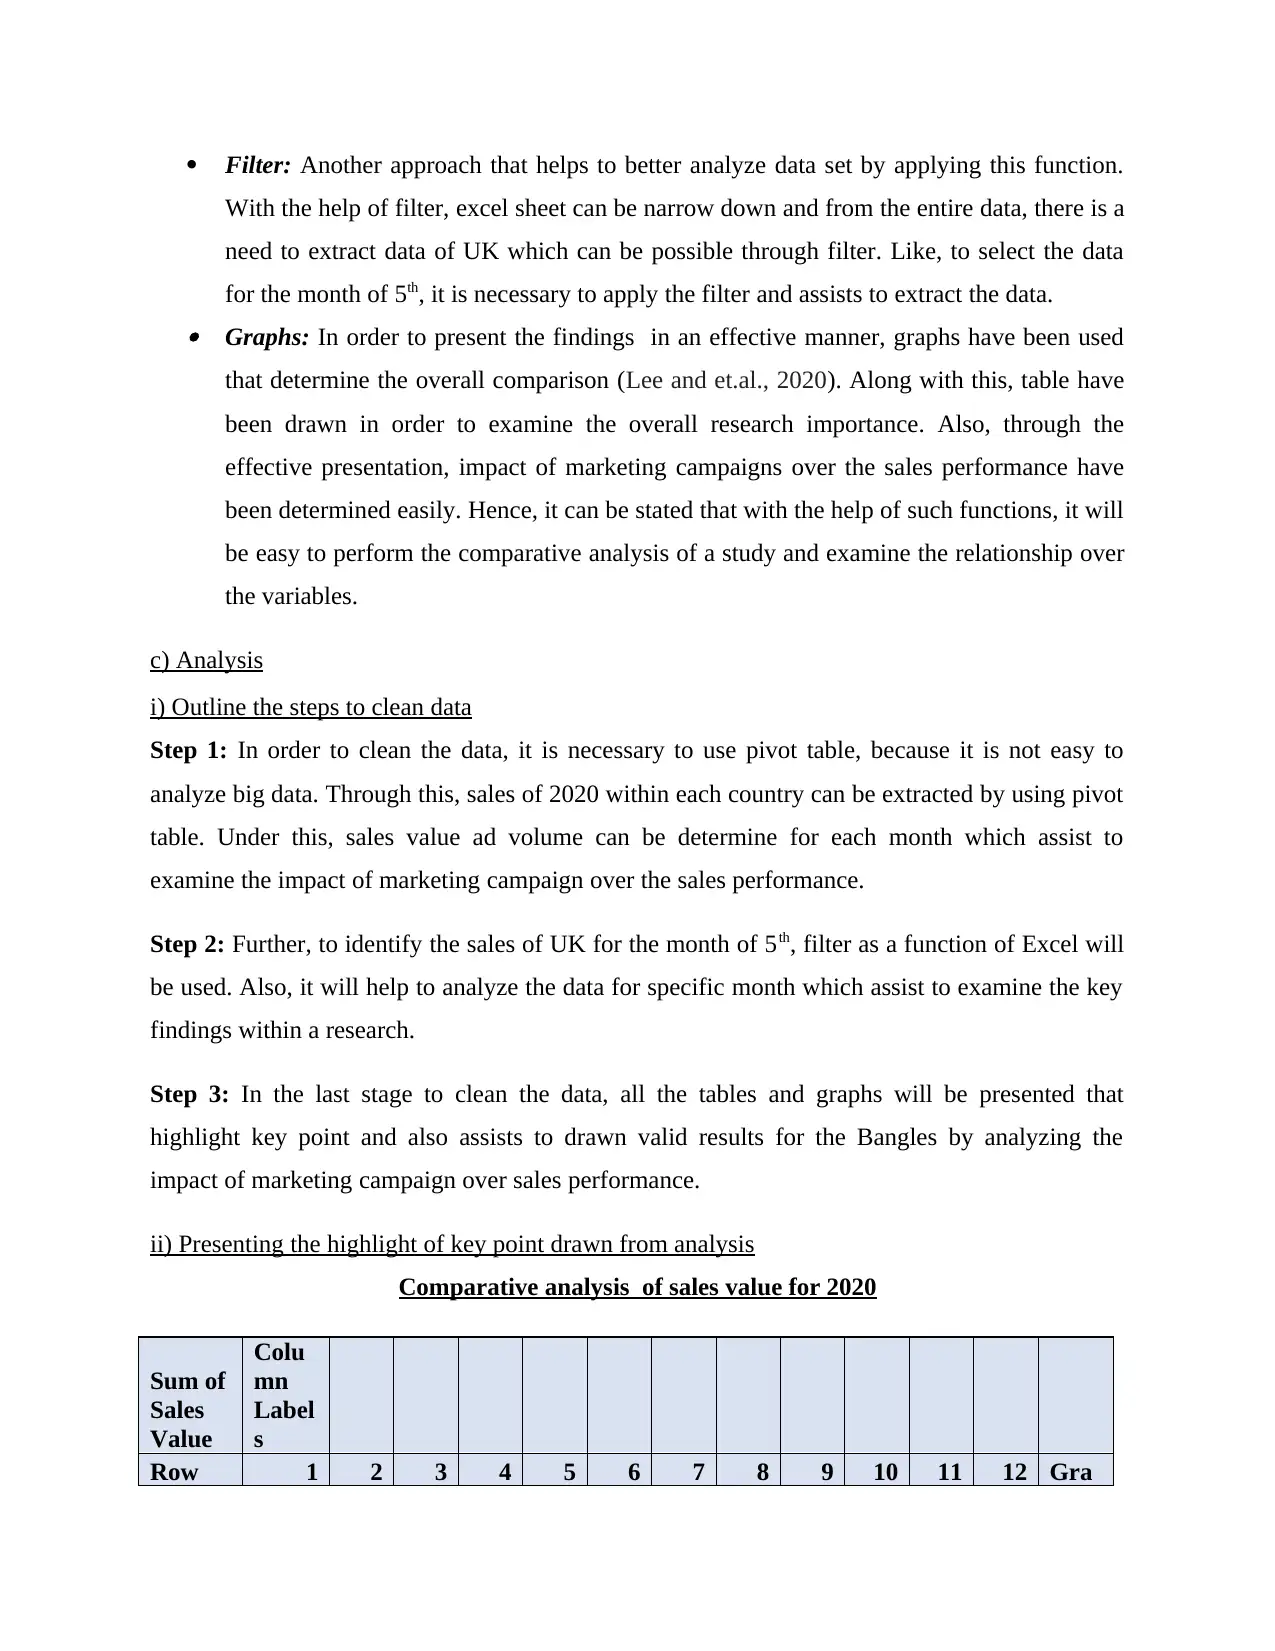
Filter: Another approach that helps to better analyze data set by applying this function.
With the help of filter, excel sheet can be narrow down and from the entire data, there is a
need to extract data of UK which can be possible through filter. Like, to select the data
for the month of 5th, it is necessary to apply the filter and assists to extract the data. Graphs: In order to present the findings in an effective manner, graphs have been used
that determine the overall comparison (Lee and et.al., 2020). Along with this, table have
been drawn in order to examine the overall research importance. Also, through the
effective presentation, impact of marketing campaigns over the sales performance have
been determined easily. Hence, it can be stated that with the help of such functions, it will
be easy to perform the comparative analysis of a study and examine the relationship over
the variables.
c) Analysis
i) Outline the steps to clean data
Step 1: In order to clean the data, it is necessary to use pivot table, because it is not easy to
analyze big data. Through this, sales of 2020 within each country can be extracted by using pivot
table. Under this, sales value ad volume can be determine for each month which assist to
examine the impact of marketing campaign over the sales performance.
Step 2: Further, to identify the sales of UK for the month of 5th, filter as a function of Excel will
be used. Also, it will help to analyze the data for specific month which assist to examine the key
findings within a research.
Step 3: In the last stage to clean the data, all the tables and graphs will be presented that
highlight key point and also assists to drawn valid results for the Bangles by analyzing the
impact of marketing campaign over sales performance.
ii) Presenting the highlight of key point drawn from analysis
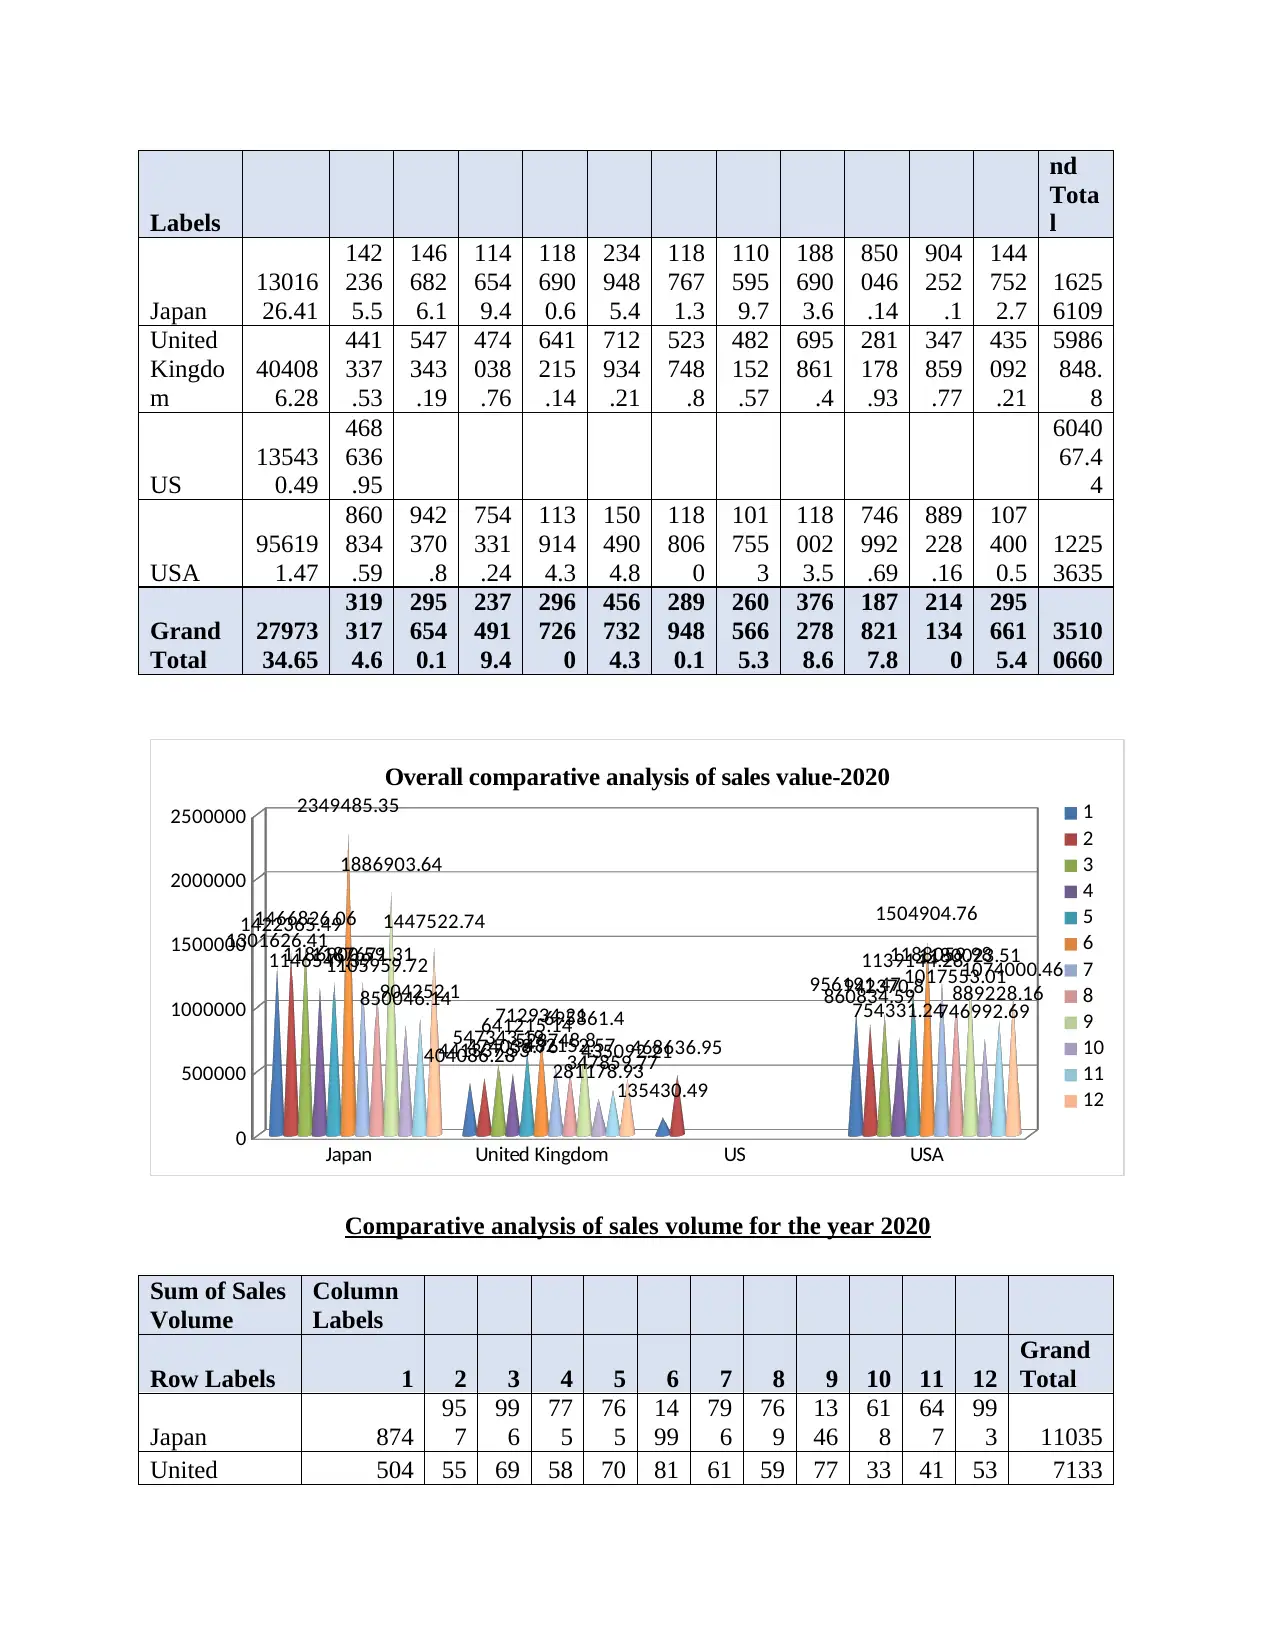
Comparative analysis of sales value for 2020
Sum of
Sales
Value
Colu
mn
Label
s
Row 1 2 3 4 5 6 7 8 9 10 11 12 Gra
With the help of filter, excel sheet can be narrow down and from the entire data, there is a
need to extract data of UK which can be possible through filter. Like, to select the data
for the month of 5th, it is necessary to apply the filter and assists to extract the data. Graphs: In order to present the findings in an effective manner, graphs have been used
that determine the overall comparison (Lee and et.al., 2020). Along with this, table have
been drawn in order to examine the overall research importance. Also, through the
effective presentation, impact of marketing campaigns over the sales performance have
been determined easily. Hence, it can be stated that with the help of such functions, it will
be easy to perform the comparative analysis of a study and examine the relationship over
the variables.
c) Analysis
i) Outline the steps to clean data
Step 1: In order to clean the data, it is necessary to use pivot table, because it is not easy to
analyze big data. Through this, sales of 2020 within each country can be extracted by using pivot
table. Under this, sales value ad volume can be determine for each month which assist to
examine the impact of marketing campaign over the sales performance.
Step 2: Further, to identify the sales of UK for the month of 5th, filter as a function of Excel will
be used. Also, it will help to analyze the data for specific month which assist to examine the key
findings within a research.
Step 3: In the last stage to clean the data, all the tables and graphs will be presented that
highlight key point and also assists to drawn valid results for the Bangles by analyzing the
impact of marketing campaign over sales performance.
ii) Presenting the highlight of key point drawn from analysis
Comparative analysis of sales value for 2020
Sum of
Sales
Value
Colu
mn
Label
s
Row 1 2 3 4 5 6 7 8 9 10 11 12 Gra
Labels
nd
Tota
l
Japan
13016
26.41
142
236
5.5
146
682
6.1
114
654
9.4
118
690
0.6
234
948
5.4
118
767
1.3
110
595
9.7
188
690
3.6
850
046
.14
904
252
.1
144
752
2.7
1625
6109
United
Kingdo
m
40408
6.28
441
337
.53
547
343
.19
474
038
.76
641
215
.14
712
934
.21
523
748
.8
482
152
.57
695
861
.4
281
178
.93
347
859
.77
435
092
.21
5986
848.
8
US
13543
0.49
468
636
.95
6040
67.4
4
USA
95619
1.47
860
834
.59
942
370
.8
754
331
.24
113
914
4.3
150
490
4.8
118
806
0
101
755
3
118
002
3.5
746
992
.69
889
228
.16
107
400
0.5
1225
3635
Grand
Total
27973
34.65
319
317
4.6
295
654
0.1
237
491
9.4
296
726
0
456
732
4.3
289
948
0.1
260
566
5.3
376
278
8.6
187
821
7.8
214
134
0
295
661
5.4
3510
0660
Japan United Kingdom US USA
0
500000
1000000
1500000
2000000
2500000
1301626.41
404086.28
135430.49
956191.47
1422365.49
441337.53 468636.95
860834.59
1466826.06
547343.19
942370.8
1146549.39
474038.76
754331.24
1186900.59
641215.14
1139144.28
2349485.35
712934.21
1504904.76
1187671.31
523748.8
1188059.98
1105959.72
482152.57
1017553.01
1886903.64
695861.4
1180023.51
850046.14
281178.93
746992.69
904252.1
347859.77
889228.16
1447522.74
435092.21
1074000.46
Overall comparative analysis of sales value-2020
1
2
3
4
5
6
7
8
9
10
11
12
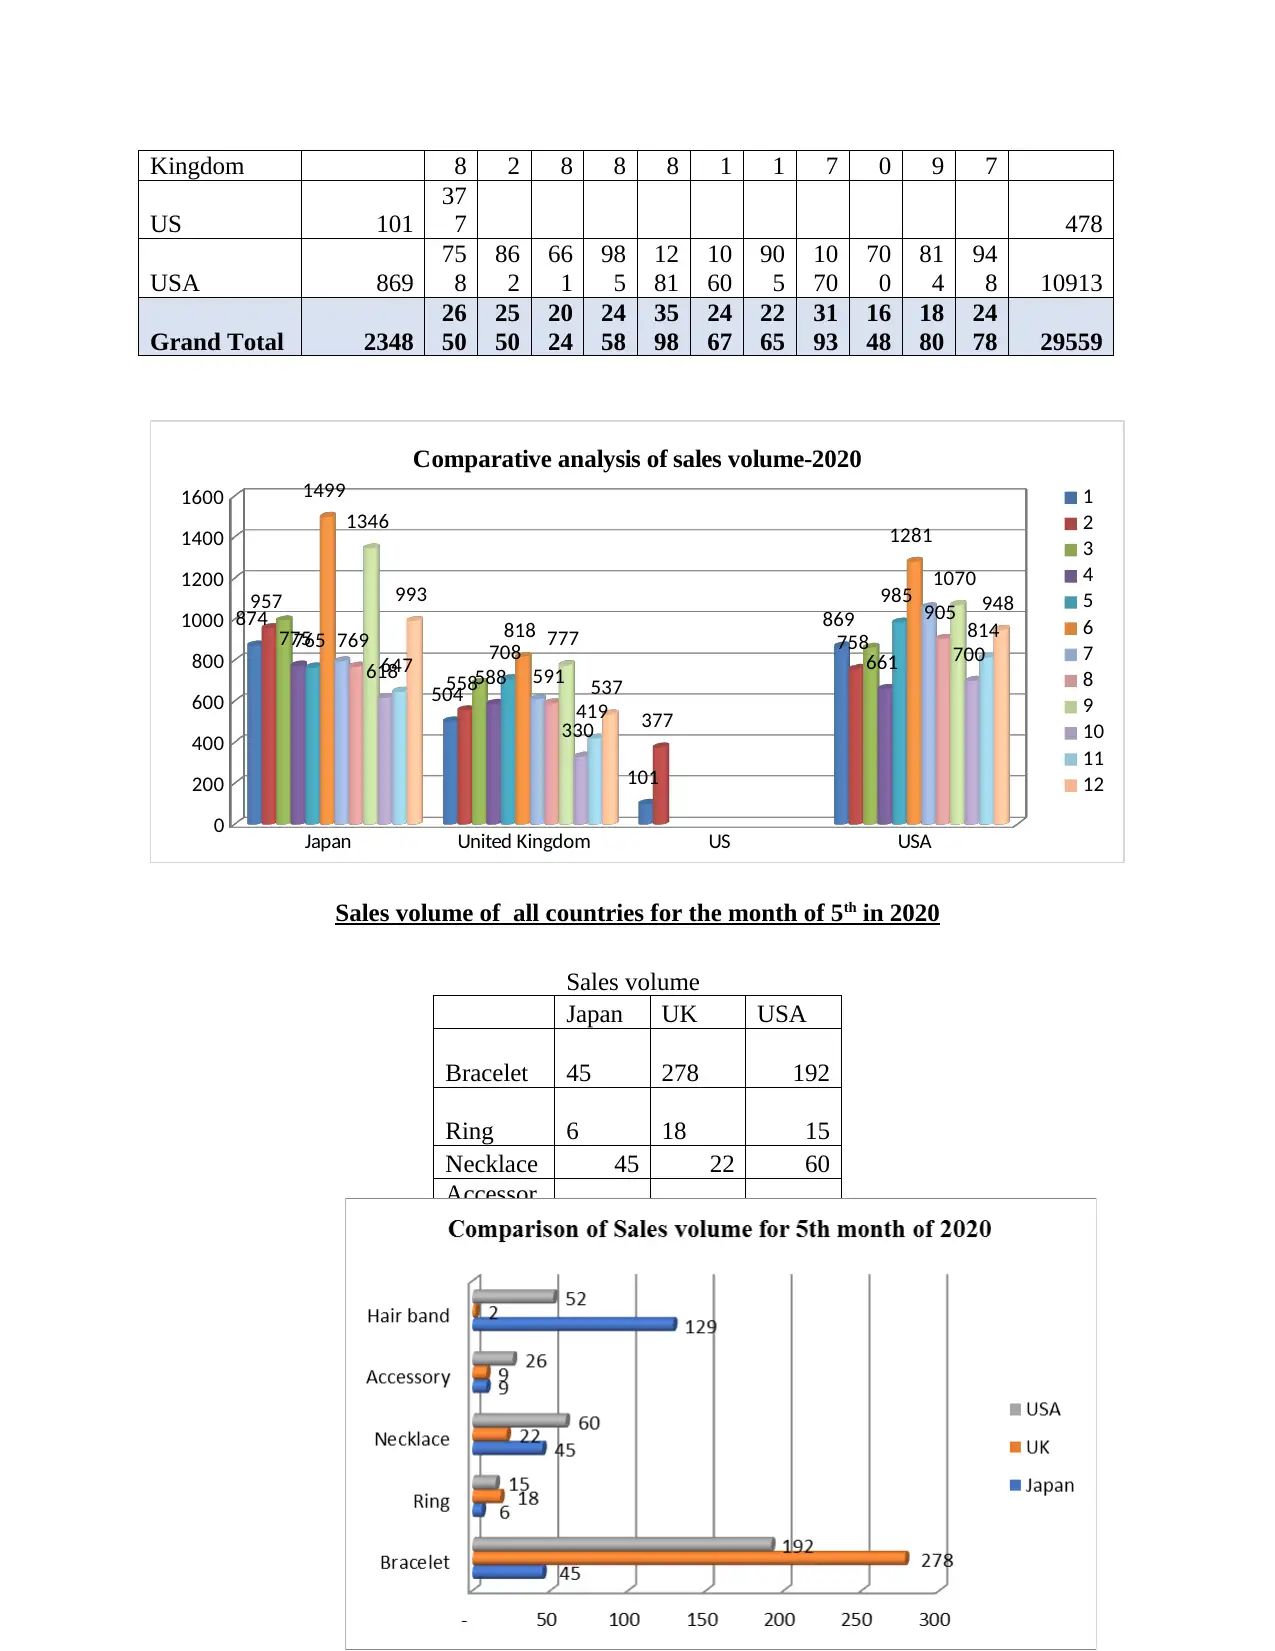
Comparative analysis of sales volume for the year 2020
Sum of Sales
Volume
Column
Labels
Row Labels 1 2 3 4 5 6 7 8 9 10 11 12
Grand
Total
Japan 874
95
7
99
6
77
5
76
5
14
99
79
6
76
9
13
46
61
8
64
7
99
3 11035
United 504 55 69 58 70 81 61 59 77 33 41 53 7133
nd
Tota
l
Japan
13016
26.41
142
236
5.5
146
682
6.1
114
654
9.4
118
690
0.6
234
948
5.4
118
767
1.3
110
595
9.7
188
690
3.6
850
046
.14
904
252
.1
144
752
2.7
1625
6109
United
Kingdo
m
40408
6.28
441
337
.53
547
343
.19
474
038
.76
641
215
.14
712
934
.21
523
748
.8
482
152
.57
695
861
.4
281
178
.93
347
859
.77
435
092
.21
5986
848.
8
US
13543
0.49
468
636
.95
6040
67.4
4
USA
95619
1.47
860
834
.59
942
370
.8
754
331
.24
113
914
4.3
150
490
4.8
118
806
0
101
755
3
118
002
3.5
746
992
.69
889
228
.16
107
400
0.5
1225
3635
Grand
Total
27973
34.65
319
317
4.6
295
654
0.1
237
491
9.4
296
726
0
456
732
4.3
289
948
0.1
260
566
5.3
376
278
8.6
187
821
7.8
214
134
0
295
661
5.4
3510
0660
Japan United Kingdom US USA
0
500000
1000000
1500000
2000000
2500000
1301626.41
404086.28
135430.49
956191.47
1422365.49
441337.53 468636.95
860834.59
1466826.06
547343.19
942370.8
1146549.39
474038.76
754331.24
1186900.59
641215.14
1139144.28
2349485.35
712934.21
1504904.76
1187671.31
523748.8
1188059.98
1105959.72
482152.57
1017553.01
1886903.64
695861.4
1180023.51
850046.14
281178.93
746992.69
904252.1
347859.77
889228.16
1447522.74
435092.21
1074000.46
Overall comparative analysis of sales value-2020
1
2
3
4
5
6
7
8
9
10
11
12
Comparative analysis of sales volume for the year 2020
Sum of Sales
Volume
Column
Labels
Row Labels 1 2 3 4 5 6 7 8 9 10 11 12
Grand
Total
Japan 874
95
7
99
6
77
5
76
5
14
99
79
6
76
9
13
46
61
8
64
7
99
3 11035
United 504 55 69 58 70 81 61 59 77 33 41 53 7133
⊘ This is a preview!⊘
Do you want full access?
Subscribe today to unlock all pages.
Trusted by 1+ million students worldwide
Kingdom 8 2 8 8 8 1 1 7 0 9 7
US 101
37
7 478
USA 869
75
8
86
2
66
1
98
5
12
81
10
60
90
5
10
70
70
0
81
4
94
8 10913
Grand Total 2348
26
50
25
50
20
24
24
58
35
98
24
67
22
65
31
93
16
48
18
80
24
78 29559
Japan United Kingdom US USA
0
200
400
600
800
1000
1200
1400
1600
874
504
101
869
957
558
377
758775
588 661
765 708
985
1499
818
1281
769
591
905
1346
777
1070
618
330
700
647
419
814
993
537
948
Comparative analysis of sales volume-2020
1
2
3
4
5
6
7
8
9
10
11
12
Sales volume of all countries for the month of 5th in 2020
Sales volume
Japan UK USA
Bracelet 45 278 192
Ring 6 18 15
Necklace 45 22 60
Accessor
y 9 9 26
Hair
band 129 2 52
Paraphrase This Document
Need a fresh take? Get an instant paraphrase of this document with our AI Paraphraser
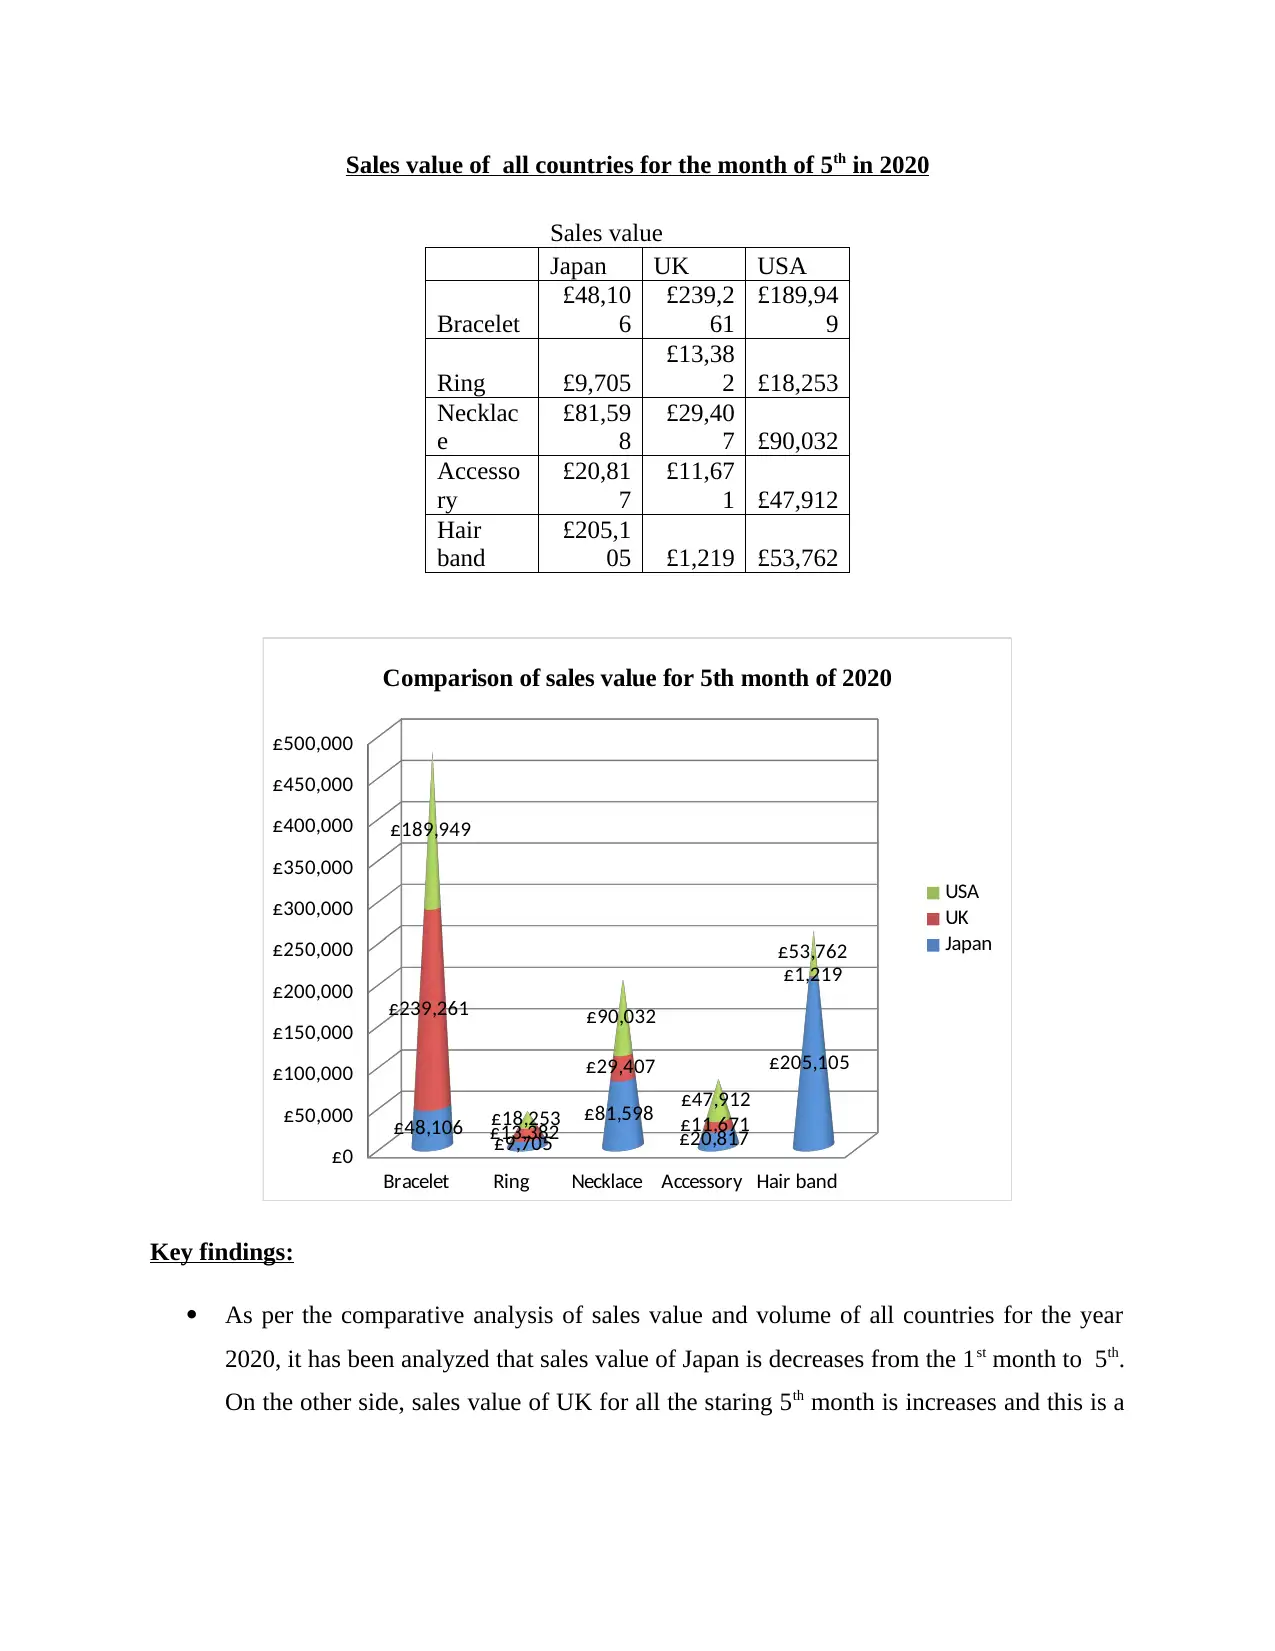
Sales value of all countries for the month of 5th in 2020
Sales value
Japan UK USA
Bracelet
£48,10
6
£239,2
61
£189,94
9
Ring £9,705
£13,38
2 £18,253
Necklac
e
£81,59
8
£29,40
7 £90,032
Accesso
ry
£20,81
7
£11,67
1 £47,912
Hair
band
£205,1
05 £1,219 £53,762
Bracelet Ring Necklace Accessory Hair band
£0
£50,000
£100,000
£150,000
£200,000
£250,000
£300,000
£350,000
£400,000
£450,000
£500,000
£48,106 £9,705
£81,598
£20,817
£205,105
£239,261
£13,382
£29,407
£11,671
£1,219
£189,949
£18,253
£90,032
£47,912
£53,762
Comparison of sales value for 5th month of 2020
USA
UK
Japan
Key findings:
As per the comparative analysis of sales value and volume of all countries for the year
2020, it has been analyzed that sales value of Japan is decreases from the 1st month to 5th.
On the other side, sales value of UK for all the staring 5th month is increases and this is a
sign of positive results. This is due to focus of marketing campaign over the sale
performance and that is why, it reflect the positive relationship between variables.
In addition to this, as per the comparative analysis, sales performance of USA is also
increases, but somehow fluctuating (Martin, Myers and Brickman, 2020). This in turn
shows that from 4th month the sale of a country is increases in 5th, 6th month respectively.
This shows sales increases when country have improved marketing campaigns that assist
to raise the performance.
On the other chart, it is also determine that sales of Bracelet within UK for the month of
5th in 2020, is higher as compared to other 3 countries. Whereas, sales of Necklace,
Accessory and Hair band is decreases from the sales of Japan, USA. This in turn reflected
that there country does not focused upon those products who have low sales, that is why,
it decreases the sales of particular products that causes adverse impact upon performance.
d) Conclusion and next steps
i) Summary and recommendations
By summing up above report, it has been concluded that the trend of data analysis has
been changed and many experts also uses range of technique in order extract or analyze the data
effectively. The changes include internet of things, 4V’s, big data and importance of data
analytic. Moreover, with the help of excel as an analytical approach extract the data and able to
answer the question. Under this, different key functions has been used like filter, pivot table and
graphs that helps to extract the data in effectual manner. In addition to this, it has been also
concluded that there is a direct impact of marketing campaigns over the sales performance of
UK because through comparative analysis table, it has been clearly examined that sales is
increases over the month of 4th, 5th and 6th respectively.
On the other side, it has been also concluded that for the 5th month of sales value and
volume, country have good sales of Bracelets and rings over necklace, hair band and accessory.
That is why, it can be stated that due to not focusing upon the marketing campaigns of specific
products, sales decreases. So, it shows the direct and positive relationship between marketing
campaign and sales performance. This in turn helps Bangles to focus upon the marketing tools so
that it creates positive impact upon sales.
Recommendations
⊘ This is a preview!⊘
Do you want full access?
Subscribe today to unlock all pages.
Trusted by 1+ million students worldwide
It is to be recommended to the country that it must focused upon different marketing
campaign like social media. It is so because it helps to determine the overall performance
and customer need which can be implemented in the near future.
Moreover, it is also suggested to use other data analysis technique like Tableau and R
programming in order to predict the future forecasting as well. Thus, it can be stated that
through effective tools, it will be easy to identify the relationship and impact over each
other variables effectively.
Also, through the data analysis it is identified that sales of accessory and hair band is low
as compared to other countries. So, it is suggested to improve the products quality and
use effective marketing channels like promote the product over Facebook, Twitter as a
social media platform etc (Graesch, Hensel-Börner and Henseler, 2020). This in turn
assists to generate the best outcomes and it may help Bangles to identify the importance
of marketing campaign over the sales performance.
Also, in order to improve the analysis for future, it is also suggested to add the data of
marketing campaign so that different inferential tools may be analyzed in order to
generate the valid relationship between variables (Castillo and et.al., 2020). With the help
of such tool it will be beneficial to identify the association so that company make extra
efforts within their marketing campaigns as well.
ii) Econometric analysis for Bangles
The above data can be analyzed through the use of excel, in which different functions
have used that helps to clean the data so that effective answers can be generated. However, to
make more valid and accurate answer of business question, Econometric analysis can be used
that helps to define the relationship between the variables and shows the effectiveness of UK
marketing campaigns (de Ruyter, Keeling and Yu, 2020). The tool is used as a statistical method
that helps to analyze the economics data and derive the impact of one independent variable over
dependent. Through this tool, Bangles may easily extract data and also predict the level of
economics variable as to test the hypothesis about their relationship in order to make effective
results.
On the other side, it is also evaluated that econometric is interesting to use as a data
analysis because it enable to extract useful information about the economic policy from the
Paraphrase This Document
Need a fresh take? Get an instant paraphrase of this document with our AI Paraphraser
gathered data set. With the help of such tool, it will be more beneficial for the Bangles to
understand the importance of marketing campaigns over the sales performance of UK. Generally,
the tool is used to determine the demand of individual consumer have an impact over the goods
and services that depend upon the income of people (Yingfan and et.al., 2020). Similarly, in the
case of determine the impact of marketing campaign upon sales performance, the tool is also
helpful to identify the key points. However in the critical side, it has been evaluated that it does
not prove causation which means that it only helps to determine the association between
variables by comparing the same with economy.
Therefore, using such data analysis tool might not helpful to make prediction but it only
assist to examine the relationship through the available dataset only. That is why, the analysis
tool is criticized due to its sensitivity of empirical results to different factors like model
specification. That is why, some situation, the results are become so sensitive which cannot help
to realize the data in accurate manner. Overall it can be stated that through use of such data
analysis, Bangles may determine the relationship but it does not assist to determine the
prediction (Pernamasari, 2020). Therefore, it might lead to econometric problems as well, when
company wants many assumption which has to satisfied through this data analysis tool and this
may lead to econometric problems as well. Also, the tool is beneficial to determine the
consumption pattern because it is also linked with the economy and that is why, it might only
help to determine the relationship between UK marketing campaign over the sales performance,
neither prediction nor future outcomes.
Key finding through presentation
Slide 1
⊘ This is a preview!⊘
Do you want full access?
Subscribe today to unlock all pages.
Trusted by 1+ million students worldwide
1 out of 20
Related Documents


Your All-in-One AI-Powered Toolkit for Academic Success.
+13062052269
info@desklib.com
Available 24*7 on WhatsApp / Email
![[object Object]](/_next/static/media/star-bottom.7253800d.svg)
Unlock your academic potential
Copyright © 2020–2026 A2Z Services. All Rights Reserved. Developed and managed by ZUCOL.