Data Driven Decisions for Business: UK Bangle Sector Report
VerifiedAdded on 2023/06/04
|15
|2964
|354
Report
AI Summary
This report provides a comprehensive analysis of the UK bangle sector, focusing on data-driven decision-making for BIJ. It begins with an introduction and project plan, followed by a discussion of data quality issues and their remedies. The core of the report involves detailed data analysis and commentary, using tables to present sales data from Japan, the UK, and the USA across multiple years (2018-2020), broken down by month and product type (bangles, accessories, etc.). The analysis explores sales volume, value, and market share, highlighting trends and variations. The report also includes data charting and commentary to visualize key findings. Finally, the report concludes with recommendations for BIJ to improve its performance, enhance its marketing strategies, and achieve its business goals, emphasizing the importance of predictive analytics, customer behavior analysis, and competitive analysis. The report aims to help BIJ make informed decisions and achieve long-term sustainability in the competitive bangle market.
Data Driven Decisions for
Business
Business
Paraphrase This Document
Need a fresh take? Get an instant paraphrase of this document with our AI Paraphraser

Contents
MAIN BODY.................................................................................................................................................3
Introduction and Project plan...................................................................................................................3
Data qualities issues and their remedies..................................................................................................4
Data Analysis and Commentary..............................................................................................................6
Data Charting and Commentary............................................................................................................12
Conclusion and Recommendation.........................................................................................................13
REFERENCES..............................................................................................................................................15
⊘ This is a preview!⊘
Do you want full access?
Subscribe today to unlock all pages.
Trusted by 1+ million students worldwide
MAIN BODY
Introduction and Project plan.
Making decisions is one of the most important and crucial steps for a business operating in the
current market environment. To build and retain a market edge in current economy and cross-
industry, corporate leaders must overcome numerous obstacles (Huang, et.al. 2019).
This study's goal is to analyze the development of the bangle sector in the UK as well as latest
situation. In addition, it comprises data evaluation and analysis to help a BIJ develop and flourish
in the sector within which it works. Additionally, each report contains improvement suggestions
that could benefit the company over the lengthy period.
The impact of a promotional campaign run in the UK on the overall sales of Bangles Global
Jewelry is also discussed in this study. This report explains predictive analytics, which can
increase BIJ sales on the international market. Data analytics include:
Observing client activity and how they react in terms of revenue
Regular monitoring of the creation process, which boosts sales.
The consequences of social media on an organization's sales results.
Pay attention to email marketing tactics
Research competitive analysis as well, paying attention to their strengths and faults.
The pricing model should be periodically and in accordance with market demands
optimized.
It is crucial for BIJ to solve the aforementioned challenges in order to hit the appropriate
marketing objective and meet the company's goals and objectives. (Joshi, 2019).
The profitability, customer employee retention, increased revenues, company responsible by the
organisation on a client-by-client premise, and service quality can all be considered key value is
reflected in the bangles sector. They can be described as follows: -
Additional profits includes: Jewelleries come in a range of materials, including plastic,
steel, wood, and glass. The company must first choose what kinds of bangles to sell in
Paraphrase This Document
Need a fresh take? Get an instant paraphrase of this document with our AI Paraphraser
order to manage the market effectively since styles fluctuate with the seasons, holidays,
and fashions.
Income generated on a per-customer premise: This could be solved by a thorough
analysis of client conduct and character in relation to bangles (Kivimäki and Meriluoto,
2018). The user's age range also has a significant impact on increasing the organization's
sales.
Profitability: Because there are so many separate types inside the market, the profitability
for manufacturers and sellers of bangles can vary greatly. The total price of bangles is
significantly influenced by wage costs in addition to price levels for various types of
bracelets.
Client retention rate: This factor is very important to any business survival. Client
retention rates vary depending on the cost an organisation charges and the calibre of the
product it offers to its clients. Retention rates of 80% or more are typically seen as
favorable.
If such aforementioned factors are handled appropriately, BIJ income can raise in the long run,
which would bring about sustainability for the company.
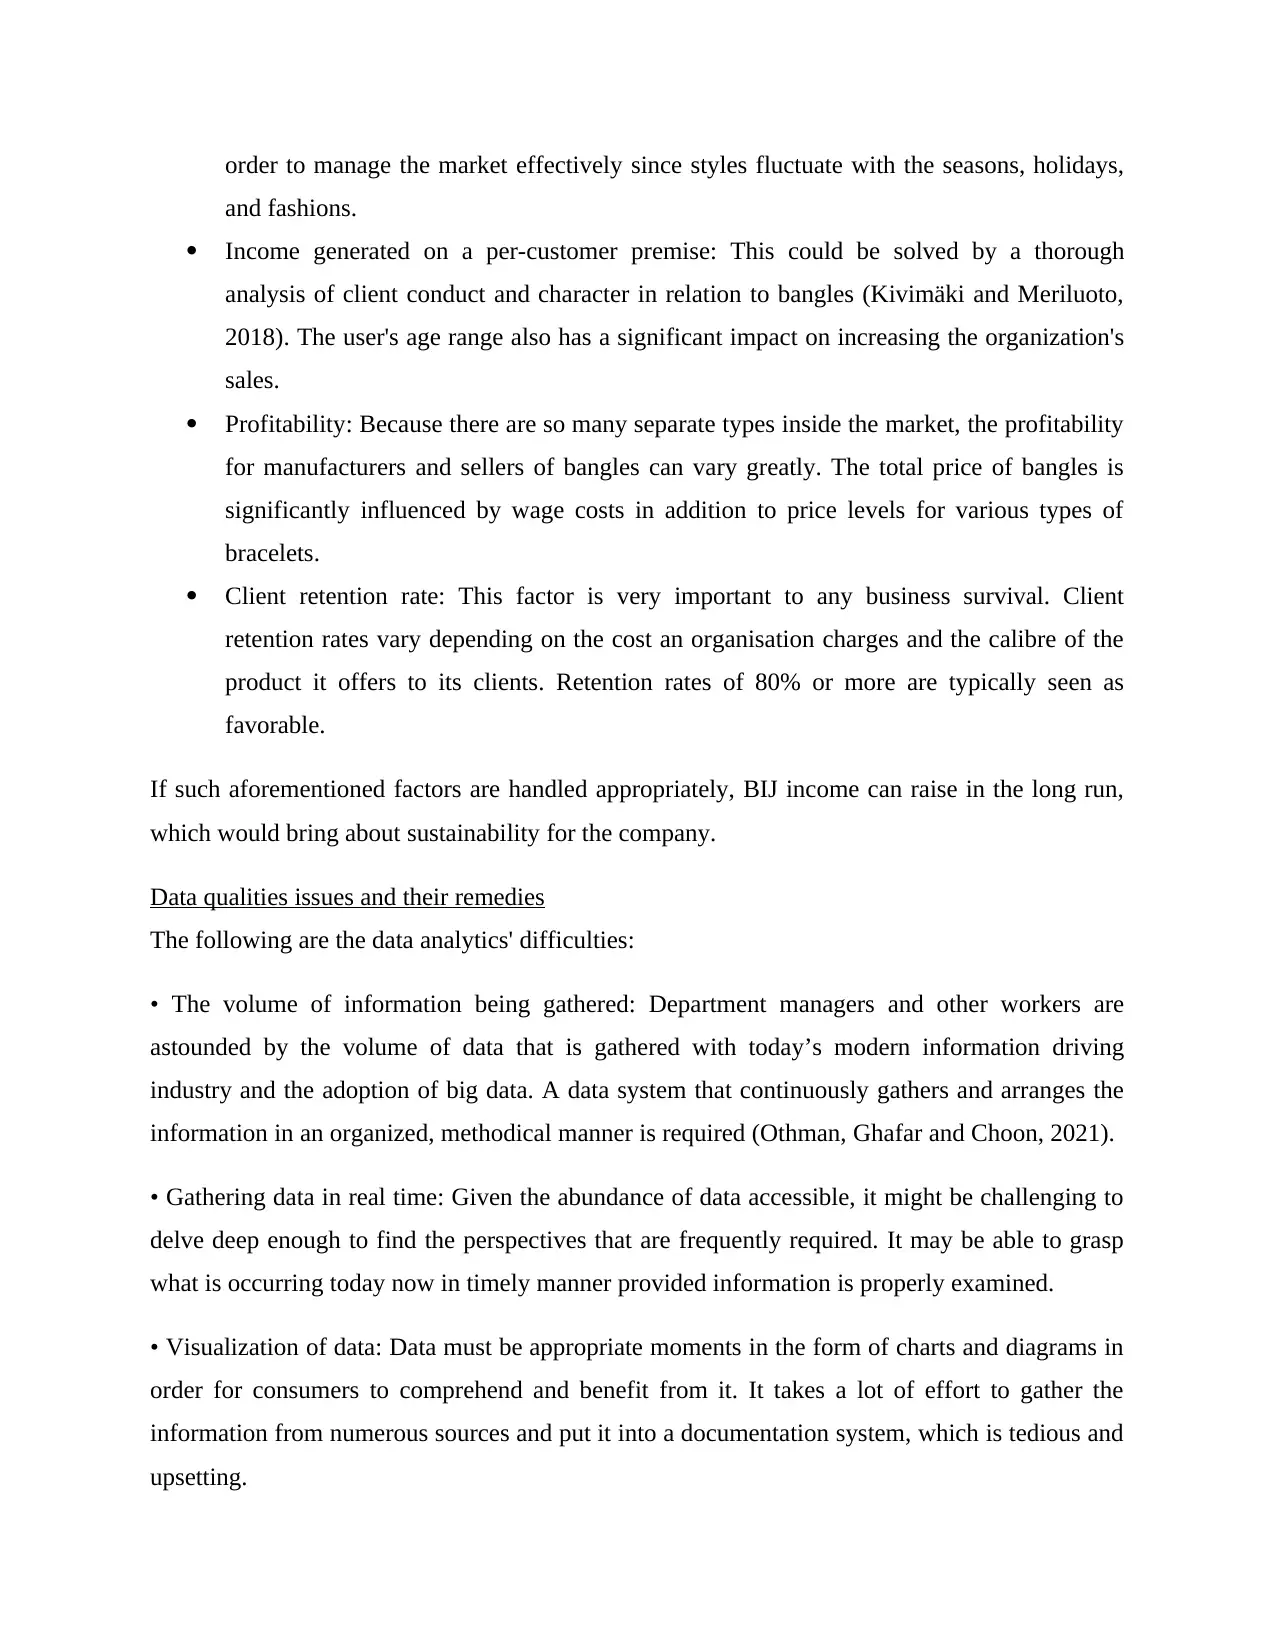
Data qualities issues and their remedies
The following are the data analytics' difficulties:
• The volume of information being gathered: Department managers and other workers are
astounded by the volume of data that is gathered with today’s modern information driving
industry and the adoption of big data. A data system that continuously gathers and arranges the
information in an organized, methodical manner is required (Othman, Ghafar and Choon, 2021).
• Gathering data in real time: Given the abundance of data accessible, it might be challenging to
delve deep enough to find the perspectives that are frequently required. It may be able to grasp
what is occurring today now in timely manner provided information is properly examined.
• Visualization of data: Data must be appropriate moments in the form of charts and diagrams in
order for consumers to comprehend and benefit from it. It takes a lot of effort to gather the
information from numerous sources and put it into a documentation system, which is tedious and
upsetting.
and fashions.
Income generated on a per-customer premise: This could be solved by a thorough
analysis of client conduct and character in relation to bangles (Kivimäki and Meriluoto,
2018). The user's age range also has a significant impact on increasing the organization's
sales.
Profitability: Because there are so many separate types inside the market, the profitability
for manufacturers and sellers of bangles can vary greatly. The total price of bangles is
significantly influenced by wage costs in addition to price levels for various types of
bracelets.
Client retention rate: This factor is very important to any business survival. Client
retention rates vary depending on the cost an organisation charges and the calibre of the
product it offers to its clients. Retention rates of 80% or more are typically seen as
favorable.
If such aforementioned factors are handled appropriately, BIJ income can raise in the long run,
which would bring about sustainability for the company.
Data qualities issues and their remedies
The following are the data analytics' difficulties:
• The volume of information being gathered: Department managers and other workers are
astounded by the volume of data that is gathered with today’s modern information driving
industry and the adoption of big data. A data system that continuously gathers and arranges the
information in an organized, methodical manner is required (Othman, Ghafar and Choon, 2021).
• Gathering data in real time: Given the abundance of data accessible, it might be challenging to
delve deep enough to find the perspectives that are frequently required. It may be able to grasp
what is occurring today now in timely manner provided information is properly examined.
• Visualization of data: Data must be appropriate moments in the form of charts and diagrams in
order for consumers to comprehend and benefit from it. It takes a lot of effort to gather the
information from numerous sources and put it into a documentation system, which is tedious and
upsetting.
• Data from several sources: The next challenge is attempting to evaluate and arrange data that
has been obtained from variety of sources in one location. Perhaps the organization's staff may
not comprehend this, which results in an analysis that is partial and wrong (Shelton-Davis,
2018). Thoroughly synthesizing the enormous amount of data takes time and restricts
perspectives to what is only witnessed.
• Pressure from top management: Since managing risk is more well-known in companies, the
manager or leader expects greater performance from those responsible for risk mitigation. They
estimated magnitude and more frequent results from the individual as well as a significant
volume of reporting on all kinds of information.
The following methods can be used by BIJ to handle such issues in a systematic manner: -
Fix the information in the data source by doing the following: By cleansing up the initial
resource on a constant schedule, proper data problems can be resolved. This is required since
using incorrect or insufficient data sources would contaminate the network and lead to subpar
outcomes. The only method to guarantee an improved customer service is to correct the data in
the data repository.
To resolve the data issues, upgrade the source system: - Although it occasionally sounds like the
strategy above, it is wholly separate. It means that the data collection system's sending
information can be configured to proactively cleanup information when it is entered into the
database. (Stratton, 2020). In which the sure that the system must be correctly configured, such
as a webpage or another type of system, it is often recommended.
Utilize accurate identification by: The most effective way for addressing the quality problems is
also the most complex one. The fact that several users of the system contain several entries for a
new client and that these information aren't associated with one another in the right order is one
of the most significant problems.
Data Analysis and Commentary
Table A
Table1: It describes the sales of different product in 2018 in Japan, UK and USA.
⊘ This is a preview!⊘
Do you want full access?
Subscribe today to unlock all pages.
Trusted by 1+ million students worldwide

2018 Japan UK USA
Month
s
Sales
Volume
Sales
Value
Sales
Volume
Sales
Value
Sales
Volume
Sales
Value
1 374 561141 175
1,42,3
61 371
4,24,4
44
2 410 597202 190 147667 361 432512
3 404 588628 212 180837 269 290457
4 313 4,59,900 £235 173460 199 216890
5 287 4,46,996 £190 175217 286 354910
6 415 6,32,293 £239 218396 378 494758
7 252 3,71,829 £179 153641 323 382543
8 261 3,83,935 £184 153130 322 353225
9 519 7,48,629 £251 219549 474 412673
10 254 3,62,264 £111 91849 222 235354
11 247 3,46,980 £123 98772 319 346339
12 433 6,21,268 £214 178127 430 475303
Total 4169
61,21,0
65 £2,303
19,33,00
6 3954
44,19,40
8
From the data earlier in this section, it can be deduced that Japan's overall sales in 2018 were
higher than those of the UK and USA, which were 4085. Despite the fact that Japan's market
share from the US and UK in 2018 was £ 6002613. Therefore, it may be inferred that the total
revenue reflects on the nation's sales profits.
Paraphrase This Document
Need a fresh take? Get an instant paraphrase of this document with our AI Paraphraser
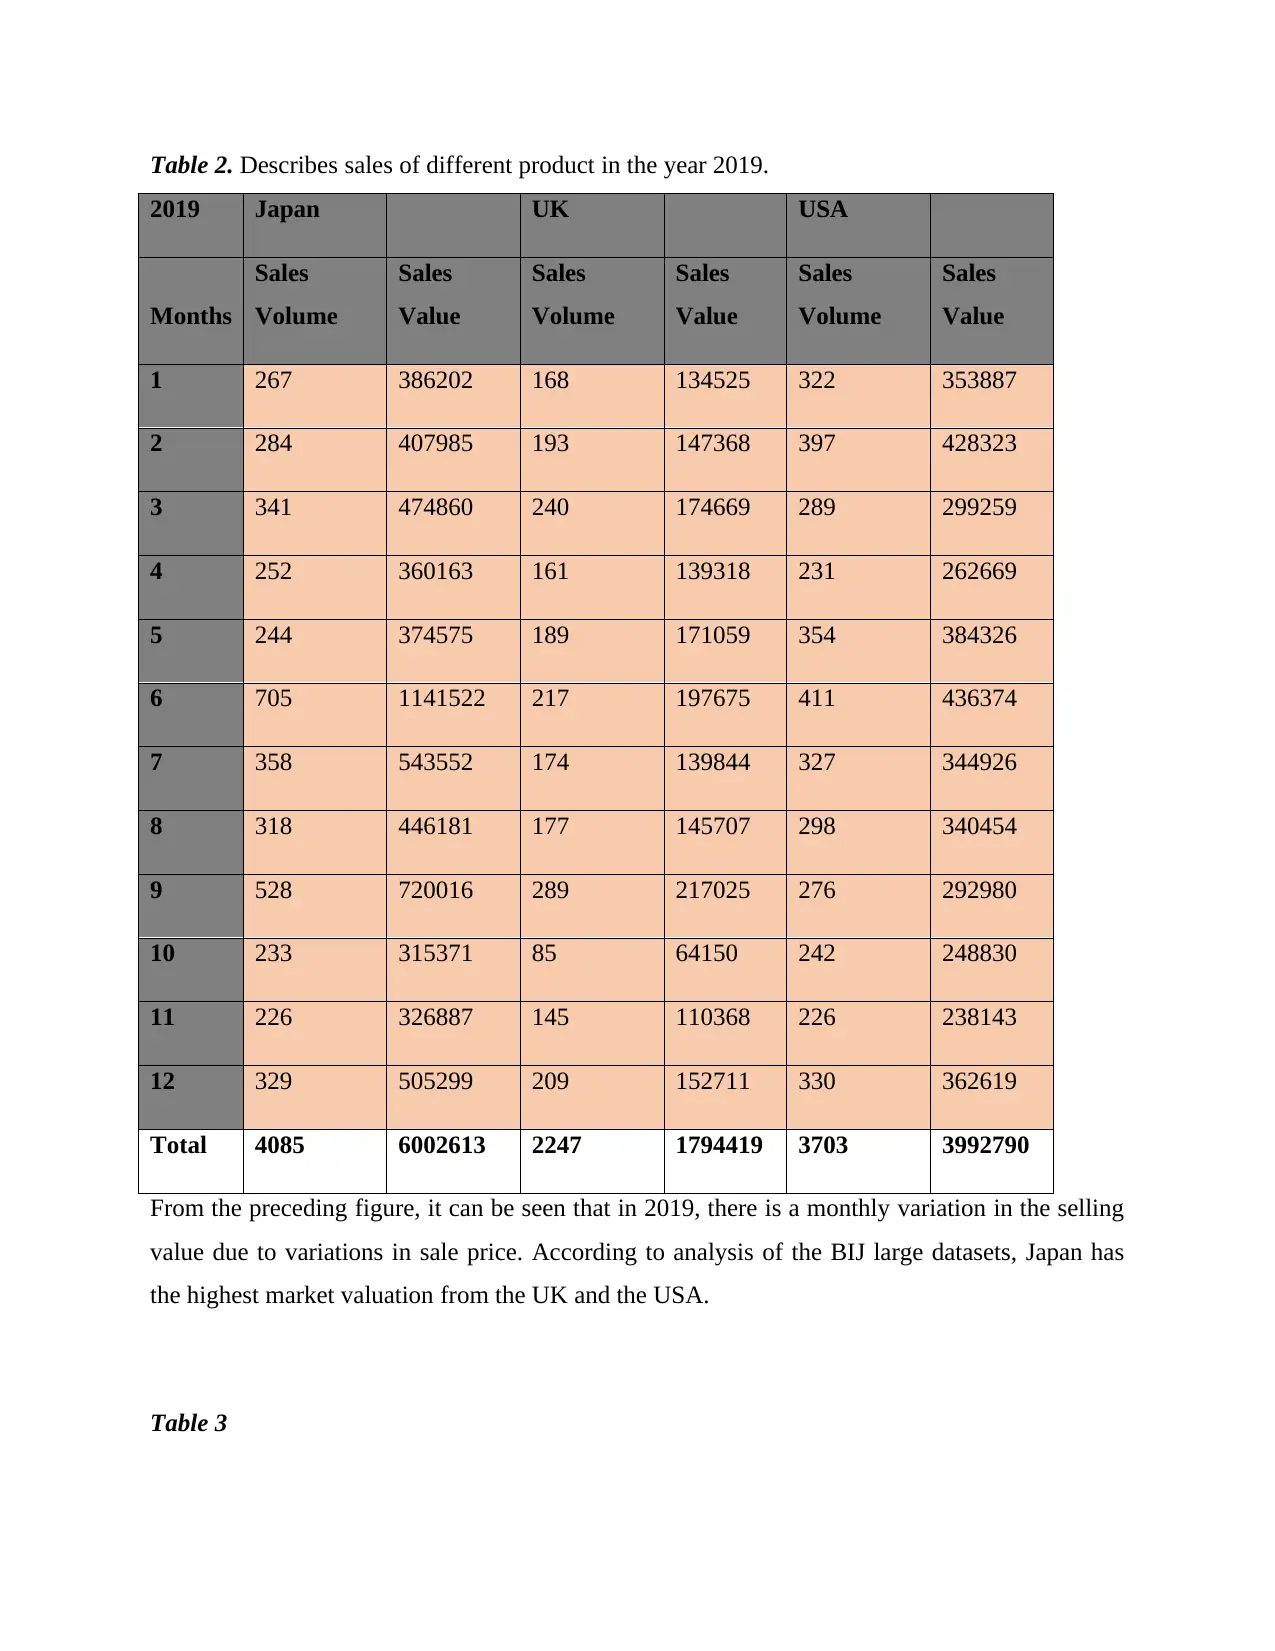
Table 2. Describes sales of different product in the year 2019.
2019 Japan UK USA
Months
Sales
Volume
Sales
Value
Sales
Volume
Sales
Value
Sales
Volume
Sales
Value
1 267 386202 168 134525 322 353887
2 284 407985 193 147368 397 428323
3 341 474860 240 174669 289 299259
4 252 360163 161 139318 231 262669
5 244 374575 189 171059 354 384326
6 705 1141522 217 197675 411 436374
7 358 543552 174 139844 327 344926
8 318 446181 177 145707 298 340454
9 528 720016 289 217025 276 292980
10 233 315371 85 64150 242 248830
11 226 326887 145 110368 226 238143
12 329 505299 209 152711 330 362619
Total 4085 6002613 2247 1794419 3703 3992790
From the preceding figure, it can be seen that in 2019, there is a monthly variation in the selling
value due to variations in sale price. According to analysis of the BIJ large datasets, Japan has
the highest market valuation from the UK and the USA.
Table 3
2020 Japan UK USA
Month
s
Sales
Volume
Sales
Value
Sales
Volume
Sales
Value
Sales
Volume
Sales
Value
1 233 354283 £161 127200 277 313251
2 263 417178 175 146302 377 468637
3 251 403338 240 191838 304 352655
4 210 326486 192 161261 231 274772
5 234 365330 329 294939 345 399908
6 380 575670 362 296863 492 573773
7 186 272290 258 230264 410 460591
8 190 275843 230 183316 285 323874
9 299 418259 237 259287 420 474370
10 131 171411 134 125181 236 262810
11 174 230386 151 138720 269 304746
12 231 320956 114 104254 188 236079
Total 2782 4131430 £2,583 2259425 3834 4445466
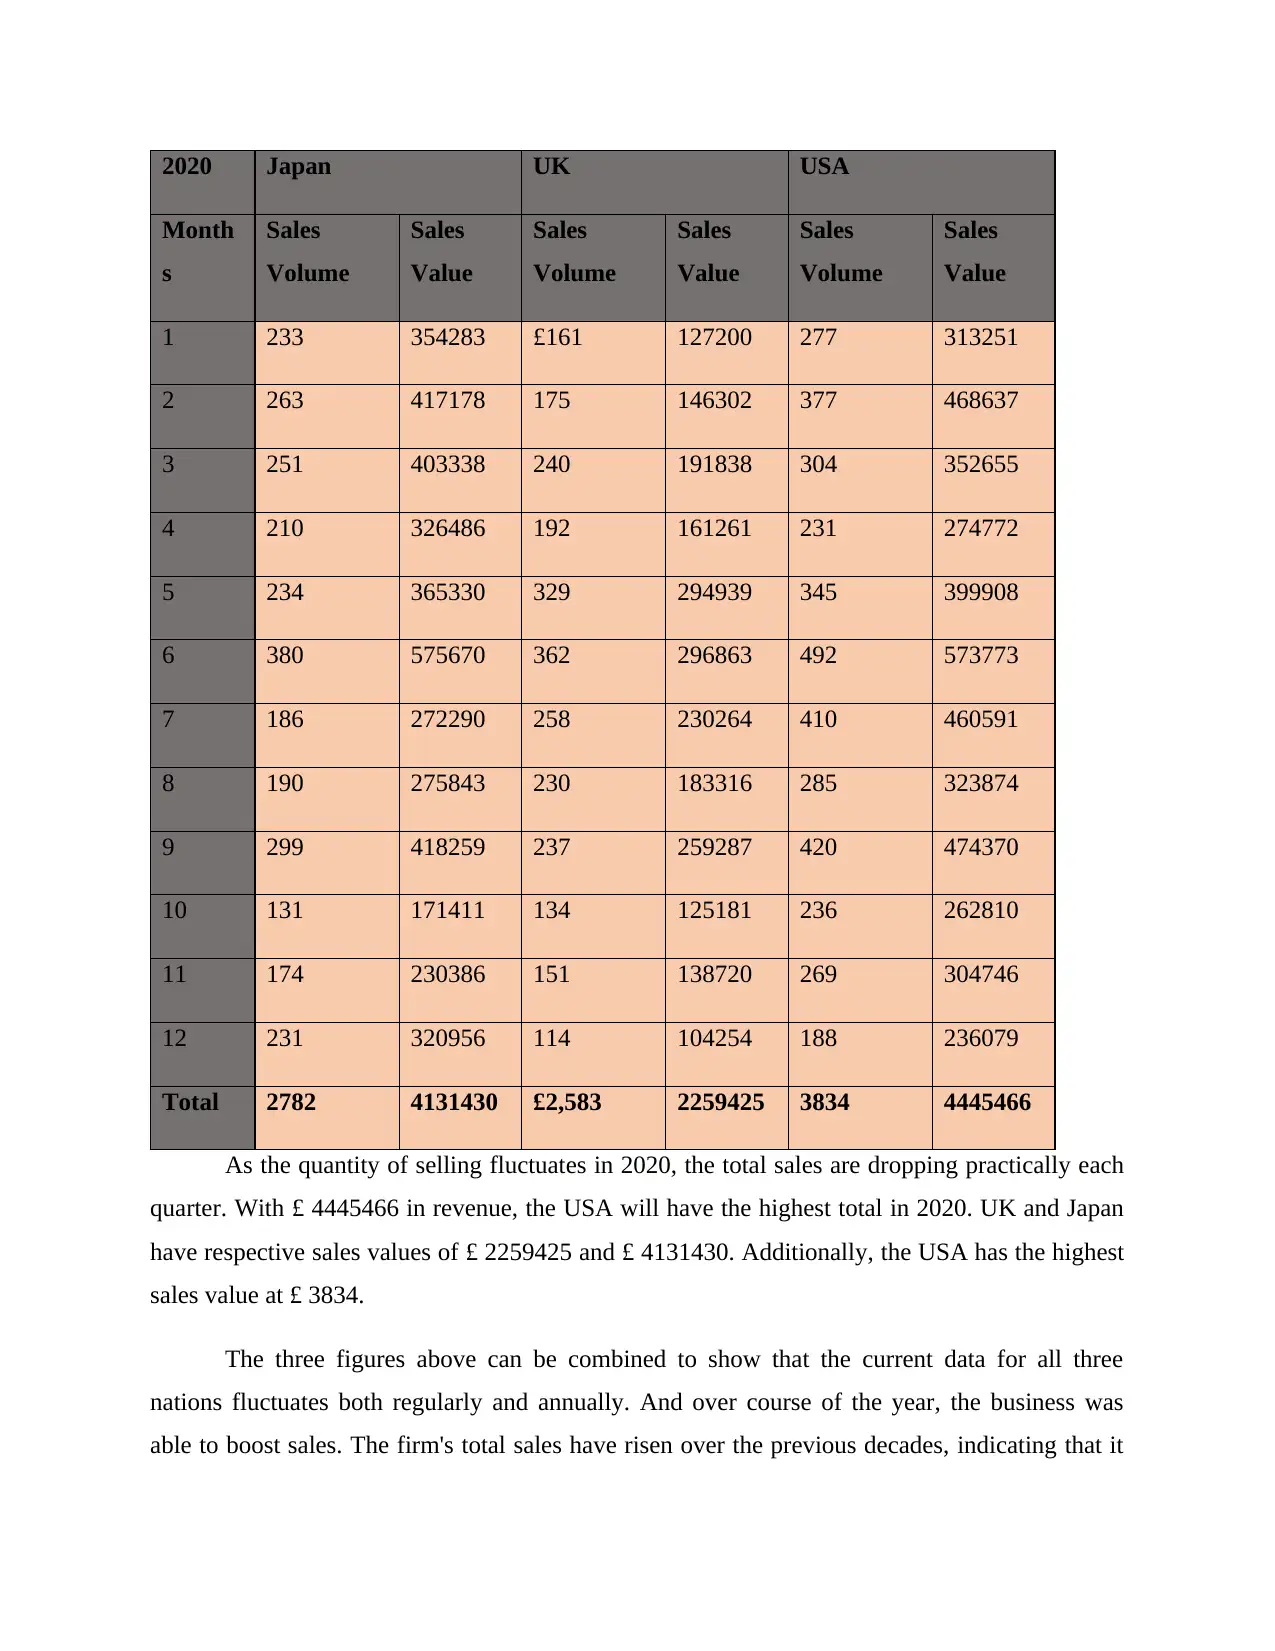
As the quantity of selling fluctuates in 2020, the total sales are dropping practically each
quarter. With £ 4445466 in revenue, the USA will have the highest total in 2020. UK and Japan
have respective sales values of £ 2259425 and £ 4131430. Additionally, the USA has the highest
sales value at £ 3834.
The three figures above can be combined to show that the current data for all three
nations fluctuates both regularly and annually. And over course of the year, the business was
able to boost sales. The firm's total sales have risen over the previous decades, indicating that it
Month
s
Sales
Volume
Sales
Value
Sales
Volume
Sales
Value
Sales
Volume
Sales
Value
1 233 354283 £161 127200 277 313251
2 263 417178 175 146302 377 468637
3 251 403338 240 191838 304 352655
4 210 326486 192 161261 231 274772
5 234 365330 329 294939 345 399908
6 380 575670 362 296863 492 573773
7 186 272290 258 230264 410 460591
8 190 275843 230 183316 285 323874
9 299 418259 237 259287 420 474370
10 131 171411 134 125181 236 262810
11 174 230386 151 138720 269 304746
12 231 320956 114 104254 188 236079
Total 2782 4131430 £2,583 2259425 3834 4445466
As the quantity of selling fluctuates in 2020, the total sales are dropping practically each
quarter. With £ 4445466 in revenue, the USA will have the highest total in 2020. UK and Japan
have respective sales values of £ 2259425 and £ 4131430. Additionally, the USA has the highest
sales value at £ 3834.
The three figures above can be combined to show that the current data for all three
nations fluctuates both regularly and annually. And over course of the year, the business was
able to boost sales. The firm's total sales have risen over the previous decades, indicating that it
⊘ This is a preview!⊘
Do you want full access?
Subscribe today to unlock all pages.
Trusted by 1+ million students worldwide
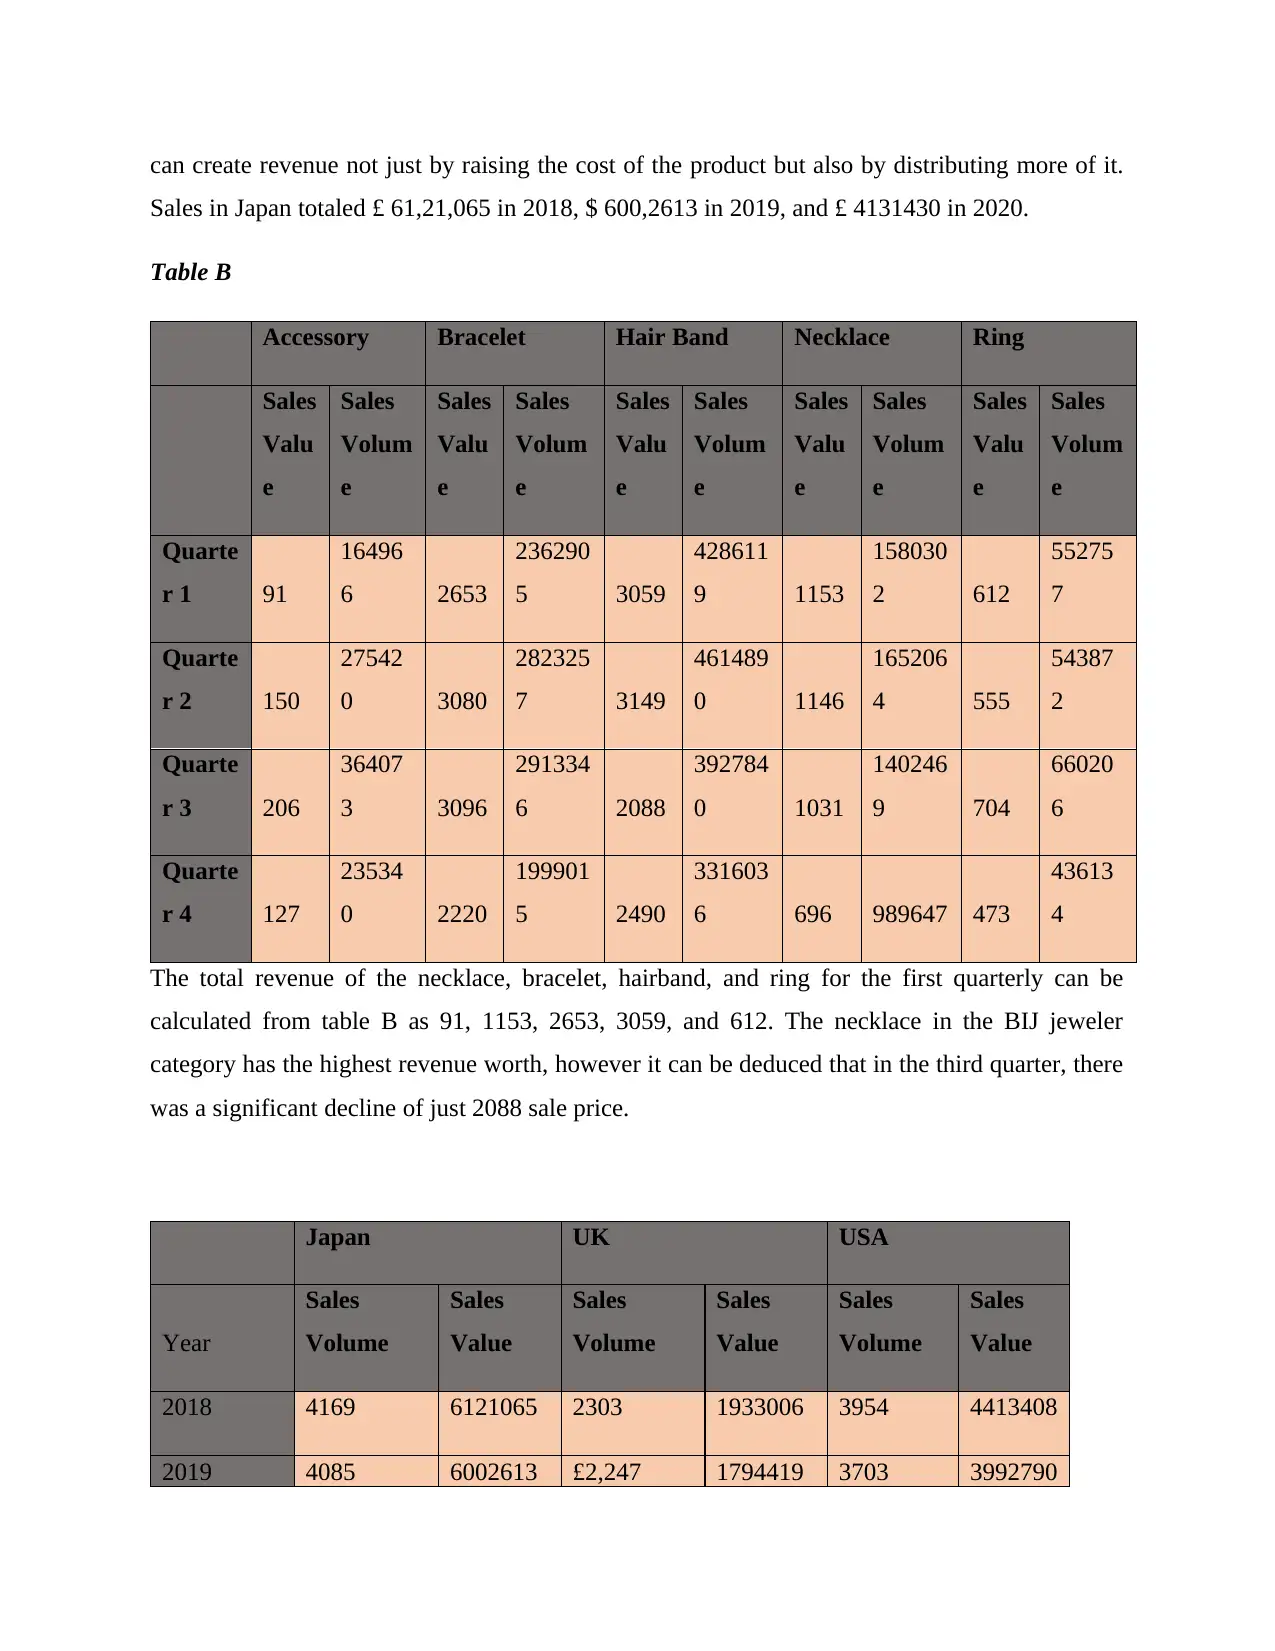
can create revenue not just by raising the cost of the product but also by distributing more of it.
Sales in Japan totaled £ 61,21,065 in 2018, $ 600,2613 in 2019, and £ 4131430 in 2020.
Table B
Accessory Bracelet Hair Band Necklace Ring
Sales
Valu
e
Sales
Volum
e
Sales
Valu
e
Sales
Volum
e
Sales
Valu
e
Sales
Volum
e
Sales
Valu
e
Sales
Volum
e
Sales
Valu
e
Sales
Volum
e
Quarte
r 1 91
16496
6 2653
236290
5 3059
428611
9 1153
158030
2 612
55275
7
Quarte
r 2 150
27542
0 3080
282325
7 3149
461489
0 1146
165206
4 555
54387
2
Quarte
r 3 206
36407
3 3096
291334
6 2088
392784
0 1031
140246
9 704
66020
6
Quarte
r 4 127
23534
0 2220
199901
5 2490
331603
6 696 989647 473
43613
4
The total revenue of the necklace, bracelet, hairband, and ring for the first quarterly can be
calculated from table B as 91, 1153, 2653, 3059, and 612. The necklace in the BIJ jeweler
category has the highest revenue worth, however it can be deduced that in the third quarter, there
was a significant decline of just 2088 sale price.
Japan UK USA
Year
Sales
Volume
Sales
Value
Sales
Volume
Sales
Value
Sales
Volume
Sales
Value
2018 4169 6121065 2303 1933006 3954 4413408
2019 4085 6002613 £2,247 1794419 3703 3992790
Paraphrase This Document
Need a fresh take? Get an instant paraphrase of this document with our AI Paraphraser
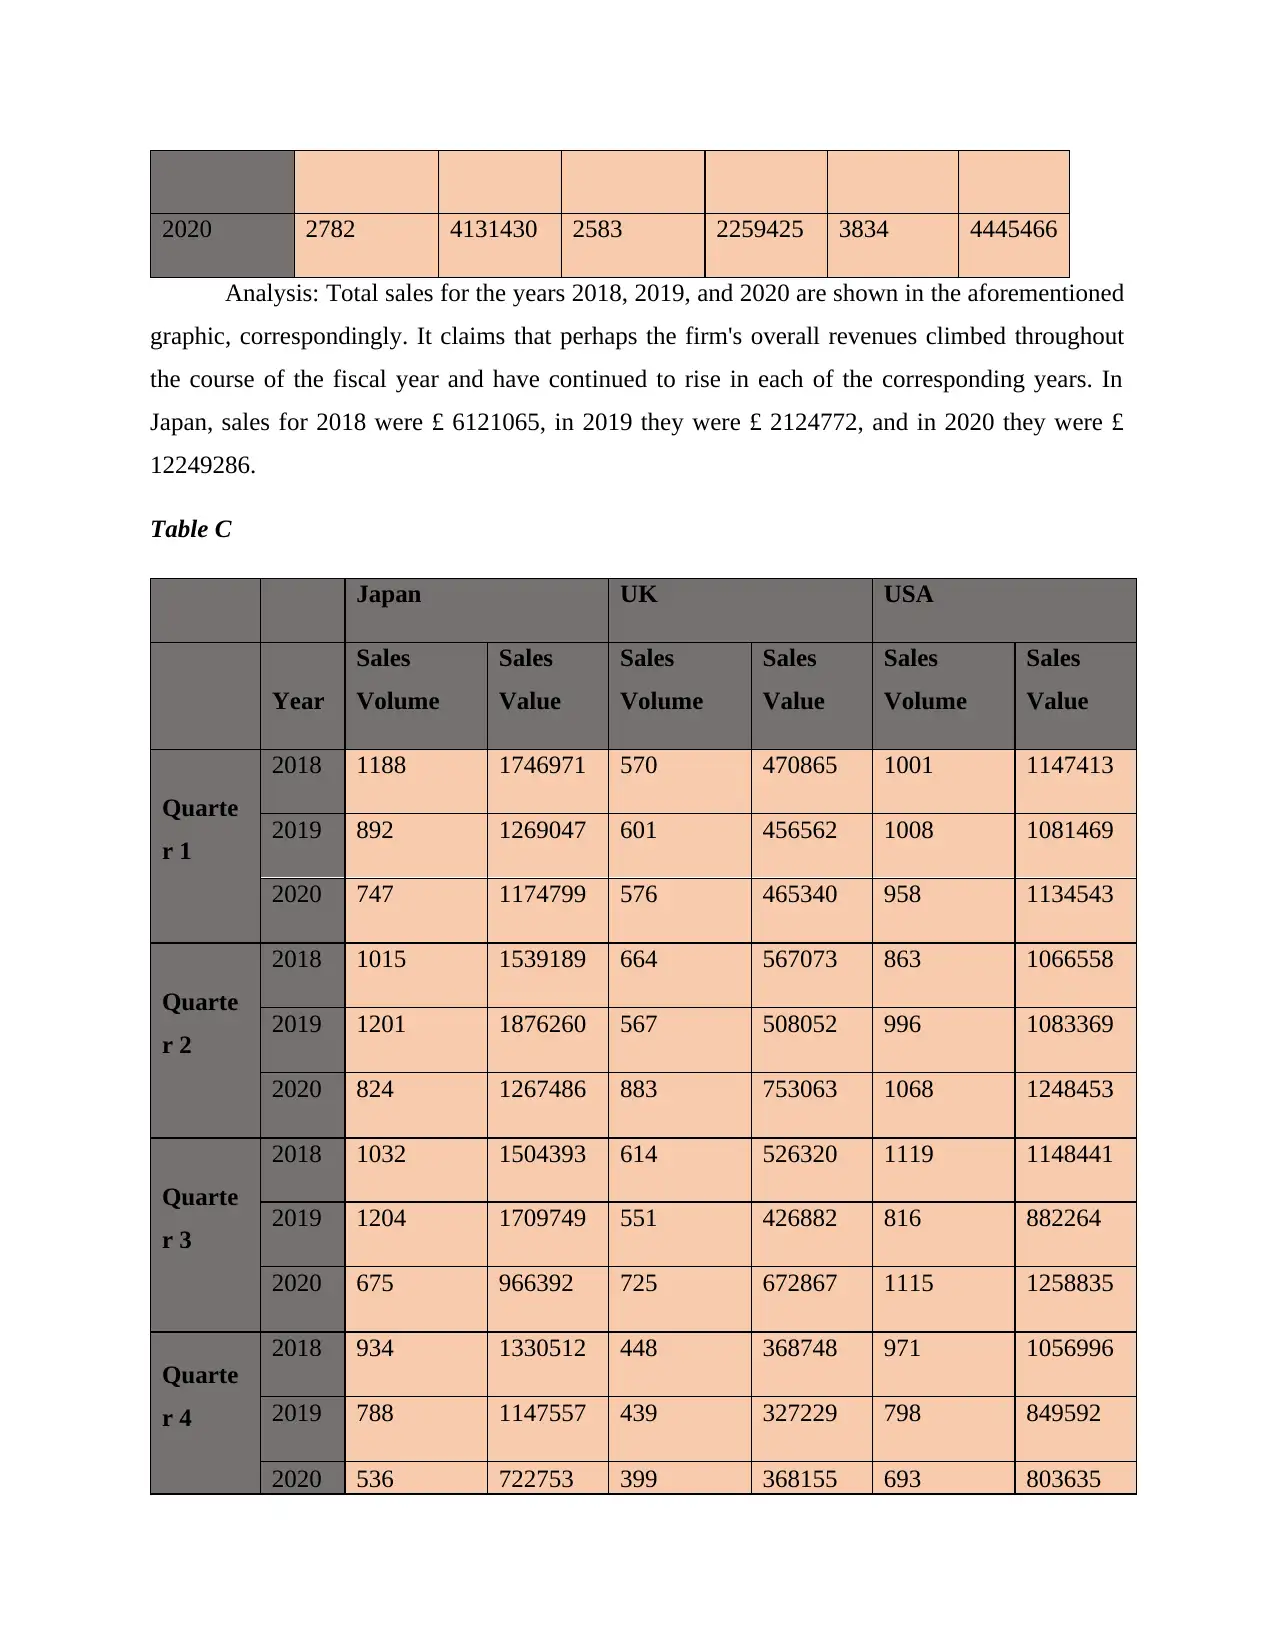
2020 2782 4131430 2583 2259425 3834 4445466
Analysis: Total sales for the years 2018, 2019, and 2020 are shown in the aforementioned
graphic, correspondingly. It claims that perhaps the firm's overall revenues climbed throughout
the course of the fiscal year and have continued to rise in each of the corresponding years. In
Japan, sales for 2018 were £ 6121065, in 2019 they were £ 2124772, and in 2020 they were £
12249286.
Table C
Japan UK USA
Year
Sales
Volume
Sales
Value
Sales
Volume
Sales
Value
Sales
Volume
Sales
Value
Quarte
r 1
2018 1188 1746971 570 470865 1001 1147413
2019 892 1269047 601 456562 1008 1081469
2020 747 1174799 576 465340 958 1134543
Quarte
r 2
2018 1015 1539189 664 567073 863 1066558
2019 1201 1876260 567 508052 996 1083369
2020 824 1267486 883 753063 1068 1248453
Quarte
r 3
2018 1032 1504393 614 526320 1119 1148441
2019 1204 1709749 551 426882 816 882264
2020 675 966392 725 672867 1115 1258835
Quarte
r 4
2018 934 1330512 448 368748 971 1056996
2019 788 1147557 439 327229 798 849592
2020 536 722753 399 368155 693 803635
The aforementioned table provides an examination of the third quarter's sales volume in
Japan relative to all other years. According to one interpretation, the various time series from the
year have been matched to analyze the various goods. The data indicates that the numbers have
improved with time. Data indicates that revenues of various products have risen over the years
and have shown an actual improvement.
Data Charting and Commentary.
2018 2019 2020
0
1000000
2000000
3000000
4000000
5000000
6000000
7000000
Comparison of Sales value
Japan UK USA
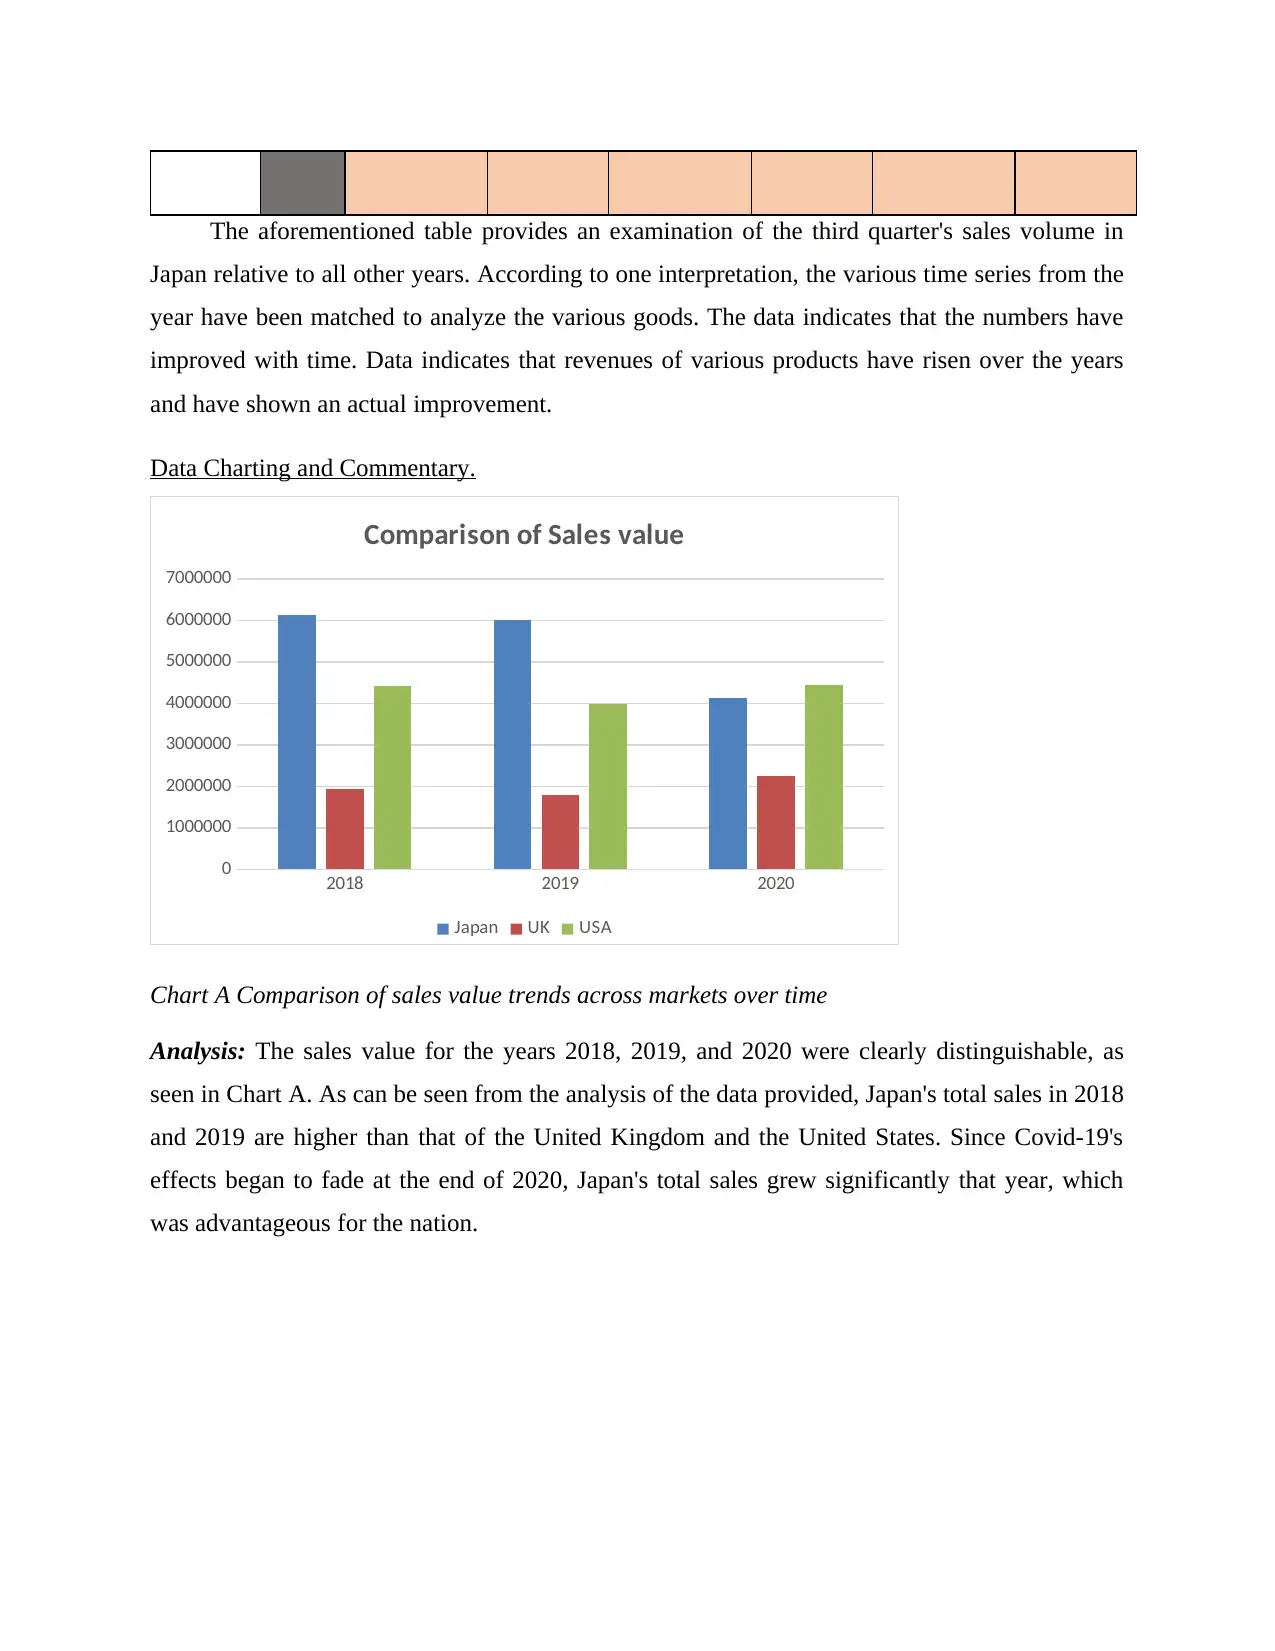
Chart A Comparison of sales value trends across markets over time
Analysis: The sales value for the years 2018, 2019, and 2020 were clearly distinguishable, as
seen in Chart A. As can be seen from the analysis of the data provided, Japan's total sales in 2018
and 2019 are higher than that of the United Kingdom and the United States. Since Covid-19's
effects began to fade at the end of 2020, Japan's total sales grew significantly that year, which
was advantageous for the nation.
Japan relative to all other years. According to one interpretation, the various time series from the
year have been matched to analyze the various goods. The data indicates that the numbers have
improved with time. Data indicates that revenues of various products have risen over the years
and have shown an actual improvement.
Data Charting and Commentary.
2018 2019 2020
0
1000000
2000000
3000000
4000000
5000000
6000000
7000000
Comparison of Sales value
Japan UK USA
Chart A Comparison of sales value trends across markets over time
Analysis: The sales value for the years 2018, 2019, and 2020 were clearly distinguishable, as
seen in Chart A. As can be seen from the analysis of the data provided, Japan's total sales in 2018
and 2019 are higher than that of the United Kingdom and the United States. Since Covid-19's
effects began to fade at the end of 2020, Japan's total sales grew significantly that year, which
was advantageous for the nation.
⊘ This is a preview!⊘
Do you want full access?
Subscribe today to unlock all pages.
Trusted by 1+ million students worldwide
1 out of 15
Related Documents


Your All-in-One AI-Powered Toolkit for Academic Success.
+13062052269
info@desklib.com
Available 24*7 on WhatsApp / Email
![[object Object]](/_next/static/media/star-bottom.7253800d.svg)
Unlock your academic potential
Copyright © 2020–2026 A2Z Services. All Rights Reserved. Developed and managed by ZUCOL.