Data-Driven Analysis of Bangles International Jewellery Sales
VerifiedAdded on 2023/06/12
|14
|2572
|216
Report
AI Summary
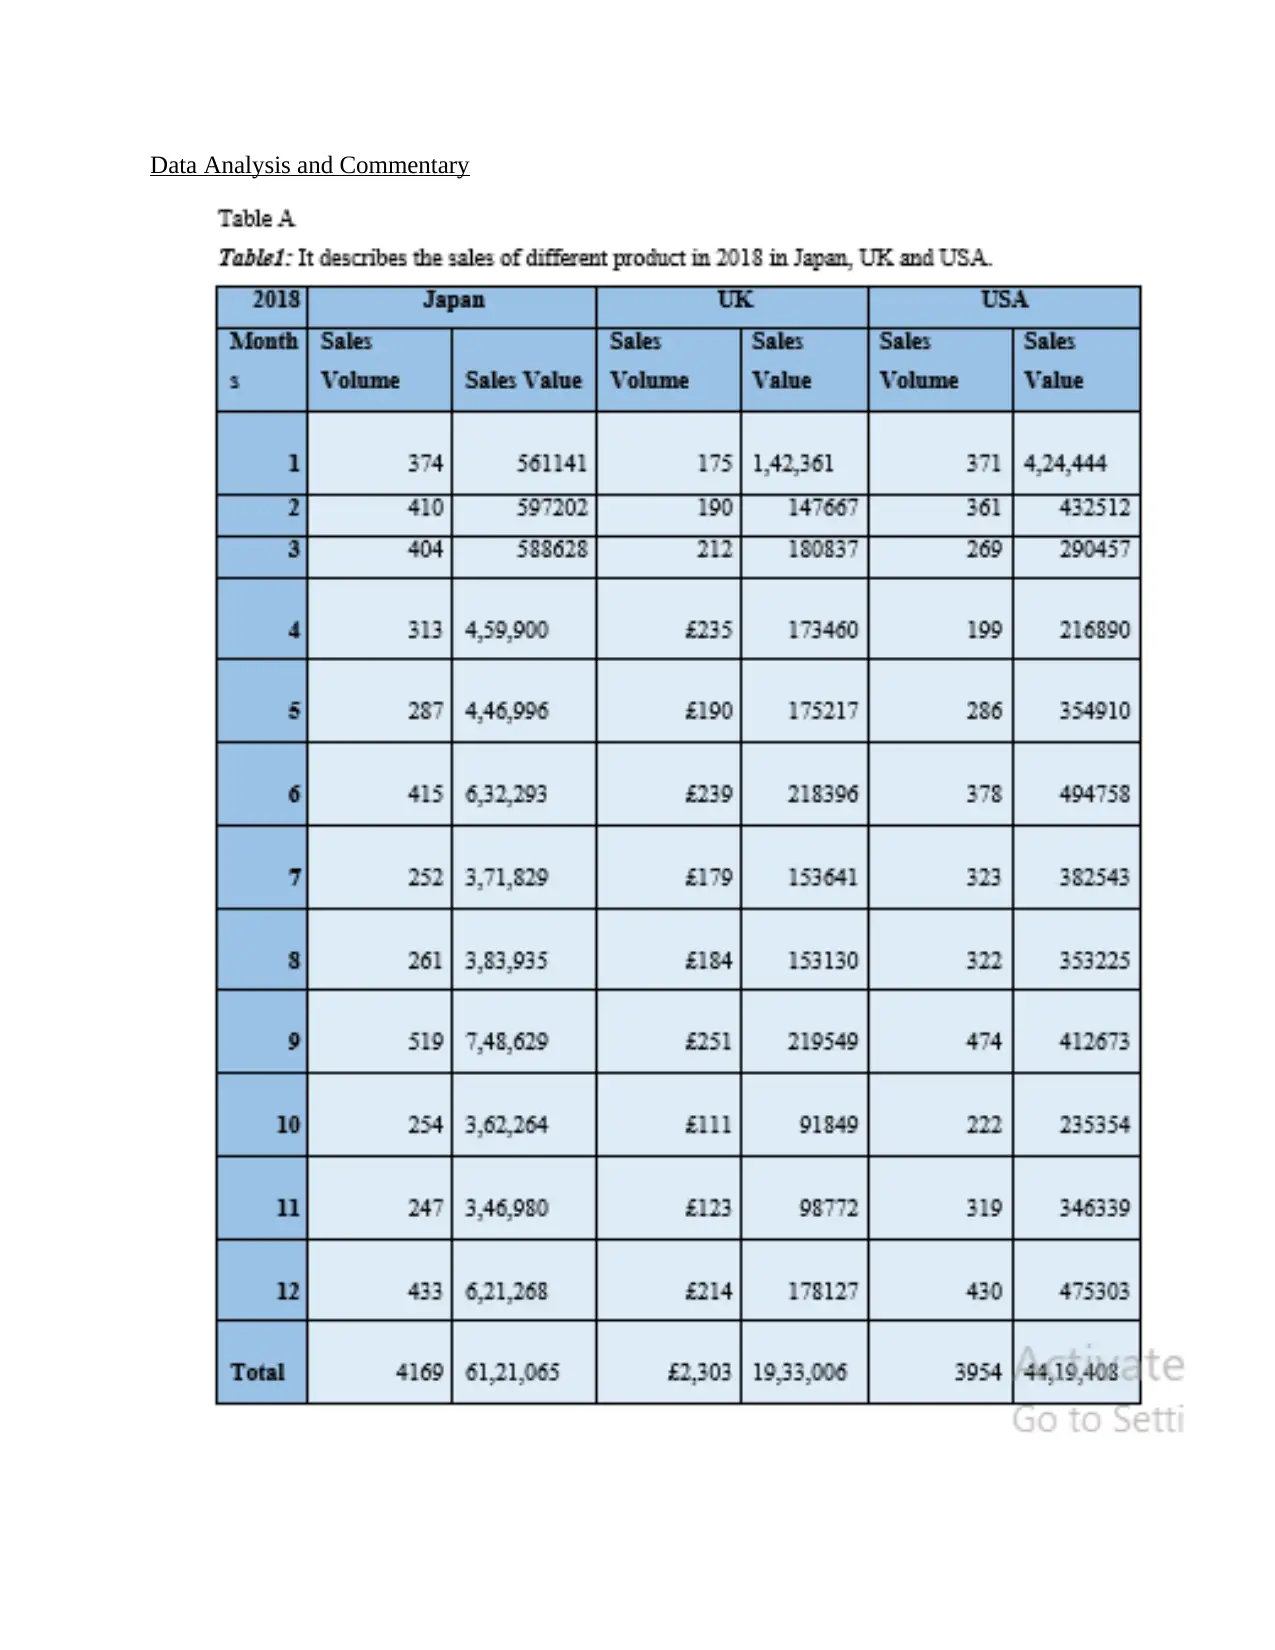
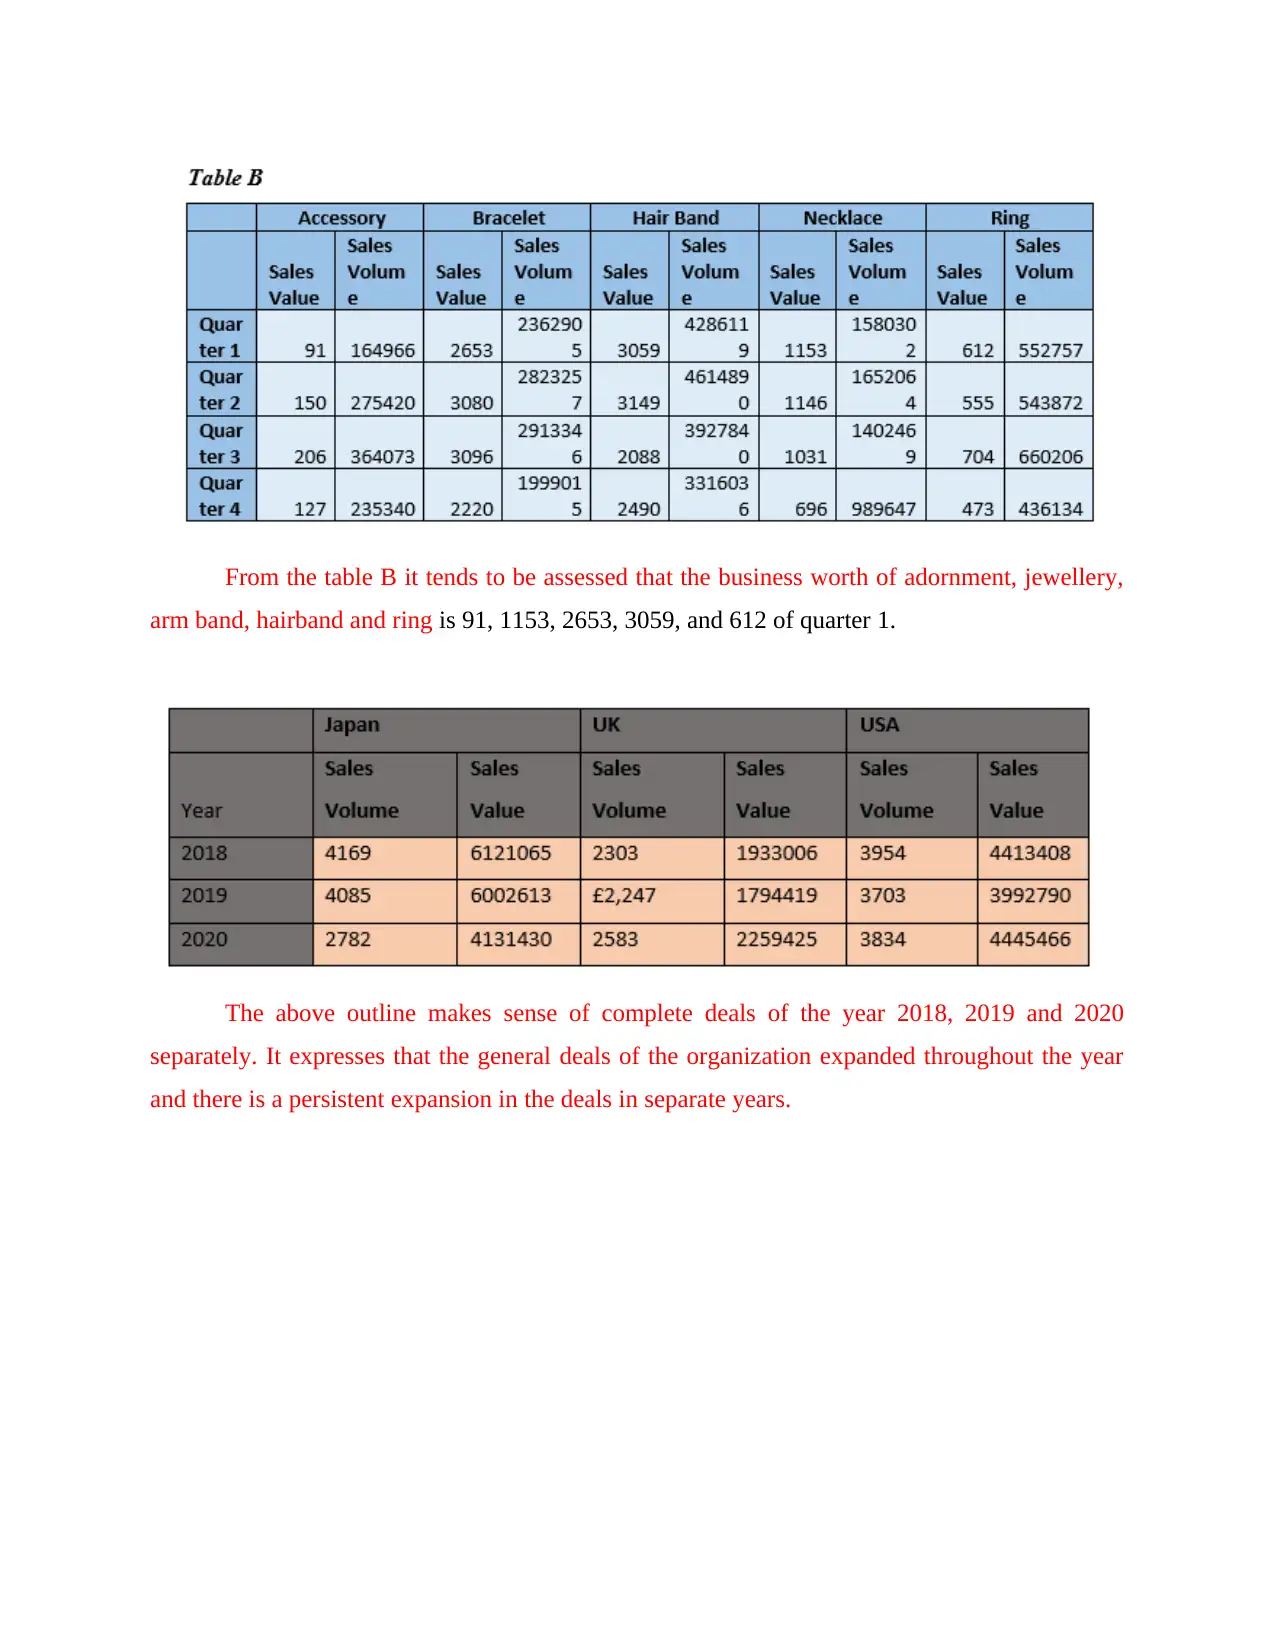
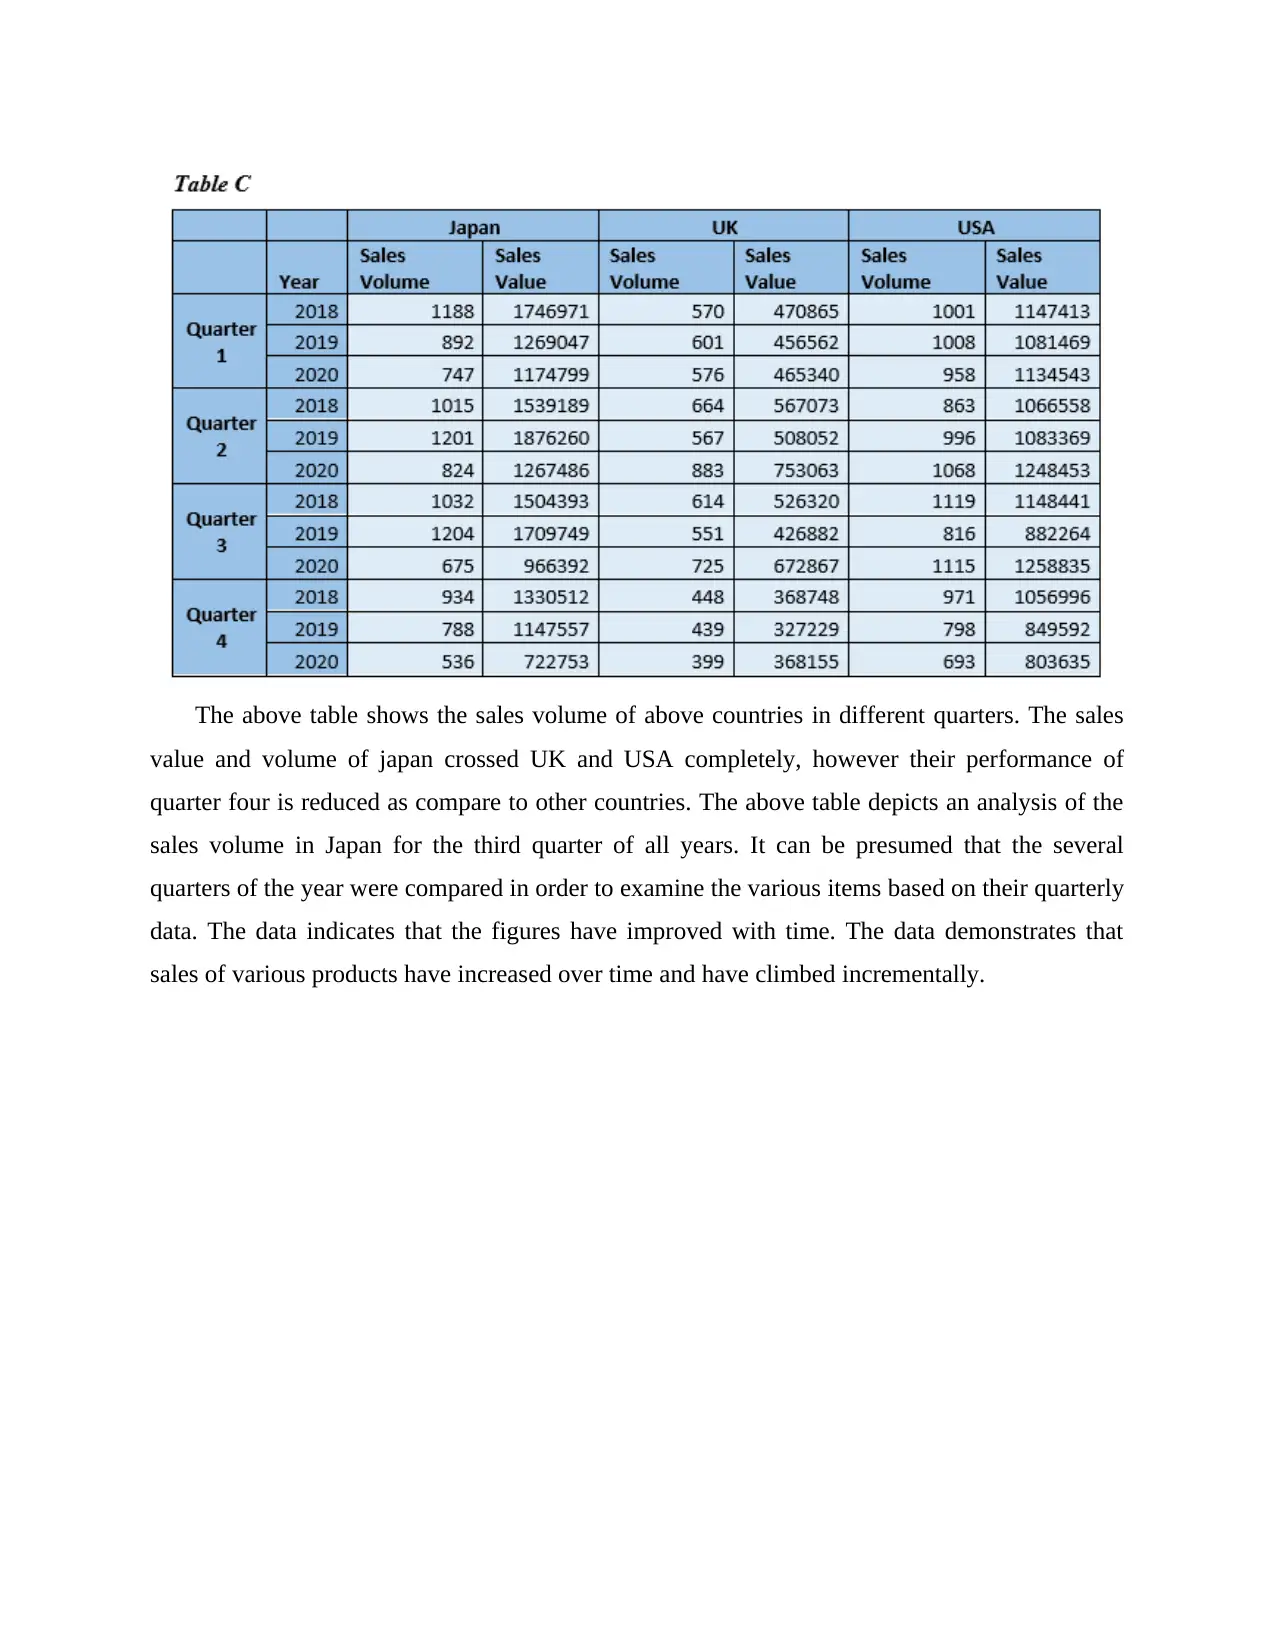
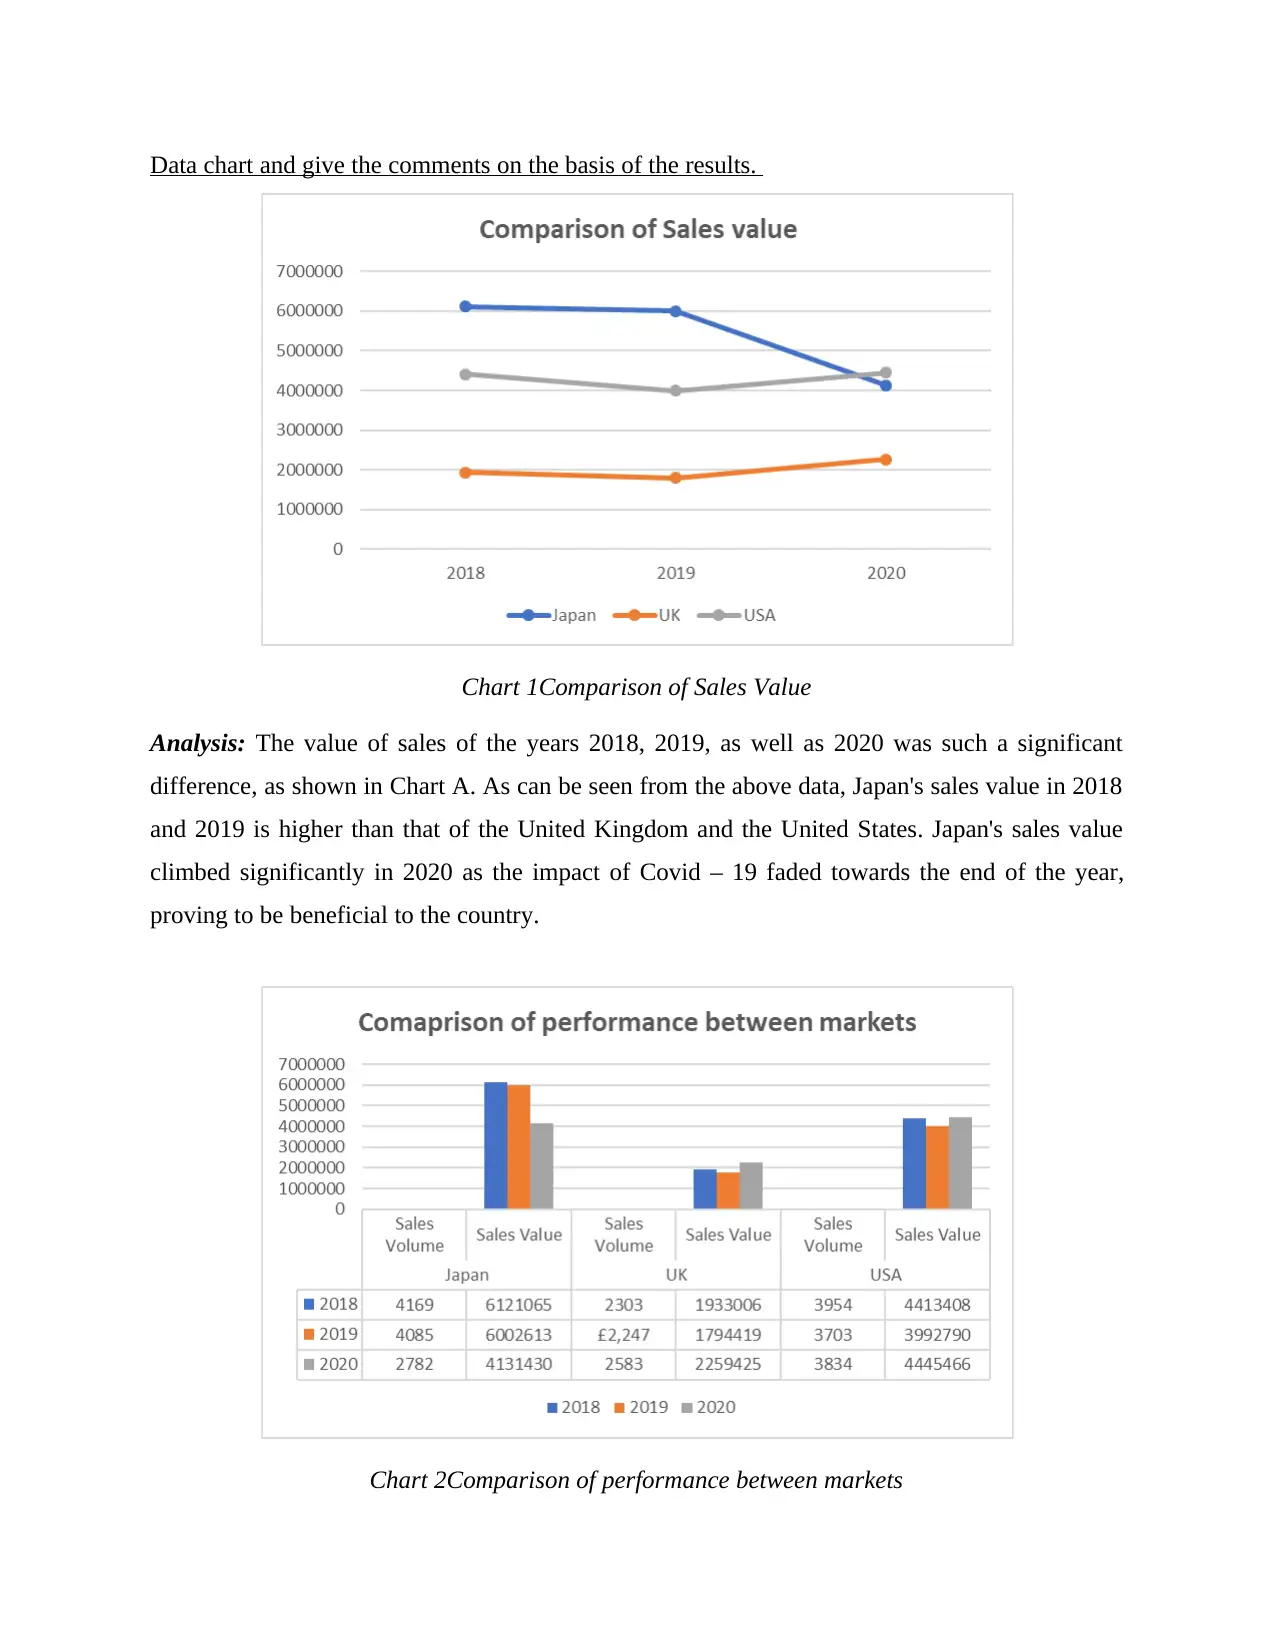
This report provides a data-driven analysis of Bangles International Jewellery (BIJ) sales in the United Kingdom, the United States and Japan, focusing on market trends, sales performance, and key indicators such as revenue growth, profit margins, and client retention. It identifies data quality issues and proposes remedies, analyzes sales data from 2018 to 2020, and offers recommendations to improve BIJ's marketing strategies and overall performance. The analysis highlights the fluctuating sales volumes and values across different countries and quarters, emphasizing the need for targeted marketing approaches and addressing weaknesses in specific markets like the UK. The report concludes with actionable insights to enhance BIJ's profitability and stability, with the suggestion that report should be easily understood by stakeholders. Desklib offers this report and similar resources for students and researchers.

Data Driven
Secure Best Marks with AI Grader
Need help grading? Try our AI Grader for instant feedback on your assignments.

Contents
MAIN BODY...................................................................................................................................3
Introduction and Project plan.................................................................................................3
Data qualities issues and their remedies.................................................................................4
Data Analysis and Commentary.............................................................................................6
Data chart and give the comments on the basis of the results..............................................12
Recommendations and Conclusion......................................................................................13
REFERENCES..............................................................................................................................14

MAIN BODY
Introduction and Project plan
In every organisation, there is a need to take several decisions which helps to find solutions
of operational and financial problems exist in the organisation. Business leaders has to face
numerous problems; it is due to the cross cut competition exist in the industry. It is important to
gain competitive advantage in the existing market (Nakale and Chikohora, 2020).
The main objective of this report is to expound the bangle's business patterns and their
development in the United Kingdom. Plus, this it likewise involves evaluation of information
and its examination to thrive the market wherein it capacities. Likewise, it additionally comprises
proposals to the business that may be useful for the association in lengthy run.
This report likewise centres around investigating the marketing projection of Bangles
International Jewellery(BIJ). The mission of advertising coordinated in the UK. The information
examination helps with working fair and square of deals of BIJ in the global market. These
information tests can be depicted as given underneath:
Observing the attitude of consumers and their response in terms of sales.
Keeping regular check on the factors which boost the sales.
Key role of the social media in the organisational performance.
Noticing the competitor's strategy and tactics which helps in identifying their strength
and weakness.
Determining strong and weak products of organisation (Rädler and Rigger, 2020).
Regulation of price structure, depending upon the market needs.
For achieving the desired sales target, it is crucial for BIJ to respond to the issues
described above. Finding the solutions to the above mentioned issues, helps to achieve the
mission of the organisation.
The indicators which help in increasing the performance, in respect of Bangles industry are
revenue growth, sales received by the concern on the basis of client, profit margin, client
retention ratio and satisfaction of consumers. They can be explained as given under:
Growth in revenue- There are various categories in bangles such as metal, glass and
plastic. The most important decision is to select the material which will be used by the

organisation in manufacturing the bangles. They also have to plan according to the varied
season, trends and festivals.
Revenue received on each client basis – In each market segment, there are various age
groups. It is vital for the organisation to identify the target market or for which age group,
it is producing the product. It is necessary to study the nature of client which assists in
improving the sales of the enterprise (Doloc, 2019).
Profit margin – There can be huge variation in the profit margins of bangles industry.
The cost of labour and market prices for variety of bangles have a powerful impact on the
final price structure of the bangles.
Client retention rate – client are the most important persons for an organisation. Its
retention can be improved by boosting the quality of the bangles and framing the price
structure which can be easily affordable by the customers.
In case the above mentioned indicators of BIJ are addressed correctly, it can rise the
profitability and stability in the enterprise.
Data qualities issues and their remedies
Data Analytics challenges are as under: -
The amount of data being collected: - In today world with the increase in data
complexity the risk is also created relating to storage of such data and managers of
business concern are concern about the risk of data breech that organisation could face
anytime. This could happen in the scenarios of BIJ as well.
Gathering constant information: - With the enormous measure of information
accessible it is hard to burrow down and access the dreams that are required the greater
part of the times. On the off chance that the physically investigate through information, it
tends to be feasible to acquire ongoing understandings on the thing is presently occurring.
Visual portrayal of information: - For the information to be perceived and significant
to the clients of such information for BIJ, it should be outwardly introduced in diagrams
and outlines.
Information from numerous sources: - The following issue is attempting to dissect and
arrange information at one spot which is accumulated from various wellsprings of BIJs.
Secure Best Marks with AI Grader
Need help grading? Try our AI Grader for instant feedback on your assignments.

Some of the time the representatives of the association may not comprehend this which
prompts fragmented and off base investigation.
These issues can be tended to by BIJ with a precise methodology by the accompanying ways: -
Fix the information in the information in source framework: - Data quality issues can
be tended to by tidying up the first source in the ordinary course of span (Treder, 2019).
Fix the source framework to address the information issues: - It now and again sound
like the above technique however it totally unique. It connotes that the source framework
that is liable for gathering the information can be set up naturally purge the information
before it gets goes into the data set.
Execute accuracy character: - This is the most troublesome technique for fixing the
characteristics issues yet at the same time the most impressive strategy.

Data Analysis and Commentary

From the above data the interpretation can be drawn that sales volume of above countries
varies in different months however in terms of performance Japan sales revenue are higher as
compare to UK and USA. Japan's sales volume in 2018 was higher than that of the United
Kingdom and the United States, which was 4085. Despite the fact that Japan's sales volume in
2018 was £ 6002613 from the United Kingdom and the United States. As a result, it can be
deduced that the sales value is determined by the country's revenue volume.
From the above data the interpretation can be drawn that sales value changes due to
change in sales volume in different months. The performance of UK and USA is better but there
is a hope that Japan will over crossed them over the next few months. In 2019, it can be deduced
in the above statistics that the selling value fluctuates every month due to the variance in sales
value. It can be shown that Japan has the highest sales value among the BIJ large datasets from
the United Kingdom and the United States.
Paraphrase This Document
Need a fresh take? Get an instant paraphrase of this document with our AI Paraphraser


In 2020, the sales value is decreasing practically every month due to variability in the
sales value. The country with the highest sales in 2020 is the United States of America, with £
4445466. The sales values for the United Kingdom and Japan are £ 2259425 and £ 4131430,
respectively. The highest total revenue is also 3834 in the United States.
From the above 3 tables it can be summed up that the month to month information of the
relative multitude of 3 nations continues to change consistently and consistently. The
organization has had the option to expand their deals over the course of the year. The monthly
data of all three countries fluctuates every month and every year, as can be seen in the above
three tables. Over the course of the year, the firm is able to grow its revenues. The company's
sales volume has also increased in recent years, indicating that the corporation is able to boost
sales by selling its products rather than raising product prices.

From the table B it tends to be assessed that the business worth of adornment, jewellery,
arm band, hairband and ring is 91, 1153, 2653, 3059, and 612 of quarter 1.
The above outline makes sense of complete deals of the year 2018, 2019 and 2020
separately. It expresses that the general deals of the organization expanded throughout the year
and there is a persistent expansion in the deals in separate years.
Secure Best Marks with AI Grader
Need help grading? Try our AI Grader for instant feedback on your assignments.

The above table shows the sales volume of above countries in different quarters. The sales
value and volume of japan crossed UK and USA completely, however their performance of
quarter four is reduced as compare to other countries. The above table depicts an analysis of the
sales volume in Japan for the third quarter of all years. It can be presumed that the several
quarters of the year were compared in order to examine the various items based on their quarterly
data. The data indicates that the figures have improved with time. The data demonstrates that
sales of various products have increased over time and have climbed incrementally.

Data chart and give the comments on the basis of the results.
Chart 1Comparison of Sales Value
Analysis: The value of sales of the years 2018, 2019, as well as 2020 was such a significant
difference, as shown in Chart A. As can be seen from the above data, Japan's sales value in 2018
and 2019 is higher than that of the United Kingdom and the United States. Japan's sales value
climbed significantly in 2020 as the impact of Covid – 19 faded towards the end of the year,
proving to be beneficial to the country.
Chart 2Comparison of performance between markets

Analysis: From the above chart, it could be analysed that the clustered column chart along with
the data table. It is presented from the percentage with is computed on the basis of the total sale
value and volume of all the three years. It can be said from the analysis that the volume of sales
of Japan is very in the year 2018 and 2019. But in the year 2020, the sales volume of UK is
greater to all the other nations namely Japan and USA. The sales volume in 2018 of Japan is
4169 units which costs of 6121065, where in UK it is 2303 which costs 1933006, in USA it is
3954 and it costs 4413408 of the amounts in context of the sales value. In 2019, sales volume in
Japan is 4085 which is less than the previous year with the deterioration in the sales value as well
which turned out to be 6002613. The sales volume is 2019 of UK is 2247 which costing 1794419
in the sales value whereas, of USA the value of sales is 39929790 whose sales volume is 3703.
Although, in the year 2020, the volume is 2782 for the value of 4131430, UK is 2583 for
2259425 and USA is 3834 with the value of 4445466.
From the above analysis and chart, it could be interpreted that the value of sales has been
deteriorated with the decline in the volume of sales for Japan continuously since 2019, 2019 and
2020. In 2020, the country UK has bucked up and has managed to increase the sale value with
the hike in its volume. In comparison to the other markets, it could be said that UK has managed
to increase its efficiency level in terms of performance between the UK, Japan and USA market.
Recommendations and Conclusion.
From the preceding analysis, it can be concluded that such BIJ jewellers' data set is quite
large in all three nations. Sorting this data is really challenging. The report for the proposal of the
marketing campaign should be written in such a way that it can be simply analysed and
understood by stakeholders when presented.
In compared to the preceding quarters, the data sales volume in quarter 3 is higher. Japan
has the highest sales volume and value. As a result, the marketing campaign should employ some
smart approaches in order to attract more customers, particularly those interested in the
accessory. As a result of its poor revenue in comparison to other categories.
The United States is likewise doing well, if not better than the United Kingdom. It suggests
that there is a paucity of marketing activity in the UK, which remain to be remedied quickly.
Paraphrase This Document
Need a fresh take? Get an instant paraphrase of this document with our AI Paraphraser

REFERENCES
Books and Journals
Treder, M., 2019. Becoming a Data-driven Organisation. Springer Berlin Heidelberg.
Doloc, C., 2019. Applications of Computational Intelligence in Data-Driven Trading. John
Wiley & Sons.
Rädler, S. and Rigger, E., 2020, July. Participative Method to Identify Data-Driven Design Use
Cases. In IFIP International Conference on Product Lifecycle Management (pp. 680-
694). Springer, Cham.
Nakale, B. and Chikohora, E., 2020, November. Towards A Data-Driven Innovation Business
Model in Digital Government Services in Namibia: A Survey. In 2020 2nd
International Multidisciplinary Information Technology and Engineering Conference
(IMITEC) (pp. 1-7). IEEE.
Roshanravan, B., Kreuzer, O.P., Bruce, M., Davis, J. and Briggs, M., 2020. Modelling gold
potential in the Granites-Tanami Orogen, NT, Australia: a comparative study using
continuous and data-driven techniques. Ore Geology Reviews, 125, p.103661.
Tariq, R., Hussain, Y., Sheikh, N.A., Afaq, K. and Ali, H.M., 2020. Regression-based empirical
modeling of thermal conductivity of CuO-water nanofluid using data-driven
techniques. International Journal of Thermophysics, 41(4), pp.1-28.
Searcy, R.T. and Boehm, A.B., 2021. A Day at the Beach: Enabling Coastal Water Quality
Prediction with High-Frequency Sampling and Data-Driven Models. Environmental
Science & Technology, 55(3), pp.1908-1918.
Gholami, A. and Srivastava, A.K., 2021, April. Comparative analysis of ml techniques for data-
driven anomaly detection, classification and localization in distribution system. In 2020
52nd North American Power Symposium (NAPS) (pp. 1-6). IEEE.
Stolper, C.D., Lee, B., Riche, N.H. and Stasko, J., 2018. Data-driven storytelling techniques:
Analysis of a curated collection of visual stories. In Data-driven storytelling (pp. 85-
105). AK Peters/CRC Press.
Saura, J.R., Palacios-Marqués, D. and Ribeiro-Soriano, D., 2021. Digital marketing in SMEs via
data-driven strategies: Reviewing the current state of research. Journal of Small
Business Management, pp.1-36.
1 out of 14
Related Documents

Your All-in-One AI-Powered Toolkit for Academic Success.
+13062052269
info@desklib.com
Available 24*7 on WhatsApp / Email
Unlock your academic potential
© 2024 | Zucol Services PVT LTD | All rights reserved.