Data Driven Management Report: Digital Solutions, University Report
VerifiedAdded on 2022/11/26
|14
|2311
|427
Report
AI Summary
This report examines Digital Solutions, a hypothetical company focused on data-driven urban management, addressing the assignment brief's requirements. The report outlines the company's services, which target urban planners, and details how the business solves urban challenges using information systems and data analytics. It covers the role of emerging technologies such as the Internet of Things, Virtual Reality, and Augmented Reality within the business model. The report further explores the social and environmental impacts of technology, emphasizing the importance of green computing. A data set analysis is included to assess business growth and revenue streams. The report also highlights the importance of data protection and ethical considerations in the context of business operations and technology. The document is a student submission for the BUSN111 course.
Data Driven Management 1
Data Driven Management
Name
Course
Tutor
University
Date
Data Driven Management
Name
Course
Tutor
University
Date
Paraphrase This Document
Need a fresh take? Get an instant paraphrase of this document with our AI Paraphraser
Data Driven Management 2
Week 1/2
Digital Solutions is a data driven company that offers technological solutions to create
modern cities. The headquarters of the company is located in Sydney, Australia. The company
will be providing services that target urban planners, jurisdictions, non-governmental
organization and environmental analysts to implement data driven conversations which will play
a crucial role in developing sustainable, resilient and equitable communities. Digital solutions
rely on sufficient knowledge with respect to interactions between planning and residential
locations as well as fiscal public health and environmental challenges that face communities
(Rabari and Storper 2014).
Our services are structured to address these challenges through proven methodologies for
cities, regions and urban planning institutions. Our solutions are structured to mimic real-life
scenarios that urban planners face on a daily basis. Based on our experience in offering planning
solutions for complex projects. Our combined knowledge and proven strategies along with data
analytics has enabled us to develop software that assist in increasing efficiency.
We understand the pressure mounted on planners, municipalities and environmental
agencies. As a result, we set out to streamline the process for relevant stakeholders to access new
opportunities, consolidate and utilize quality data and communicate effectively to concerned
parties.
The information system at our disposal is a management information system that is
structured to gather relevant data from a wide range of sources that can be complied to provide a
readable format. The management system plays a crucial role in assisting us to create reports and
offer a comprehensive overview of information that is significant in facilitating decision making
Data Driven Management 3
process. Among other benefits that the system provided include collecting business information
as well as facilitating collaboration and communications (Kitchin 2015).
Emerging capabilities with respect to management information systems include
enhancing competitive position of the organization. Also, it aims at increasing productivity by
lowering the cost of units. As well, it plays a crucial role in improving services that lead to
higher customer satisfaction. Rapid advancement in technology suggest that efficiency will be
increased thus improving the decision making capabilities. The management information system
will be structured to respond faster to demands of the marketplace. In addition, the system will
improve its ability to communicate and collaborate with other stakeholders as well as enhance
goodwill of employees.
Week 3/4
Internet of things
Internet of things refers to the connection of devices through the internet to facilitate
information access. These devices are connected in order to interact and communicate to each
other over the internet. Today, internet of things has evolved to include, real-time analytics,
machine learning, commodity sensors and embedded systems (Al-Fuqaha et al 2015. This
emerging trend will play a crucial role in the business by providing high-quality and reliable data
as well as offering decision analytics to improve customer experience. This aspect will solve
problems of different nature including sharing relevant information at the right time. In this
regard, roads will send information about accidents to local hospitals which can send medical aid
using a drones. Among other problems it will address include parking spaces and determining
location of a damaged pipes.
⊘ This is a preview!⊘
Do you want full access?
Subscribe today to unlock all pages.
Trusted by 1+ million students worldwide
Data Driven Management 4
Virtual reality
Virtual reality refers to an experience that is simulated by computers to mimic real world.
This concept will play a crucial role in our firm by enabling us to use computer technology to
create three-dimensional representation of the real world which we can manipulate and explore
to find more information to make decision involving our real world (Wexelblat 2014). This
concept will be beneficial in reducing risk, making improvements, enhance productivity,
planning and facilitate training and education.
Augmented reality
This refers to an interactive experience of the real world through computer generated
perceptual information. Augmented reality is often characterized with influencing multiple
sensory modalities. This concept will be beneficial to our business because it influences various
fields within our society. For instance, it will assist the military to create digitally enhanced
training missions (Billinghurst, Clark and Lee 2015). Besides, it will be significant in enabling
processing of data at incredible speeds. Moreover, augmented reality is beneficial in many fields
such as retail where it can play a crucial role in influencing experience both offline and online as
well as creating virtual fitting rooms. It can help managers to monitor progress in manufacturing
in real time which can save time as opposed to relying on digital maps and plants.
Week 5/6
Did you know? Digital Solutions offers services to assist urban planners, non-
governmental organizations and environmental analysts to implements data-driven engagement
in order to structure equitable communities, resilient and sustainability. Each decision
Paraphrase This Document
Need a fresh take? Get an instant paraphrase of this document with our AI Paraphraser
Data Driven Management 5
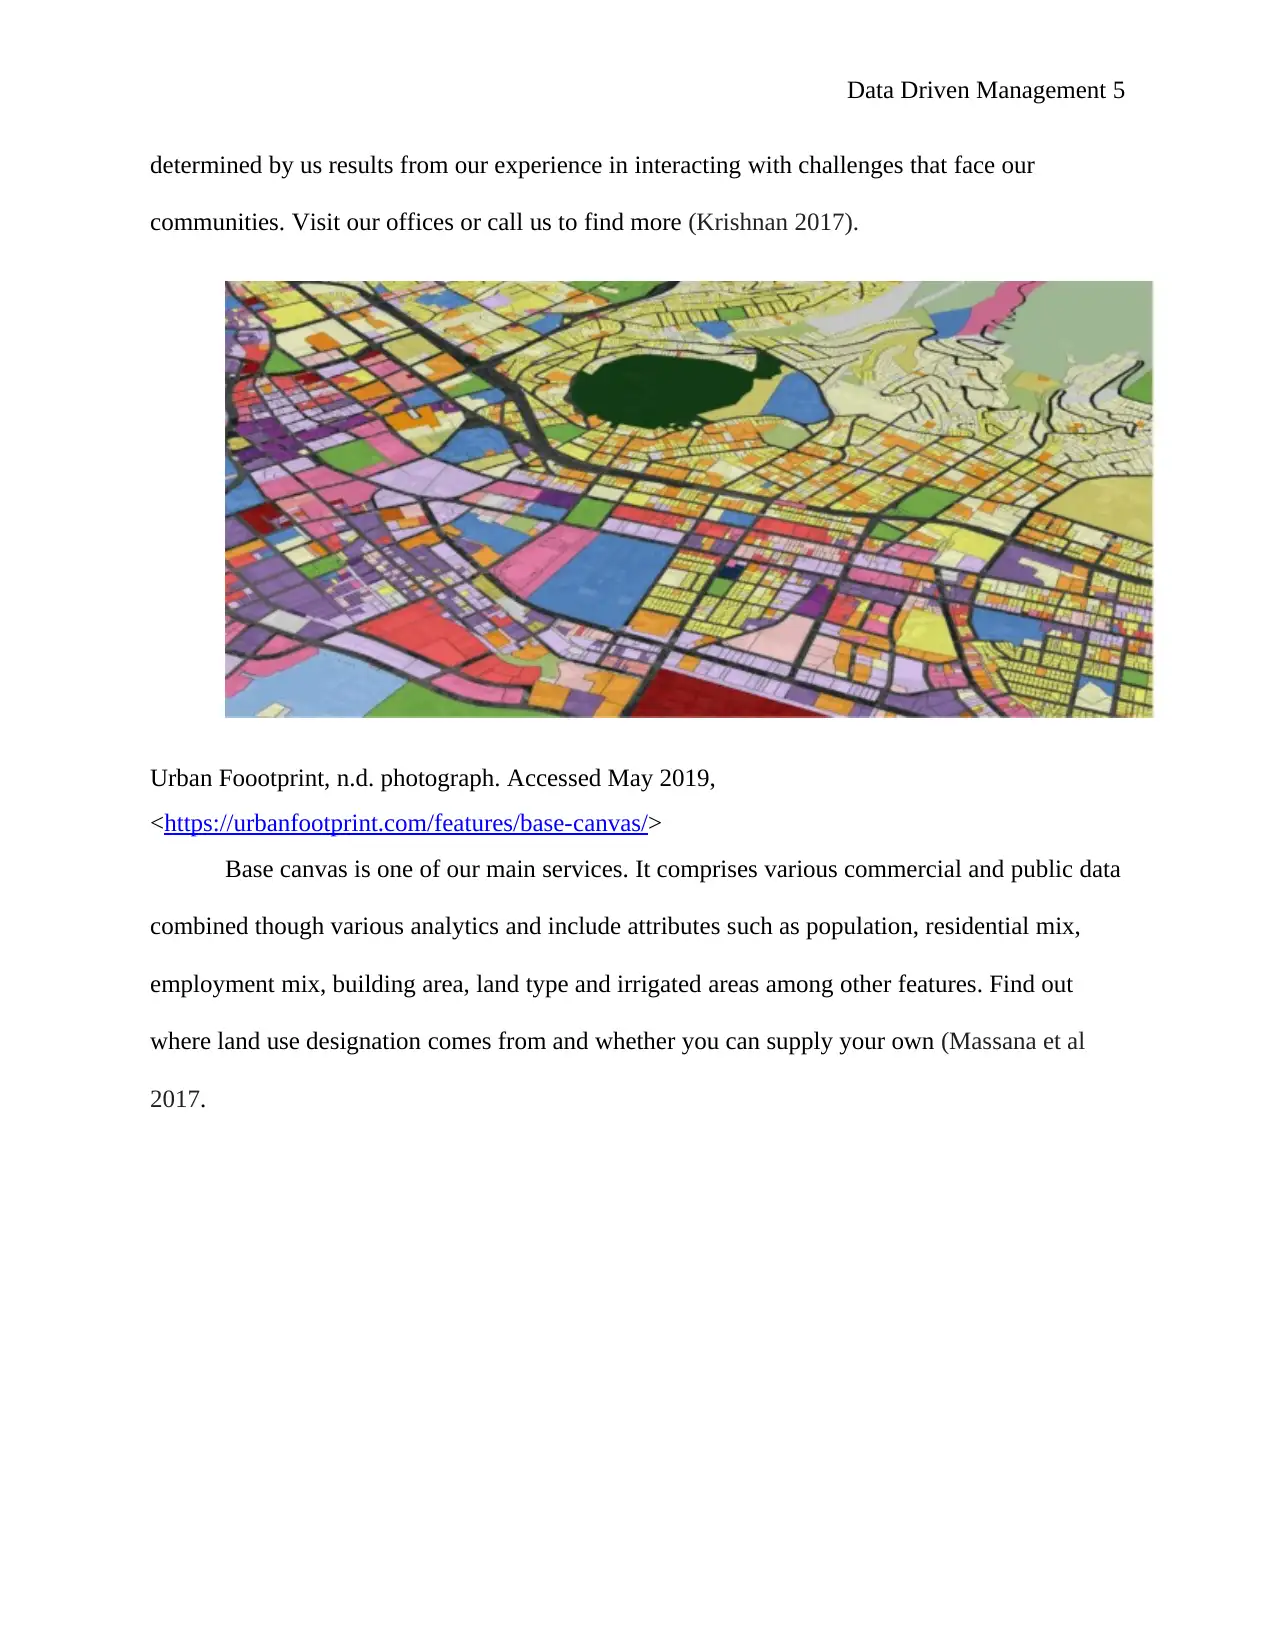
determined by us results from our experience in interacting with challenges that face our
communities. Visit our offices or call us to find more (Krishnan 2017).
Urban Foootprint, n.d. photograph. Accessed May 2019,
<https://urbanfootprint.com/features/base-canvas/>
Base canvas is one of our main services. It comprises various commercial and public data
combined though various analytics and include attributes such as population, residential mix,
employment mix, building area, land type and irrigated areas among other features. Find out
where land use designation comes from and whether you can supply your own (Massana et al
2017.
Data Driven Management 6
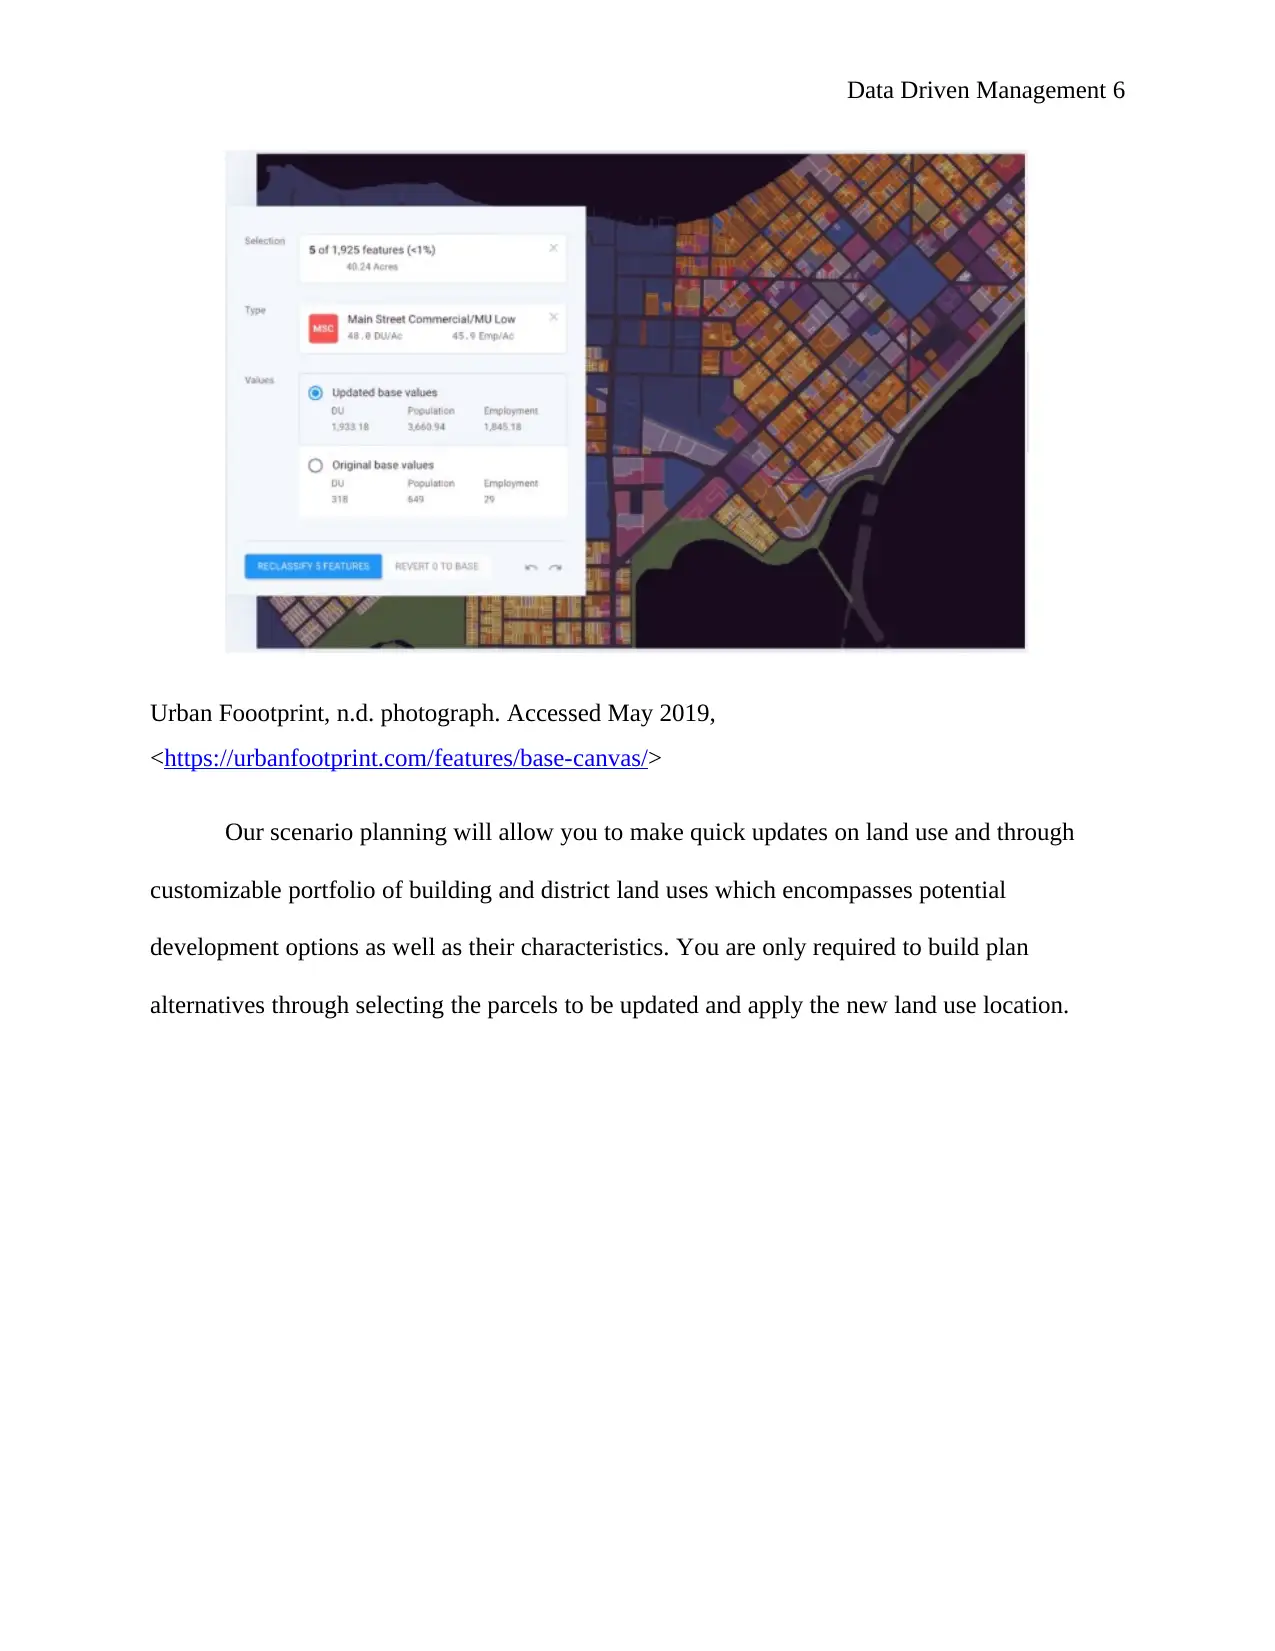
Urban Foootprint, n.d. photograph. Accessed May 2019,
<https://urbanfootprint.com/features/base-canvas/>
Our scenario planning will allow you to make quick updates on land use and through
customizable portfolio of building and district land uses which encompasses potential
development options as well as their characteristics. You are only required to build plan
alternatives through selecting the parcels to be updated and apply the new land use location.
⊘ This is a preview!⊘
Do you want full access?
Subscribe today to unlock all pages.
Trusted by 1+ million students worldwide
Data Driven Management 7
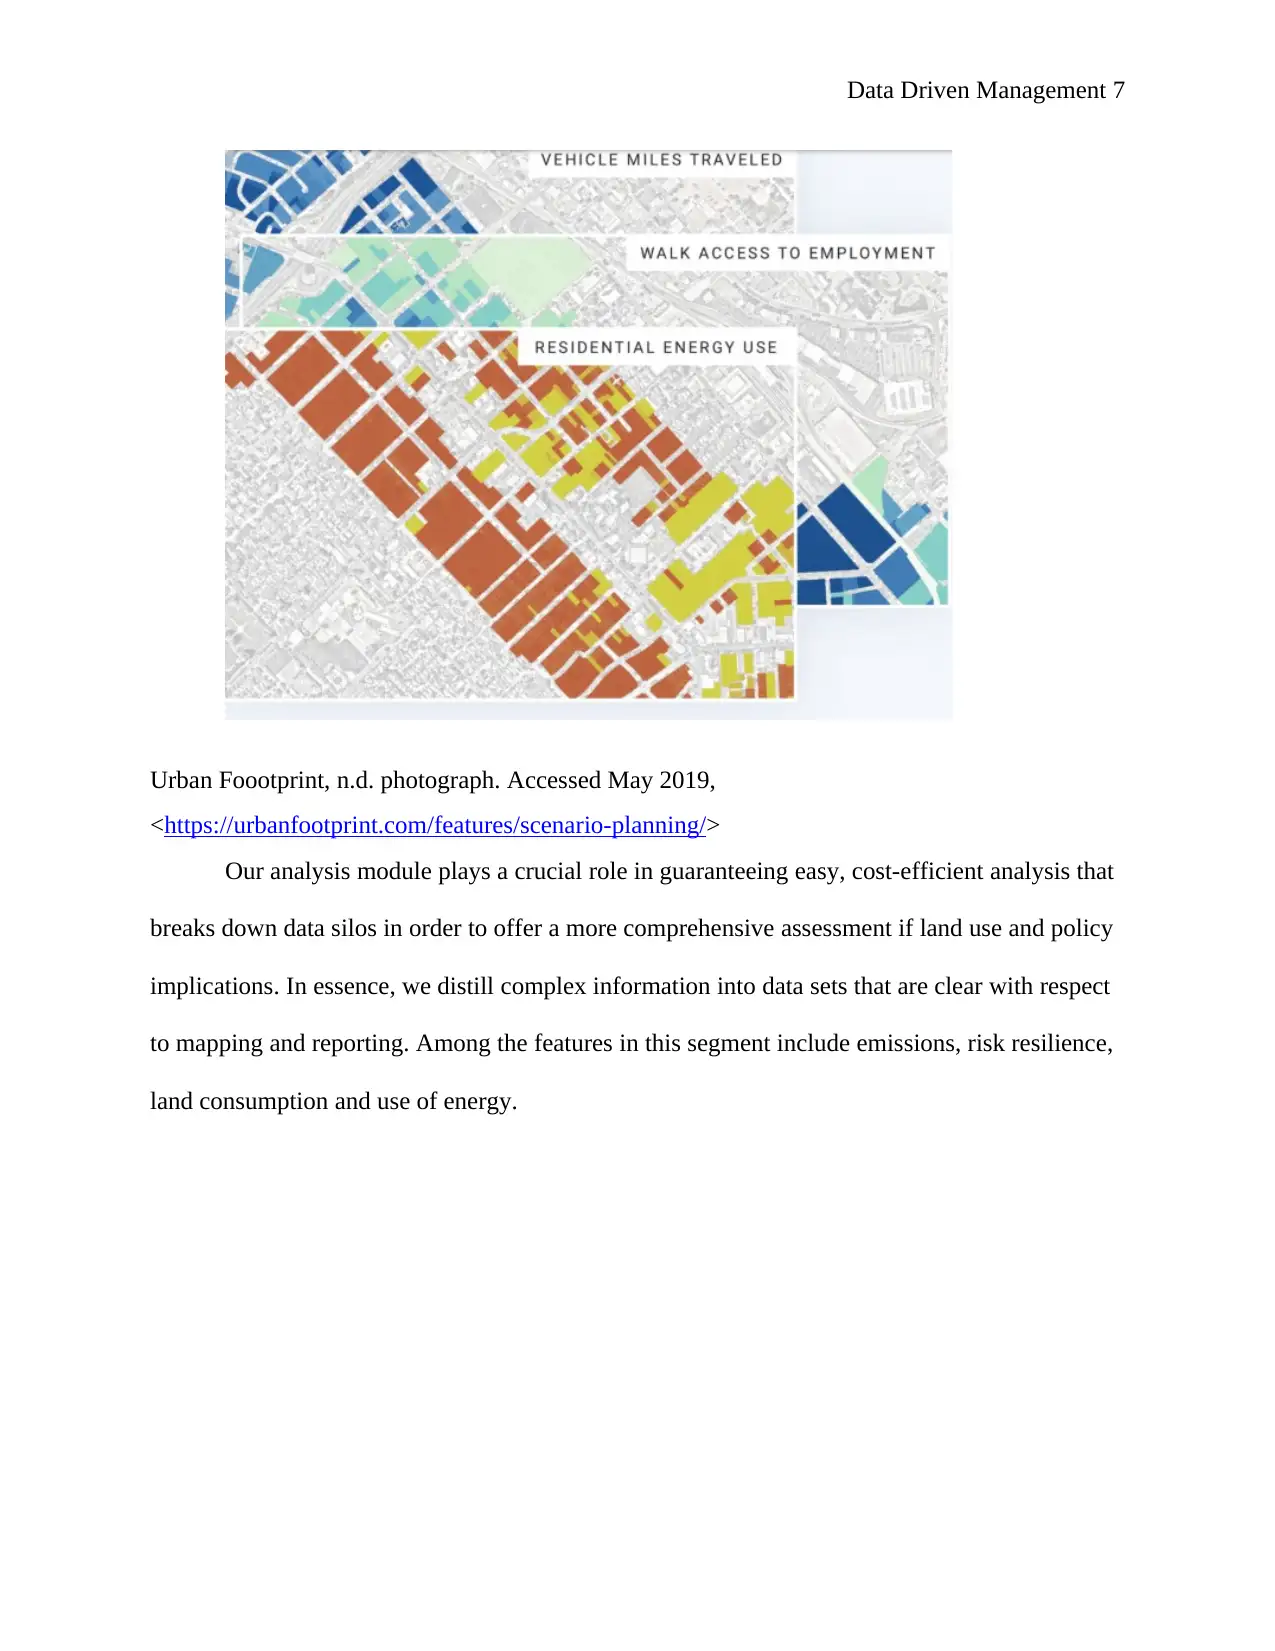
Urban Foootprint, n.d. photograph. Accessed May 2019,
<https://urbanfootprint.com/features/scenario-planning/>
Our analysis module plays a crucial role in guaranteeing easy, cost-efficient analysis that
breaks down data silos in order to offer a more comprehensive assessment if land use and policy
implications. In essence, we distill complex information into data sets that are clear with respect
to mapping and reporting. Among the features in this segment include emissions, risk resilience,
land consumption and use of energy.
Paraphrase This Document
Need a fresh take? Get an instant paraphrase of this document with our AI Paraphraser
Data Driven Management 8
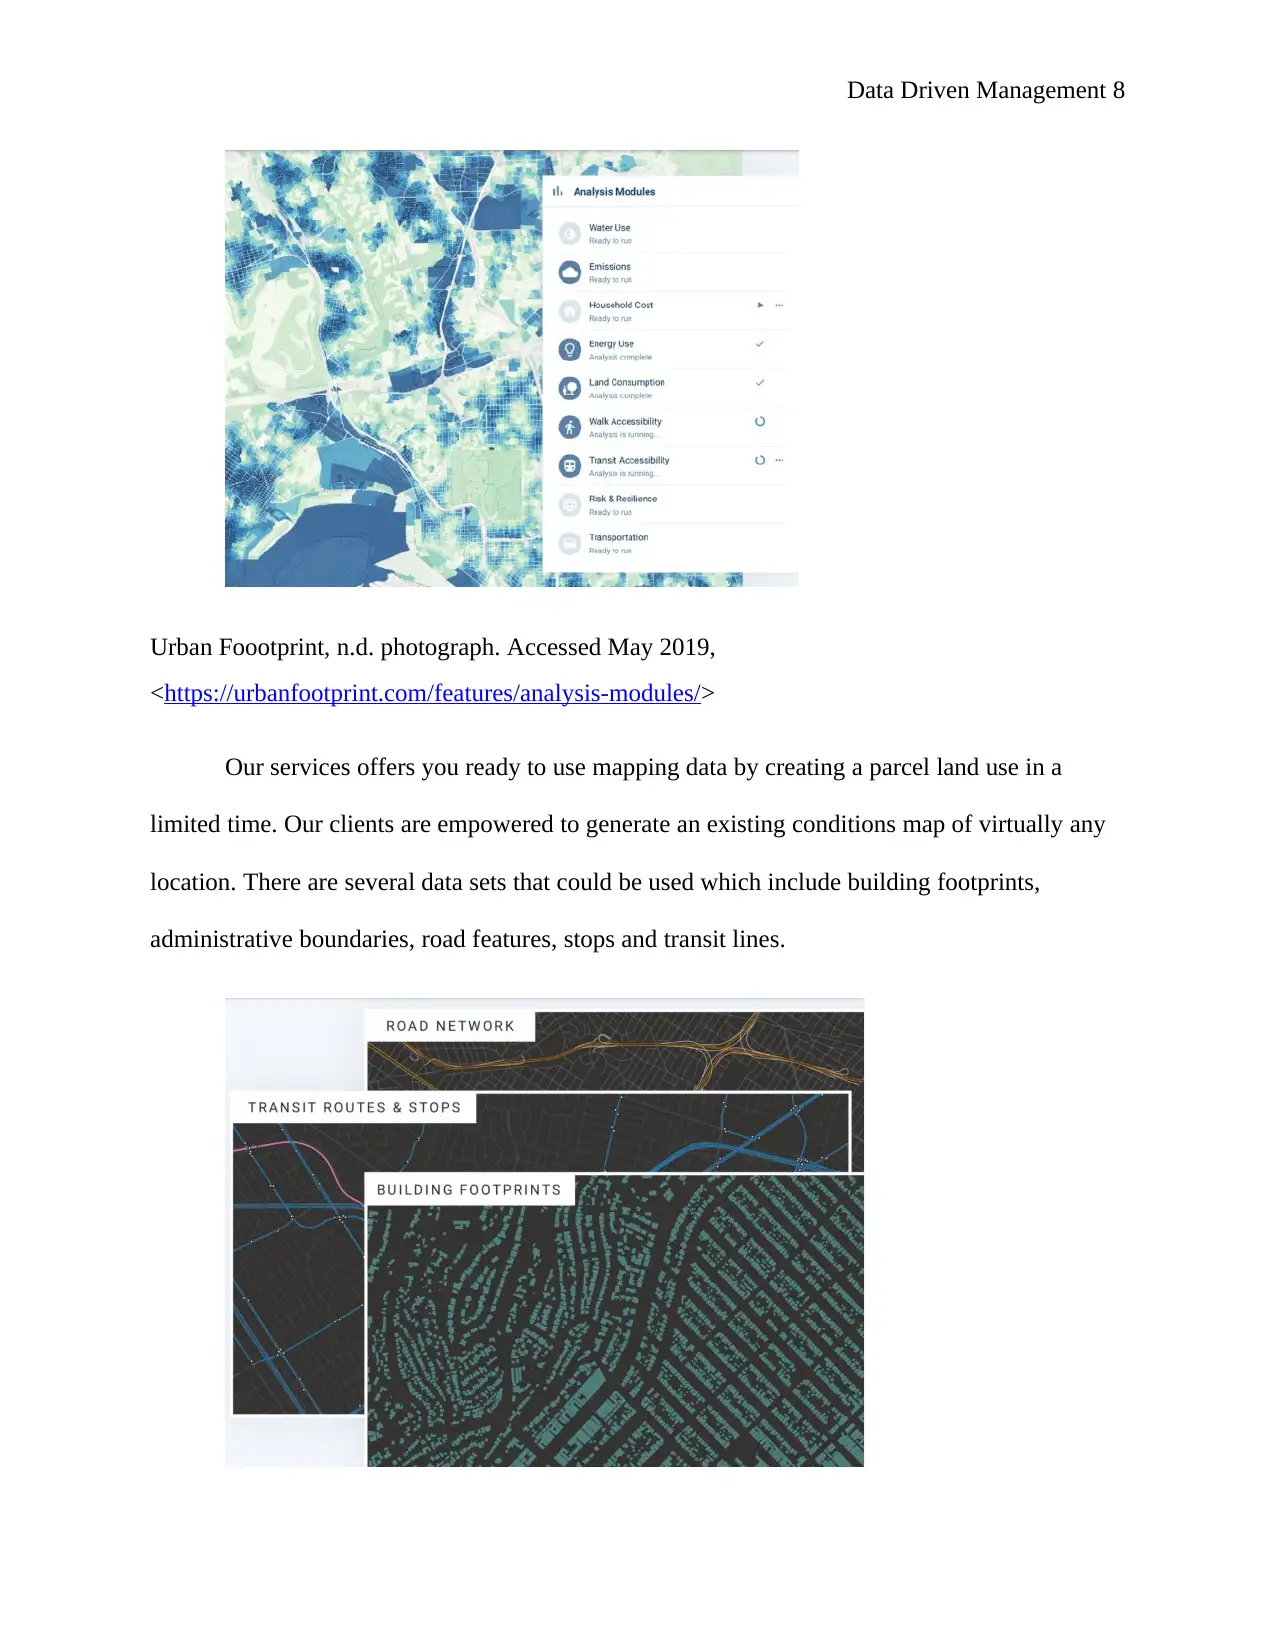
Urban Foootprint, n.d. photograph. Accessed May 2019,
<https://urbanfootprint.com/features/analysis-modules/>
Our services offers you ready to use mapping data by creating a parcel land use in a
limited time. Our clients are empowered to generate an existing conditions map of virtually any
location. There are several data sets that could be used which include building footprints,
administrative boundaries, road features, stops and transit lines.
Data Driven Management 9
Urban Foootprint, n.d. photograph. Accessed May 2019,
<https://urbanfootprint.com/features/mapping/>
Week 7/8
Social and environmental impact of technology
Many of the technologies that we use on a daily basis influence our social and
environmental aspects as a result of consumption of resources and power required in utilizing
these resources. This technology will contribute to consumption of resources that are used to
make technology (Unit 2015)
Other areas include consumption of coal in order to generate electricity that will facilitate
use of technology. In addition, impact of these technology have both direct and indirect
consequences on trees and water. Besides, our business will likely disrupt the ecology since it is
centered on assisting planners find suitable locations for land use. Thus clearing land and
displacing animals to build industries will contribute in allowing pollution to contaminate food
chain and affect environment (Weaver et al 2017).
As a result, green computing should be taken into consideration in order to assess how
our business model can influence technology positively. For instance, our business will focus on
developing and producing new materials and technologies that have minimal influence in the
environment for sustainability. The technology will also play a crucial role in enabling us
monitor and study the environment better to understand the impact of our actions on the
environment.
Our business model will also take part in developing smart technologies with capabilities
of responding to how we use them to minimize environmental impact (Schaltegger and Burritt
⊘ This is a preview!⊘
Do you want full access?
Subscribe today to unlock all pages.
Trusted by 1+ million students worldwide
Data Driven Management 10
2017). Moreover, the technology will contribute in allowing us to have a virtual laboratory of the
world. This implies that researchers from across the world can share information to reduce the
impact of technology. In addition, the technology protects trees as a result of paperless office
since communication is channeled through connected devices.
Week 9/10
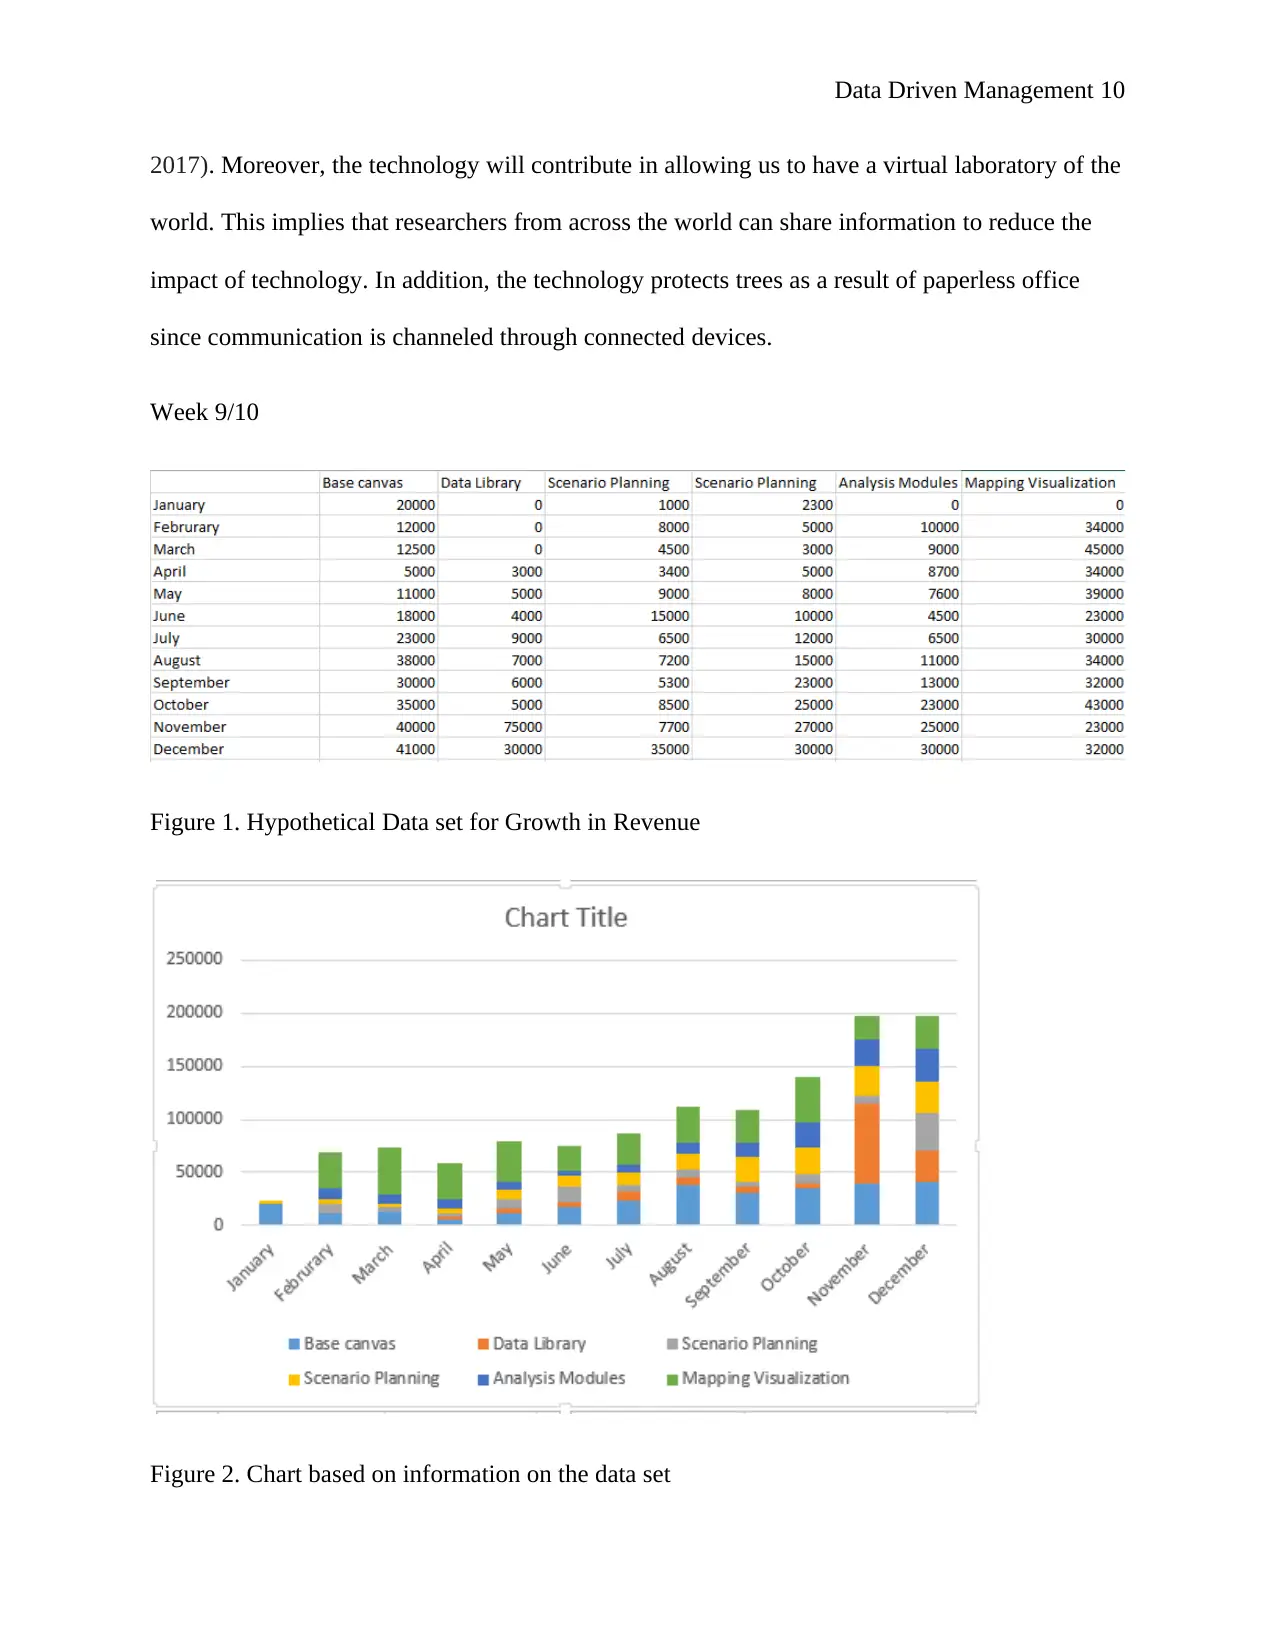
Figure 1. Hypothetical Data set for Growth in Revenue
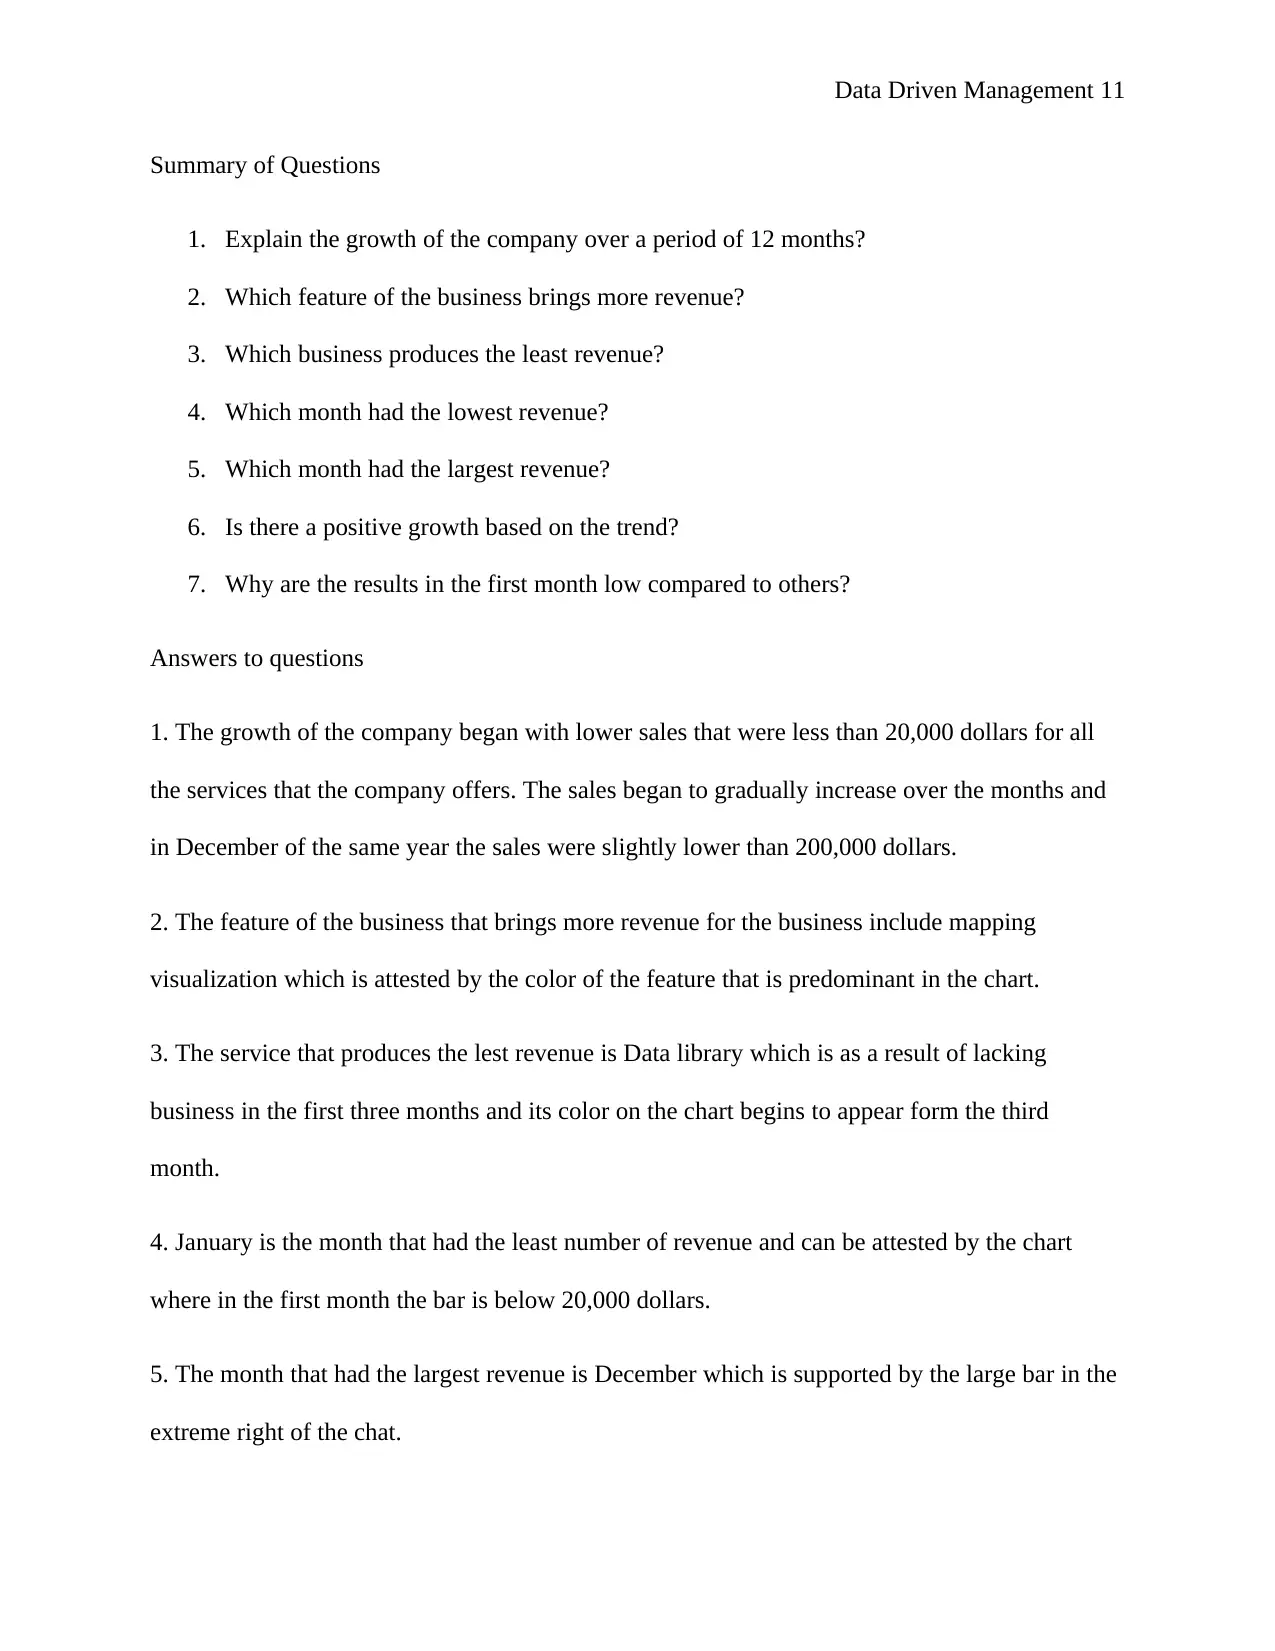
Figure 2. Chart based on information on the data set
2017). Moreover, the technology will contribute in allowing us to have a virtual laboratory of the
world. This implies that researchers from across the world can share information to reduce the
impact of technology. In addition, the technology protects trees as a result of paperless office
since communication is channeled through connected devices.
Week 9/10
Figure 1. Hypothetical Data set for Growth in Revenue
Figure 2. Chart based on information on the data set
Paraphrase This Document
Need a fresh take? Get an instant paraphrase of this document with our AI Paraphraser
Data Driven Management 11
Summary of Questions
1. Explain the growth of the company over a period of 12 months?
2. Which feature of the business brings more revenue?
3. Which business produces the least revenue?
4. Which month had the lowest revenue?
5. Which month had the largest revenue?
6. Is there a positive growth based on the trend?
7. Why are the results in the first month low compared to others?
Answers to questions
1. The growth of the company began with lower sales that were less than 20,000 dollars for all
the services that the company offers. The sales began to gradually increase over the months and
in December of the same year the sales were slightly lower than 200,000 dollars.
2. The feature of the business that brings more revenue for the business include mapping
visualization which is attested by the color of the feature that is predominant in the chart.
3. The service that produces the lest revenue is Data library which is as a result of lacking
business in the first three months and its color on the chart begins to appear form the third
month.
4. January is the month that had the least number of revenue and can be attested by the chart
where in the first month the bar is below 20,000 dollars.
5. The month that had the largest revenue is December which is supported by the large bar in the
extreme right of the chat.
Data Driven Management 12
6. From the trend it suffices to justify that there is positive trend because revenue of the business
is shown to be increasing over the months.
7. The results of the first month are considered to be low as a result of the company launching its
services and marketing of the services could not have been achieved.
I selected this data set because it provides information that is significant to make
informed decision about the company’s growth. It shows revenue achieved over the months as
well as where the money generated by the business came from (Poco and Heer 2017).
Data requires to be protected primarily for privacy issues. Personal information or data
meant for a specific purpose should be used for that purpose only. This is because information
can fall to the wrong hands and impact an organizations reputation or increase vulnerability to
attacks. Therefore, data should be protected to minimize social and personal harm (Floridi and
Taddeo 2016).
⊘ This is a preview!⊘
Do you want full access?
Subscribe today to unlock all pages.
Trusted by 1+ million students worldwide
1 out of 14
Related Documents


Your All-in-One AI-Powered Toolkit for Academic Success.
+13062052269
info@desklib.com
Available 24*7 on WhatsApp / Email
![[object Object]](/_next/static/media/star-bottom.7253800d.svg)
Unlock your academic potential
Copyright © 2020–2026 A2Z Services. All Rights Reserved. Developed and managed by ZUCOL.