MANG6230: Data-Driven Marketing Analysis Report - Toys Campaign
VerifiedAdded on 2023/03/20
|15
|3006
|97
Report
AI Summary
This report presents a comprehensive analysis of a marketing campaign for toys, leveraging customer data to improve marketing strategies. The analysis begins with descriptive statistics of the initial campaign, examining customer responses to mailed vouchers. Cross-tabulations are used to explore the relationship between customer demographics, loyalty status, and geographic regions with voucher acceptance and rejection rates. A predictive response model is developed using logistic regression to identify customers most likely to respond to future campaigns. The report identifies significant variables and builds a model to predict customer behavior. The report then discusses the selection of a random sample of 2000 customers based on their class for targeted marketing campaigns. The report concludes by comparing the costs and benefits of sending email vouchers versus traditional postal mail. The report provides a detailed overview of the methodology, findings, and recommendations for future marketing initiatives. The report is a result of coursework for the MANG6230 module.
Marketing 1
Data-Driven Marketing
Name of Author
Name of Class
Name of Professor
Name of School
State and City of School
Date
Data-Driven Marketing
Name of Author
Name of Class
Name of Professor
Name of School
State and City of School
Date
Paraphrase This Document
Need a fresh take? Get an instant paraphrase of this document with our AI Paraphraser
Marketing 2
Table of Content
Introduction………………………………………………………………………………………3
Basic Analysis on Initial Campaign for Toys…………………………………………………..4
Predictive Response Model……………………………………………………………………...8
Choosing 2000 Customers at Random………………………………………………………...10
Email Vouchers…………………………………………………………………………………10
Appendix………………………………………………………………………………………...11
References……………………………………………………………………………………….14
Marketing 3
Introduction
Data on sales, on marketing and on customer relations are three highly interrelated
variables and they are taken to be seriously important by each and every company in each and
every industry. The boards of companies, the managers, the sales departments and the sales
people both of whom are involved in receiving orders for goods and services, all have a keen
sense of profit cultivation and realization (Kuikka and Laukkanen, 2016). For-profit to be
realized good customer relations must be maintained by each and every factory via all the
responsible authorities of the respective factory. Marketing or product campaigns are used to
promote sales because from marketing, customers are made aware of an existing product or
service and all its good features and benefits. When a producer of a product or a provider of a
service or even a salesperson promote his or her product in a detailed manner and with due
diligence and convincing power, then the respective person or people must be sure of making
higher sales hence higher profits (Kim, Vogt and Knutson, 2015).
Looking at how marketing and sales have shaped over the years, a realization is noticed on how
the behaviour of providers of commodities to customers or consumers has changed when it
comes to handling customer data and information. Data is raw facts or recordings about some
observations that are recorded for shorter periods. Information, on the other hand, is data that has
been processed. This would mean that the data is qualitatively analyzed or qualitatively analyzed
in order to get a well-informed decision from the data provided, a piece of information that
would be used by management to help promote sales by influencing how the customer is being
provided with information (Li, Tao, Cheng and Zhao, 2015). The information provided affects
the media that producers use for doing product promotion, for example, if most people are
watching a specific television channel, then a producer would concentrate its product promotion
to customers on that channel. Information gotten from data analysis affects what package of a
product is being offered by a producer; say if a commodity is being bought in abundance when
there is an extra piece or when there is an additional commodity, then in order to make more
sales, even if it is for a short period, an extra commodity should be included on the pact. You
realize that during specific times, a product manufacturer might offer sales vouchers, additional
pact, free delivery or even discounts; this is aimed at promoting sales and making the producer
known more by the market itself (Ohly et al, 2017).
The importance of analyzing customer data in order to create a new integrated marketing
communication strategy was well understood by the multinational supermarket that I work for.
This led my manager to ask me to do an analysis and a report on available customer data in order
to help build a new marketing strategy that the supermarket was to employ to help promote its
daily operations. All these were to be done because of the business’s operational extension
⊘ This is a preview!⊘
Do you want full access?
Subscribe today to unlock all pages.
Trusted by 1+ million students worldwide
Marketing 4
purposes. The commodity that was to be improved was toys, in which data of 1800 customers
were picked and each and every customer was to be analyzed under different variables. The
variables range from socio-demographic variables to customer behavioural summary variables
before the vouchers were sent and then to two behavioural variables after the vouchers were sent.
The actual analysis was how different customers responded to vouchers sent to them via post.
The entire analysis is to be done on the statistical package for social sciences (SPSS).
Basic Analysis on Initial Campaign for Toys
Here of all the data variables that we have been provided for in relation to each and every
customer, we will be performing a descriptive statistics the entire dataset. Before performing any
descriptive statistics on the dataset, it is important to realize that the dataset toys.sav has missing
value under the variable column; loyalty card application date. This I had to sort cases in SPSS
under the data tab. This brought the observations without entries for this column up to the top,
which I then deleted remaining only with the observations that had entries everywhere. Then I
run descriptive statistics on relevant variables while cutting off the irrelevant ones; one of the
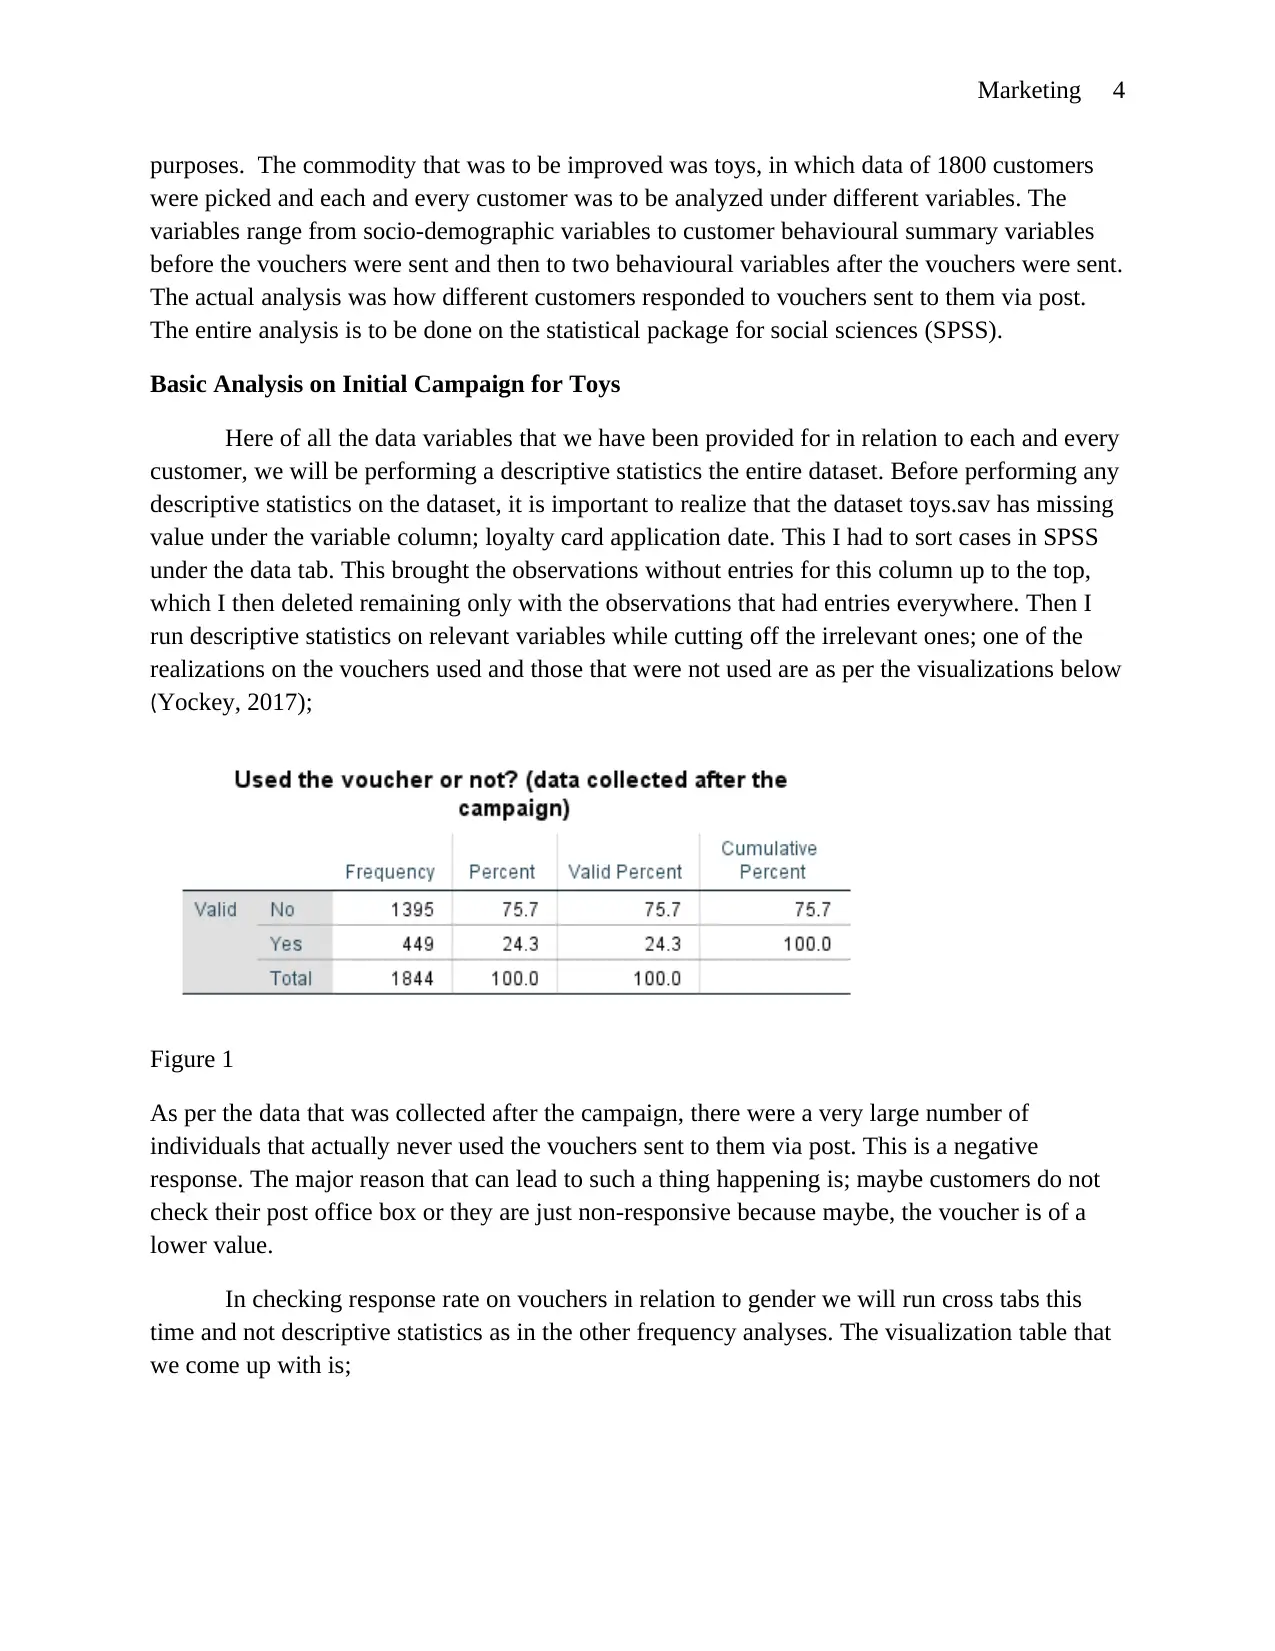
realizations on the vouchers used and those that were not used are as per the visualizations below
(Yockey, 2017);
Figure 1
As per the data that was collected after the campaign, there were a very large number of
individuals that actually never used the vouchers sent to them via post. This is a negative
response. The major reason that can lead to such a thing happening is; maybe customers do not
check their post office box or they are just non-responsive because maybe, the voucher is of a
lower value.
In checking response rate on vouchers in relation to gender we will run cross tabs this
time and not descriptive statistics as in the other frequency analyses. The visualization table that
we come up with is;
purposes. The commodity that was to be improved was toys, in which data of 1800 customers
were picked and each and every customer was to be analyzed under different variables. The
variables range from socio-demographic variables to customer behavioural summary variables
before the vouchers were sent and then to two behavioural variables after the vouchers were sent.
The actual analysis was how different customers responded to vouchers sent to them via post.
The entire analysis is to be done on the statistical package for social sciences (SPSS).
Basic Analysis on Initial Campaign for Toys
Here of all the data variables that we have been provided for in relation to each and every
customer, we will be performing a descriptive statistics the entire dataset. Before performing any
descriptive statistics on the dataset, it is important to realize that the dataset toys.sav has missing
value under the variable column; loyalty card application date. This I had to sort cases in SPSS
under the data tab. This brought the observations without entries for this column up to the top,
which I then deleted remaining only with the observations that had entries everywhere. Then I
run descriptive statistics on relevant variables while cutting off the irrelevant ones; one of the
realizations on the vouchers used and those that were not used are as per the visualizations below
(Yockey, 2017);
Figure 1
As per the data that was collected after the campaign, there were a very large number of
individuals that actually never used the vouchers sent to them via post. This is a negative
response. The major reason that can lead to such a thing happening is; maybe customers do not
check their post office box or they are just non-responsive because maybe, the voucher is of a
lower value.
In checking response rate on vouchers in relation to gender we will run cross tabs this
time and not descriptive statistics as in the other frequency analyses. The visualization table that
we come up with is;
Paraphrase This Document
Need a fresh take? Get an instant paraphrase of this document with our AI Paraphraser
Marketing 5
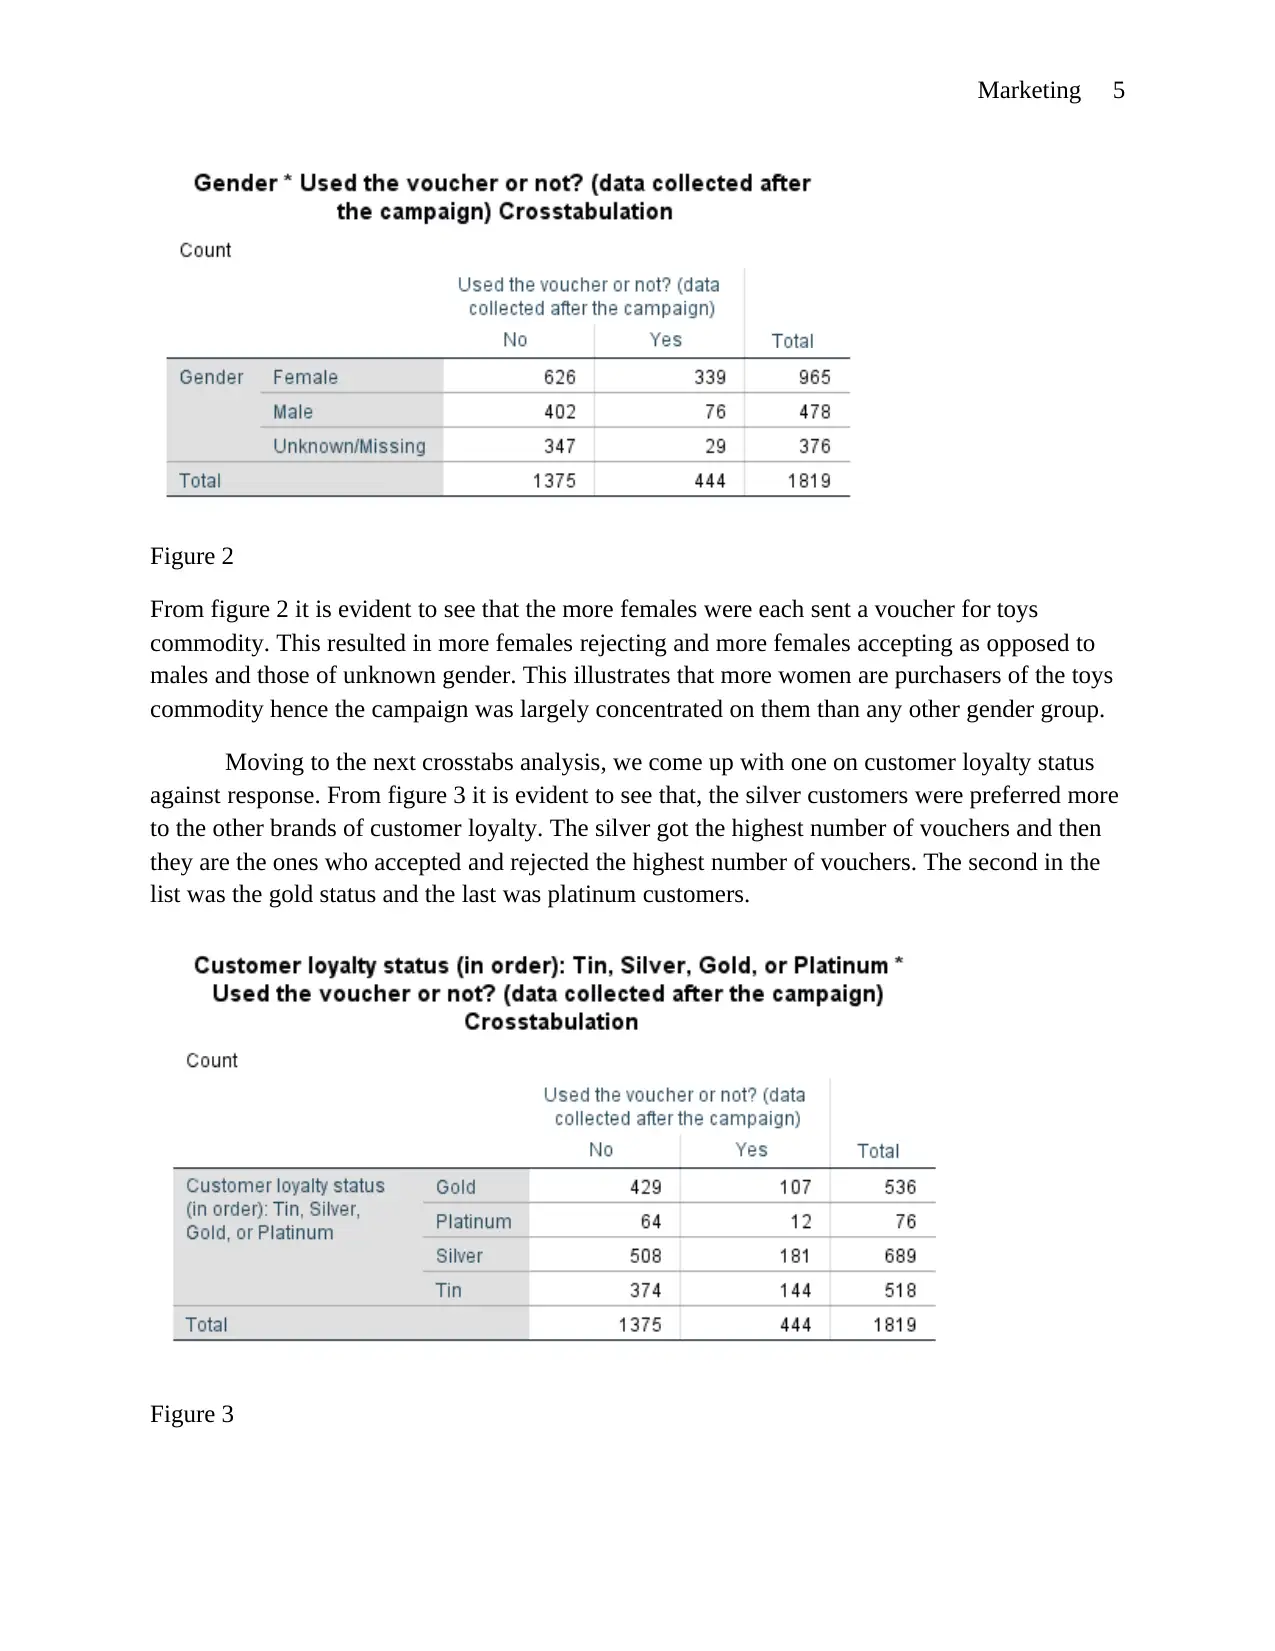
Figure 2
From figure 2 it is evident to see that the more females were each sent a voucher for toys
commodity. This resulted in more females rejecting and more females accepting as opposed to
males and those of unknown gender. This illustrates that more women are purchasers of the toys
commodity hence the campaign was largely concentrated on them than any other gender group.
Moving to the next crosstabs analysis, we come up with one on customer loyalty status
against response. From figure 3 it is evident to see that, the silver customers were preferred more
to the other brands of customer loyalty. The silver got the highest number of vouchers and then
they are the ones who accepted and rejected the highest number of vouchers. The second in the
list was the gold status and the last was platinum customers.
Figure 3
Marketing 6
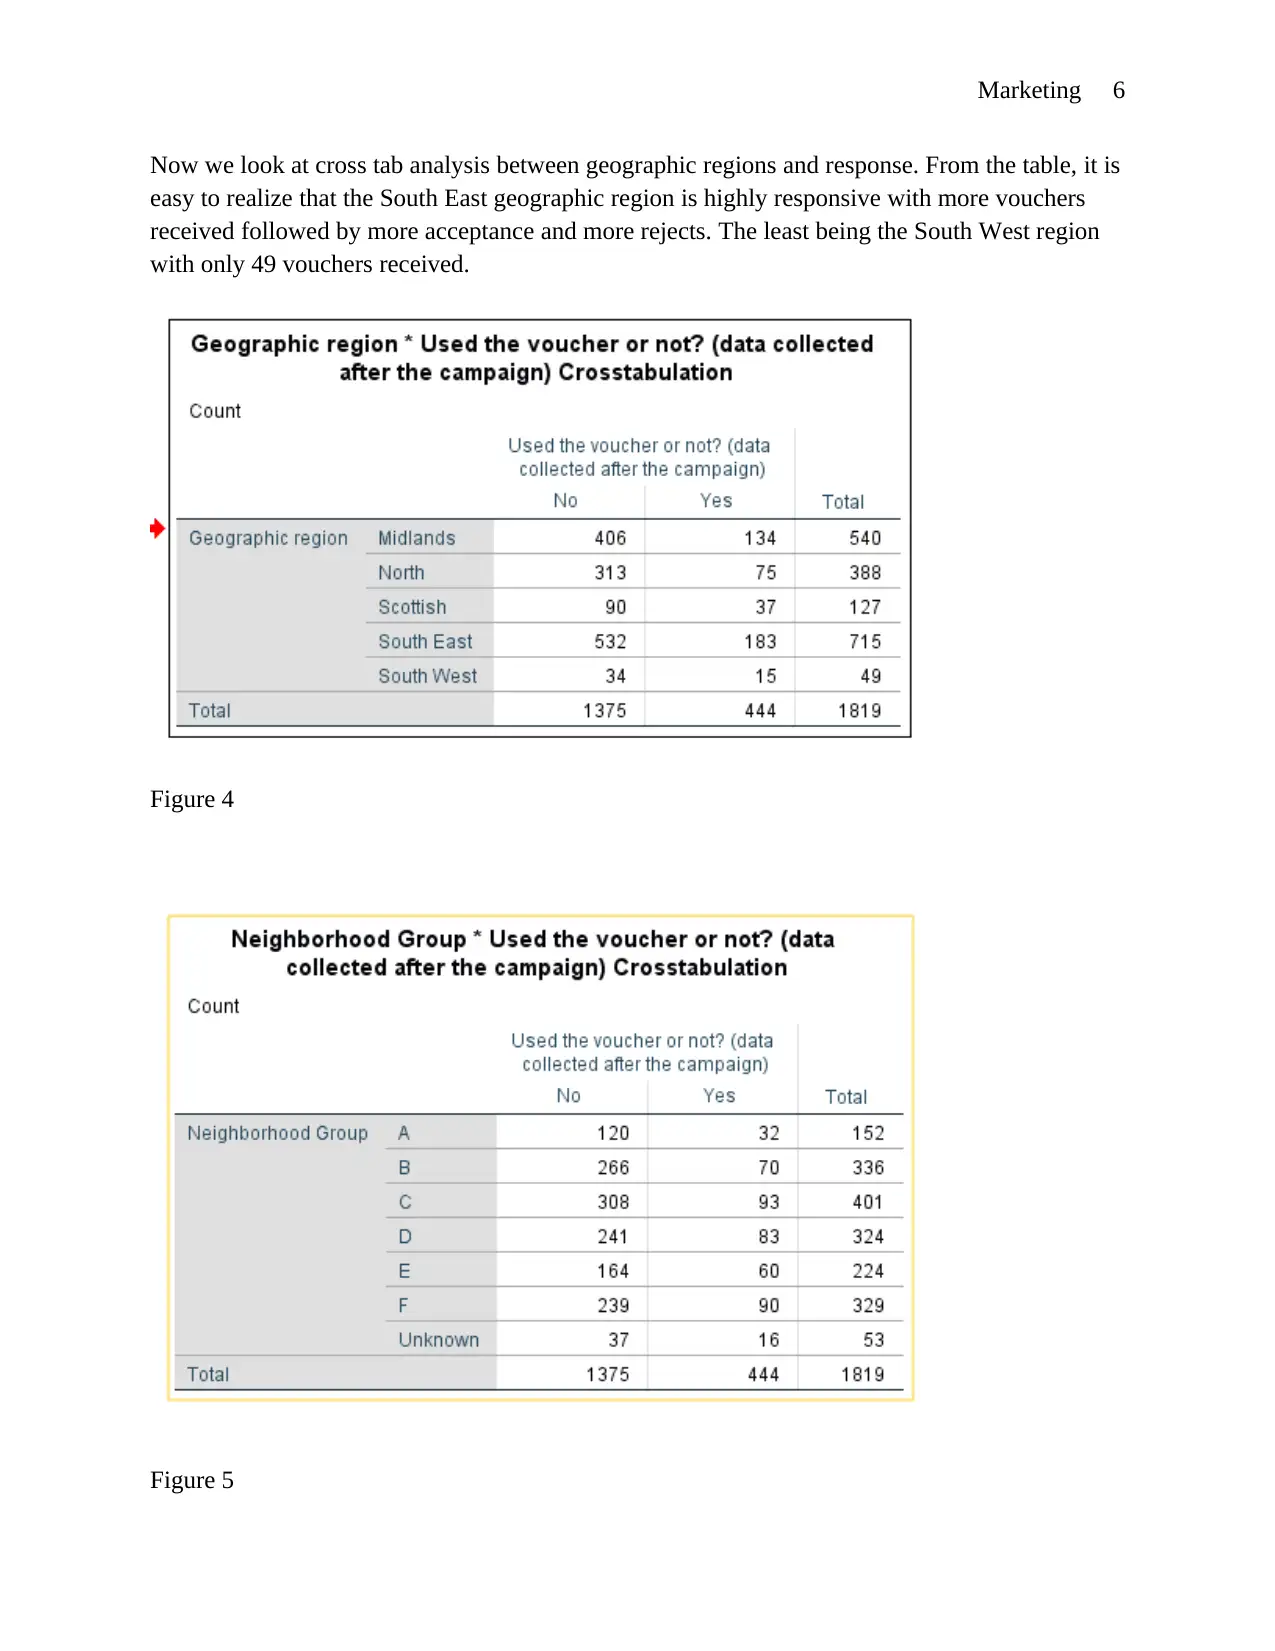
Now we look at cross tab analysis between geographic regions and response. From the table, it is
easy to realize that the South East geographic region is highly responsive with more vouchers
received followed by more acceptance and more rejects. The least being the South West region
with only 49 vouchers received.
Figure 4
Figure 5
⊘ This is a preview!⊘
Do you want full access?
Subscribe today to unlock all pages.
Trusted by 1+ million students worldwide
Marketing 7
From figure 5, the sub-variables are many hence the larger spread of all the numbers with
fewer numbers for with neighbourhood C coming up at the top and the unknown neighbourhoods
for which the vouchers were sent recording the least of values.
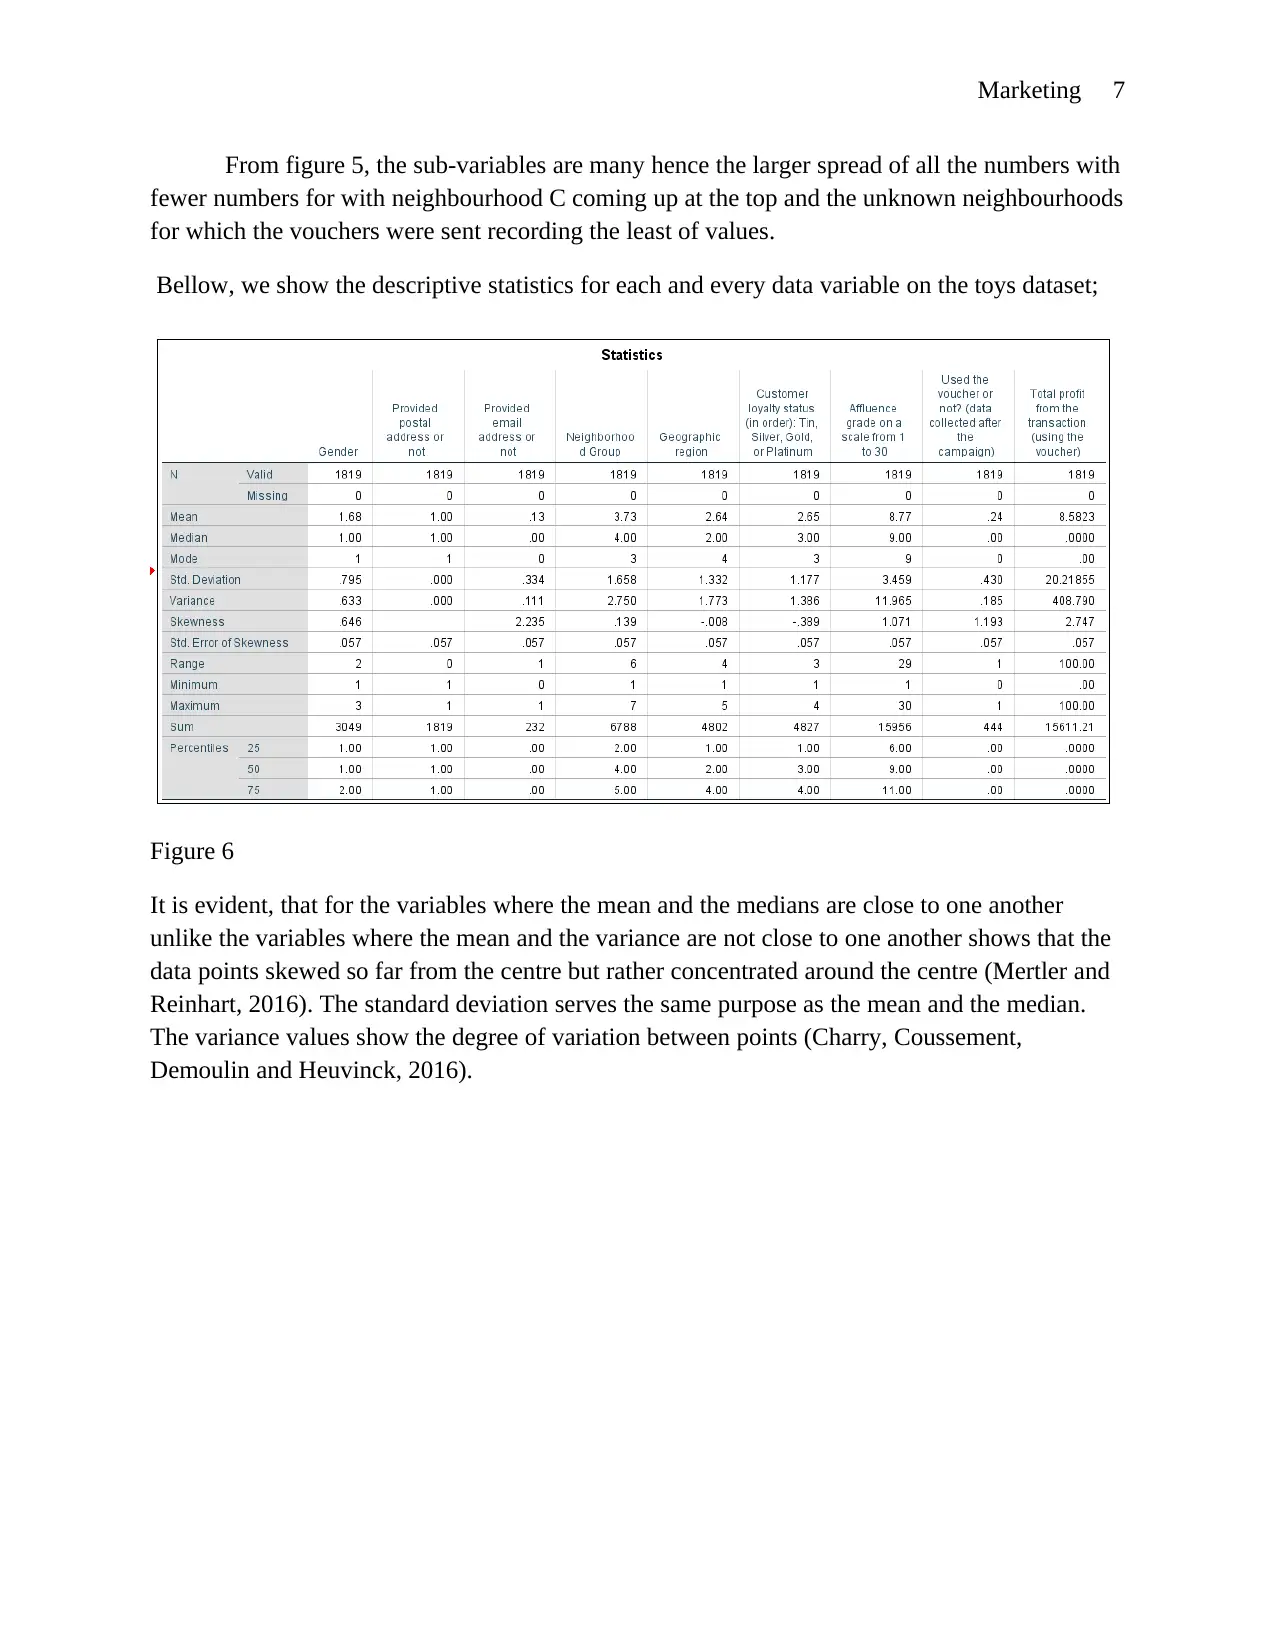
Bellow, we show the descriptive statistics for each and every data variable on the toys dataset;
Figure 6
It is evident, that for the variables where the mean and the medians are close to one another
unlike the variables where the mean and the variance are not close to one another shows that the
data points skewed so far from the centre but rather concentrated around the centre (Mertler and
Reinhart, 2016). The standard deviation serves the same purpose as the mean and the median.
The variance values show the degree of variation between points (Charry, Coussement,
Demoulin and Heuvinck, 2016).
From figure 5, the sub-variables are many hence the larger spread of all the numbers with
fewer numbers for with neighbourhood C coming up at the top and the unknown neighbourhoods
for which the vouchers were sent recording the least of values.
Bellow, we show the descriptive statistics for each and every data variable on the toys dataset;
Figure 6
It is evident, that for the variables where the mean and the medians are close to one another
unlike the variables where the mean and the variance are not close to one another shows that the
data points skewed so far from the centre but rather concentrated around the centre (Mertler and
Reinhart, 2016). The standard deviation serves the same purpose as the mean and the median.
The variance values show the degree of variation between points (Charry, Coussement,
Demoulin and Heuvinck, 2016).
Paraphrase This Document
Need a fresh take? Get an instant paraphrase of this document with our AI Paraphraser
Marketing 8
Predictive Response Model
For this section, I will build a logistic regression model which will help identify a subset
of customers who are more likely to respond to the vouchers based on information about
response behaviour so that they can be singled out for a campaign designed to promote retention.
For the logistic predictive model, we are to test if the variables give a probability value which is
0.5 and below. If by any chance any variable has a probability value of more than 0.5 then we
will have to drop that variable as we run the remaining variables to get a more statistically
significant logistic regression. There are other less significant variables that we will have to drop
and these are; PROFIT, CUSTID, ADDRESS,LCDATE, EDATE. After knowing the variables
to drop we will the move to the analyze button on SPSS, then regression and finally bivariate
logistic. From there a tab pops up in which we choose the respective variables that we are to use,
we must have our dependent variable as response and then followed by our choice of
independent variables (Pan, Wang and Li, 2016).
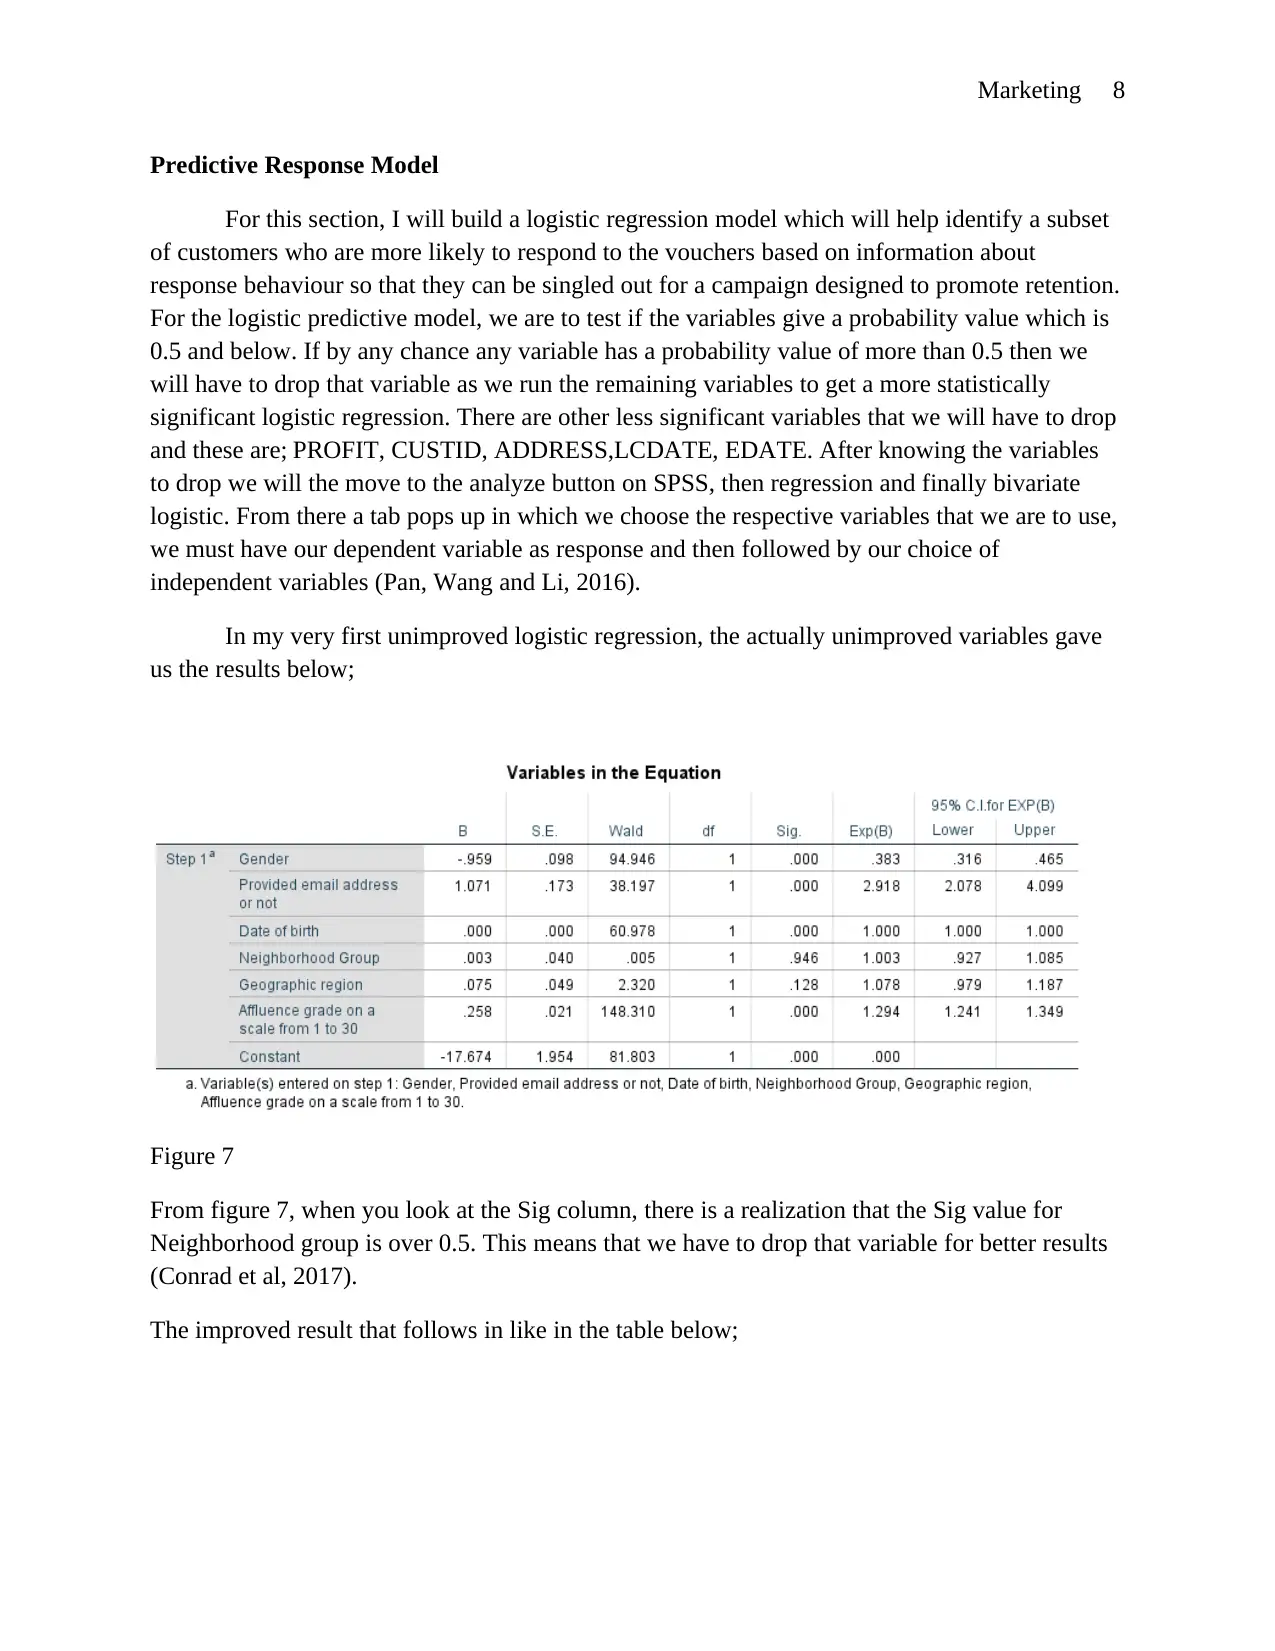
In my very first unimproved logistic regression, the actually unimproved variables gave
us the results below;
Figure 7
From figure 7, when you look at the Sig column, there is a realization that the Sig value for
Neighborhood group is over 0.5. This means that we have to drop that variable for better results
(Conrad et al, 2017).
The improved result that follows in like in the table below;
Predictive Response Model
For this section, I will build a logistic regression model which will help identify a subset
of customers who are more likely to respond to the vouchers based on information about
response behaviour so that they can be singled out for a campaign designed to promote retention.
For the logistic predictive model, we are to test if the variables give a probability value which is
0.5 and below. If by any chance any variable has a probability value of more than 0.5 then we
will have to drop that variable as we run the remaining variables to get a more statistically
significant logistic regression. There are other less significant variables that we will have to drop
and these are; PROFIT, CUSTID, ADDRESS,LCDATE, EDATE. After knowing the variables
to drop we will the move to the analyze button on SPSS, then regression and finally bivariate
logistic. From there a tab pops up in which we choose the respective variables that we are to use,
we must have our dependent variable as response and then followed by our choice of
independent variables (Pan, Wang and Li, 2016).
In my very first unimproved logistic regression, the actually unimproved variables gave
us the results below;
Figure 7
From figure 7, when you look at the Sig column, there is a realization that the Sig value for
Neighborhood group is over 0.5. This means that we have to drop that variable for better results
(Conrad et al, 2017).
The improved result that follows in like in the table below;
Marketing 9
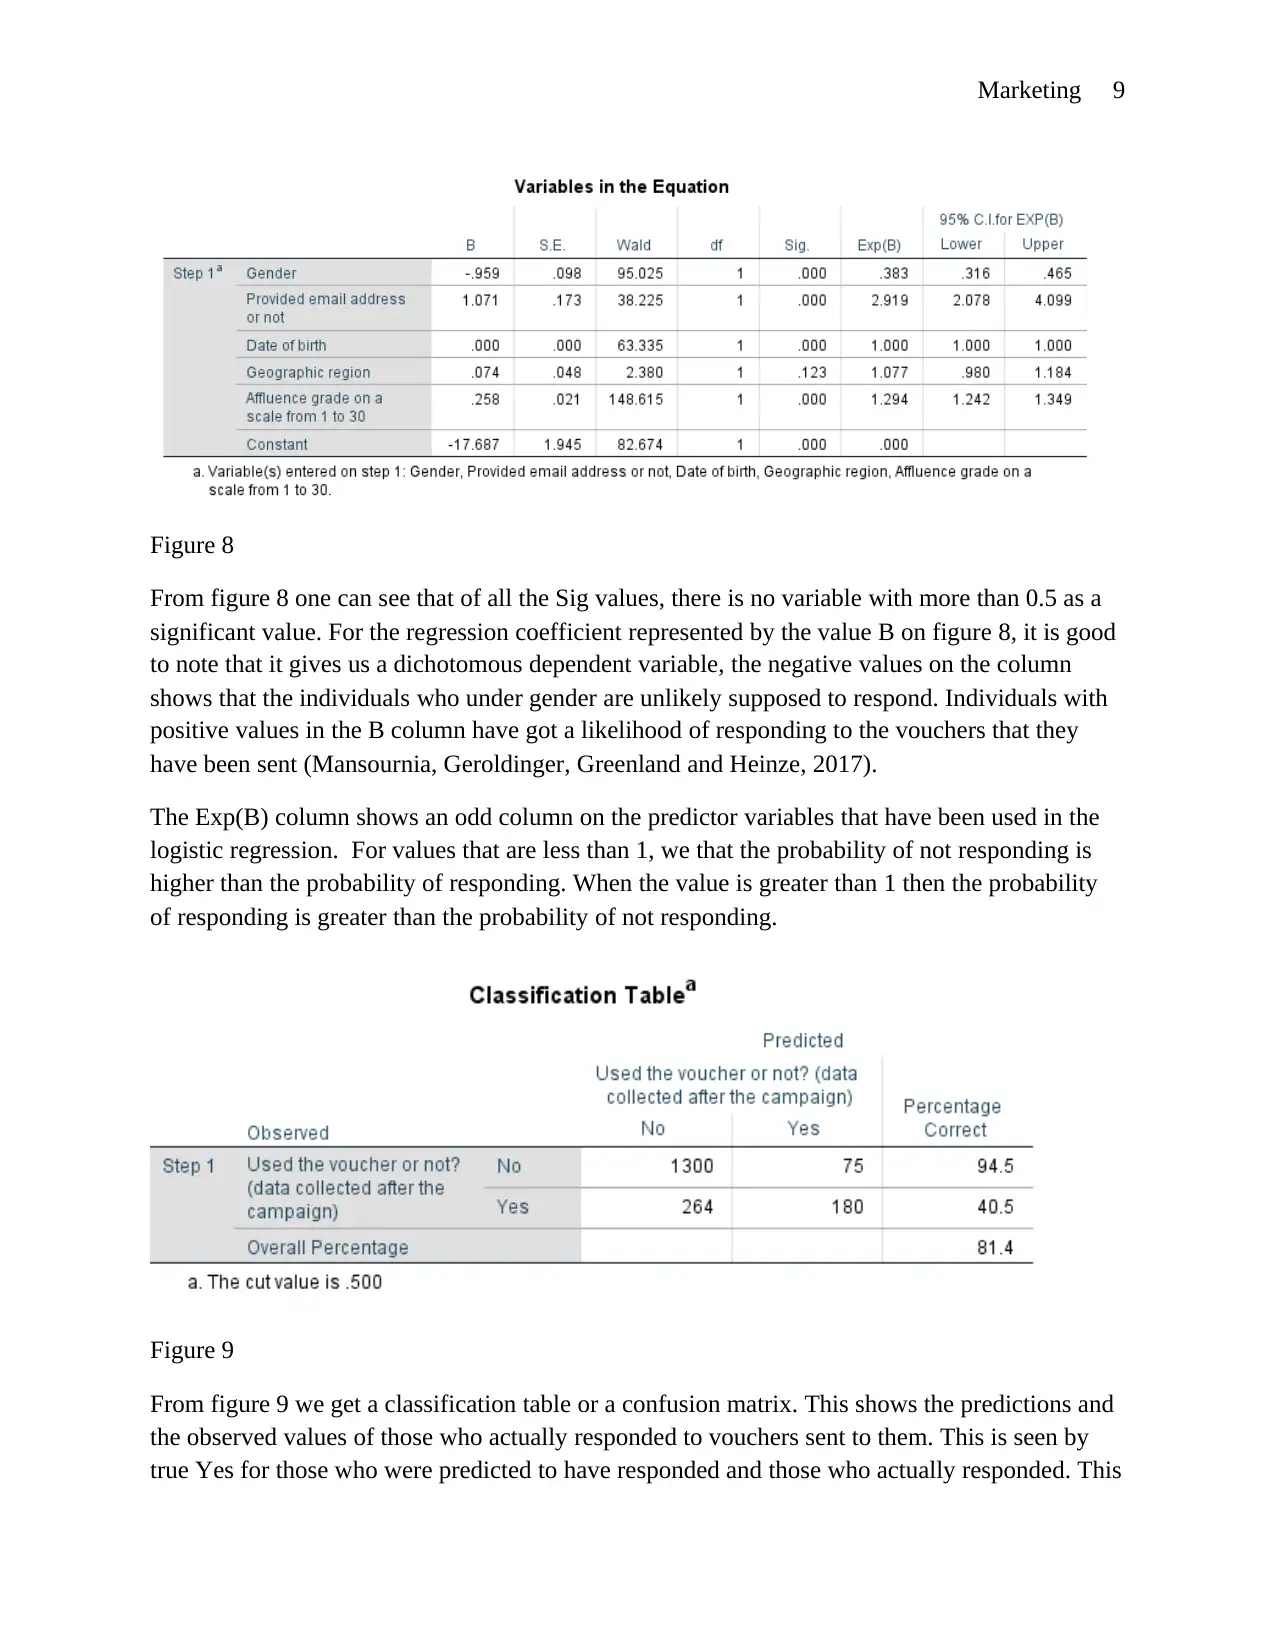
Figure 8
From figure 8 one can see that of all the Sig values, there is no variable with more than 0.5 as a
significant value. For the regression coefficient represented by the value B on figure 8, it is good
to note that it gives us a dichotomous dependent variable, the negative values on the column
shows that the individuals who under gender are unlikely supposed to respond. Individuals with
positive values in the B column have got a likelihood of responding to the vouchers that they
have been sent (Mansournia, Geroldinger, Greenland and Heinze, 2017).
The Exp(B) column shows an odd column on the predictor variables that have been used in the
logistic regression. For values that are less than 1, we that the probability of not responding is
higher than the probability of responding. When the value is greater than 1 then the probability
of responding is greater than the probability of not responding.
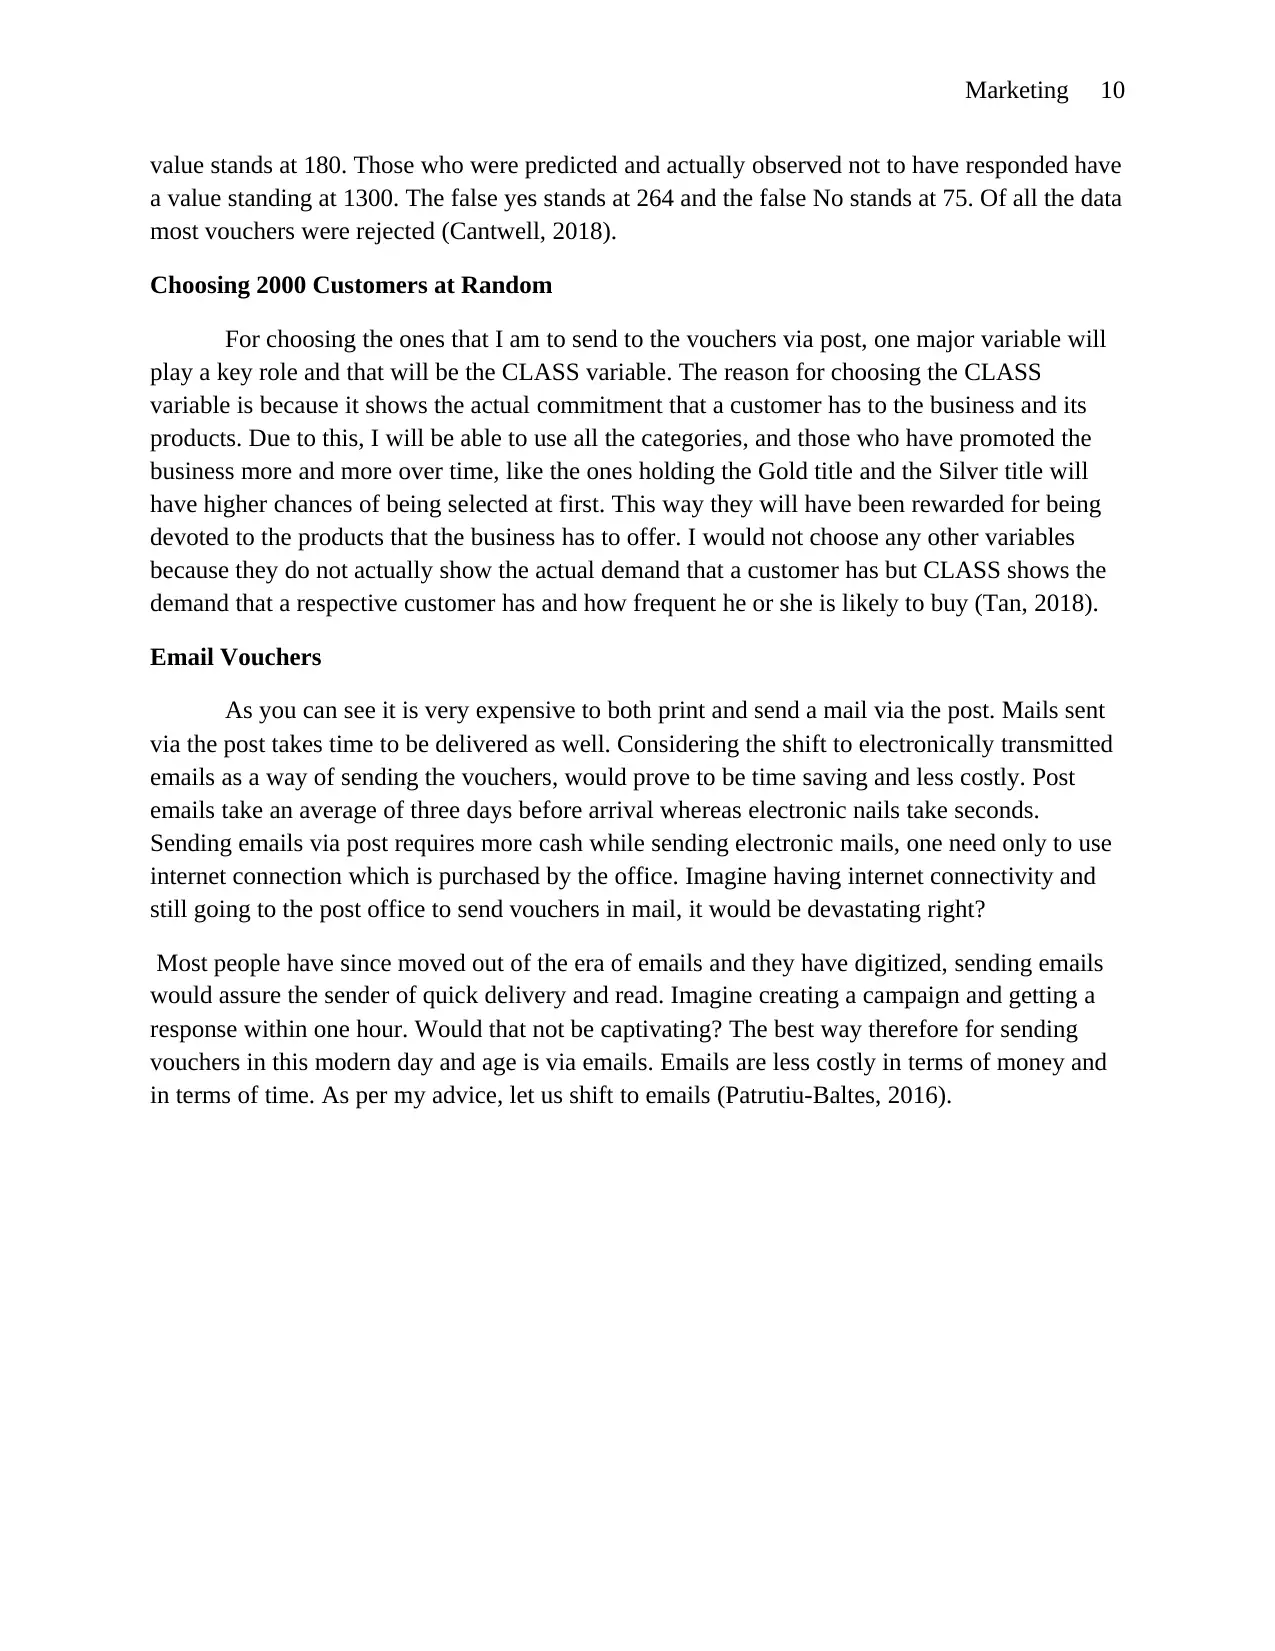
Figure 9
From figure 9 we get a classification table or a confusion matrix. This shows the predictions and
the observed values of those who actually responded to vouchers sent to them. This is seen by
true Yes for those who were predicted to have responded and those who actually responded. This
Figure 8
From figure 8 one can see that of all the Sig values, there is no variable with more than 0.5 as a
significant value. For the regression coefficient represented by the value B on figure 8, it is good
to note that it gives us a dichotomous dependent variable, the negative values on the column
shows that the individuals who under gender are unlikely supposed to respond. Individuals with
positive values in the B column have got a likelihood of responding to the vouchers that they
have been sent (Mansournia, Geroldinger, Greenland and Heinze, 2017).
The Exp(B) column shows an odd column on the predictor variables that have been used in the
logistic regression. For values that are less than 1, we that the probability of not responding is
higher than the probability of responding. When the value is greater than 1 then the probability
of responding is greater than the probability of not responding.
Figure 9
From figure 9 we get a classification table or a confusion matrix. This shows the predictions and
the observed values of those who actually responded to vouchers sent to them. This is seen by
true Yes for those who were predicted to have responded and those who actually responded. This
⊘ This is a preview!⊘
Do you want full access?
Subscribe today to unlock all pages.
Trusted by 1+ million students worldwide
Marketing 10
value stands at 180. Those who were predicted and actually observed not to have responded have
a value standing at 1300. The false yes stands at 264 and the false No stands at 75. Of all the data
most vouchers were rejected (Cantwell, 2018).
Choosing 2000 Customers at Random
For choosing the ones that I am to send to the vouchers via post, one major variable will
play a key role and that will be the CLASS variable. The reason for choosing the CLASS
variable is because it shows the actual commitment that a customer has to the business and its
products. Due to this, I will be able to use all the categories, and those who have promoted the
business more and more over time, like the ones holding the Gold title and the Silver title will
have higher chances of being selected at first. This way they will have been rewarded for being
devoted to the products that the business has to offer. I would not choose any other variables
because they do not actually show the actual demand that a customer has but CLASS shows the
demand that a respective customer has and how frequent he or she is likely to buy (Tan, 2018).
Email Vouchers
As you can see it is very expensive to both print and send a mail via the post. Mails sent
via the post takes time to be delivered as well. Considering the shift to electronically transmitted
emails as a way of sending the vouchers, would prove to be time saving and less costly. Post
emails take an average of three days before arrival whereas electronic nails take seconds.
Sending emails via post requires more cash while sending electronic mails, one need only to use
internet connection which is purchased by the office. Imagine having internet connectivity and
still going to the post office to send vouchers in mail, it would be devastating right?
Most people have since moved out of the era of emails and they have digitized, sending emails
would assure the sender of quick delivery and read. Imagine creating a campaign and getting a
response within one hour. Would that not be captivating? The best way therefore for sending
vouchers in this modern day and age is via emails. Emails are less costly in terms of money and
in terms of time. As per my advice, let us shift to emails (Patrutiu-Baltes, 2016).
Paraphrase This Document
Need a fresh take? Get an instant paraphrase of this document with our AI Paraphraser
Marketing 11
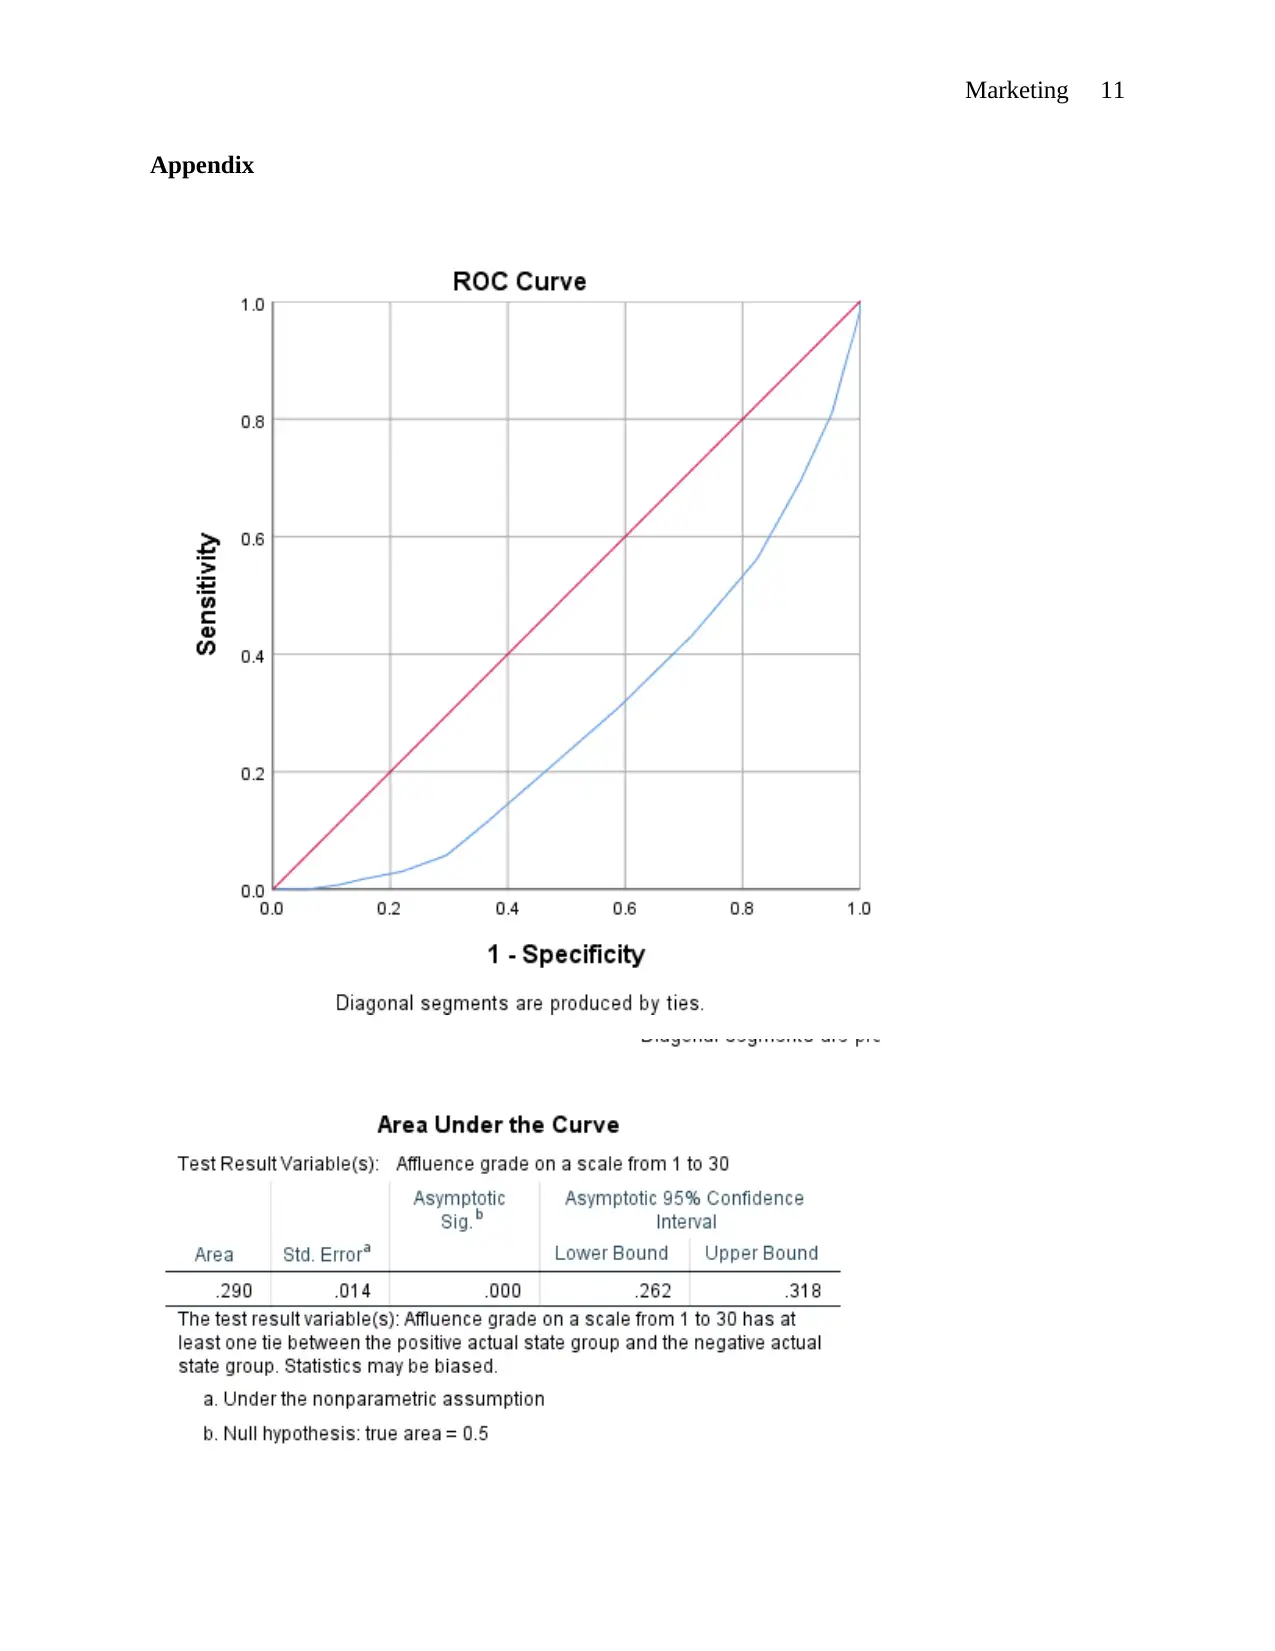
Appendix
Appendix
Marketing 12
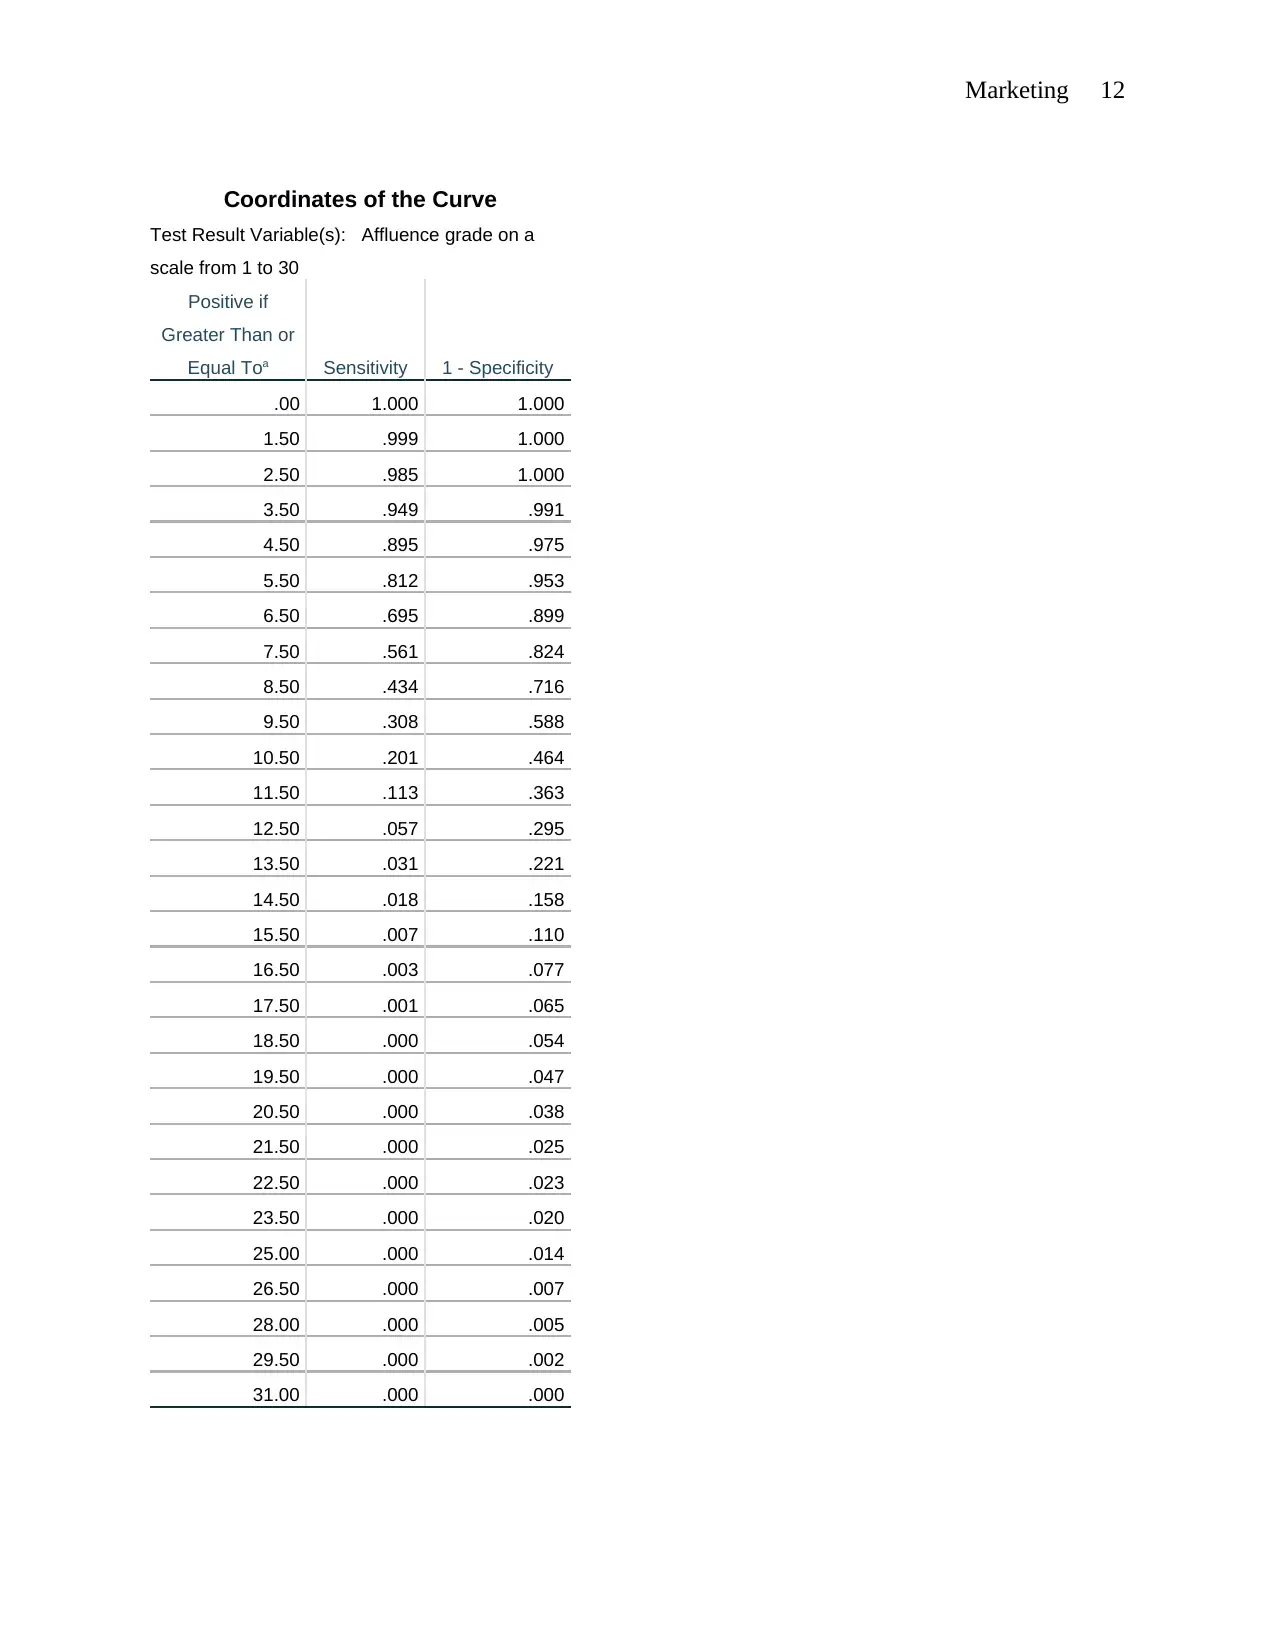
Coordinates of the Curve
Test Result Variable(s): Affluence grade on a
scale from 1 to 30
Positive if
Greater Than or
Equal Toa Sensitivity 1 - Specificity
.00 1.000 1.000
1.50 .999 1.000
2.50 .985 1.000
3.50 .949 .991
4.50 .895 .975
5.50 .812 .953
6.50 .695 .899
7.50 .561 .824
8.50 .434 .716
9.50 .308 .588
10.50 .201 .464
11.50 .113 .363
12.50 .057 .295
13.50 .031 .221
14.50 .018 .158
15.50 .007 .110
16.50 .003 .077
17.50 .001 .065
18.50 .000 .054
19.50 .000 .047
20.50 .000 .038
21.50 .000 .025
22.50 .000 .023
23.50 .000 .020
25.00 .000 .014
26.50 .000 .007
28.00 .000 .005
29.50 .000 .002
31.00 .000 .000
⊘ This is a preview!⊘
Do you want full access?
Subscribe today to unlock all pages.
Trusted by 1+ million students worldwide
1 out of 15
Related Documents


Your All-in-One AI-Powered Toolkit for Academic Success.
+13062052269
info@desklib.com
Available 24*7 on WhatsApp / Email
![[object Object]](/_next/static/media/star-bottom.7253800d.svg)
Unlock your academic potential
Copyright © 2020–2026 A2Z Services. All Rights Reserved. Developed and managed by ZUCOL.