Comprehensive Report: Data Collection, Experiment Design, and Analysis
VerifiedAdded on 2020/05/11
|23
|3198
|47
Report
AI Summary
This report details the process of data collection, experiment design, and result analysis, focusing on a study of Bluetooth technology usage. It begins with an introduction to data collection methods, including observation, simulation, and the questionnaire method, emphasizing the importance of data sources and the data collection process. The report then covers data storage, experimental design, and implementation, including data pre-processing and feature selection. The core of the report outlines the design of an experiment to determine Bluetooth usage in Australia, detailing the questionnaire design, expected outputs, and potential challenges. It also provides a comprehensive overview of data recording, storage, and the anticipated results, including the use of tables and charts to represent the findings. The report concludes with a discussion of potential problems and challenges that may arise during the research process, offering a thorough guide to conducting effective data-driven research.
1
INTRODUCTION TO RESEARCH
The Name of the Student
The Name of the Course
The Name of the Professor
The Name of the School
The City and State where the school is located
Date
INTRODUCTION TO RESEARCH
The Name of the Student
The Name of the Course
The Name of the Professor
The Name of the School
The City and State where the school is located
Date
Paraphrase This Document
Need a fresh take? Get an instant paraphrase of this document with our AI Paraphraser
2
Table of Contents
List of Tables........................................................................................................................3
1.0 Collection of data............................................................................................................4
1.1 The available data sources...........................................................................................5
1.2 The data collection process..........................................................................................5
1.3 Storage of the collected data........................................................................................6
2.0 Design and implementation of experiment..................................................................7
2.1 Data pre-processing......................................................................................................7
2.2 Feature selection or dimension reduction....................................................................8
2.3 Experiment design........................................................................................................9
2.3.1 The design steps..................................................................................................10
2.3.2 The expected output of the research....................................................................12
2.3.3 The potential problems........................................................................................16
2.4 implementation of the research..................................................................................17
3.0 Result analysis and summary......................................................................................18
3.1 The expected results...................................................................................................18
3.2 Results analysis..........................................................................................................18
4.0 The outline of the experiment and result analysis.....................................................19
3
References...........................................................................................................................21
List of Tables
Table 1: Data recording table.............................................................................................6
Table 2: A sample table which can be used for storage of data.......................................6
Table 3: Data pre-processing table.....................................................................................9
Table 4: A table of the expected output of the research.................................................12
Table 5: A table showing the hypothetical results of our research................................17
⊘ This is a preview!⊘
Do you want full access?
Subscribe today to unlock all pages.
Trusted by 1+ million students worldwide
4
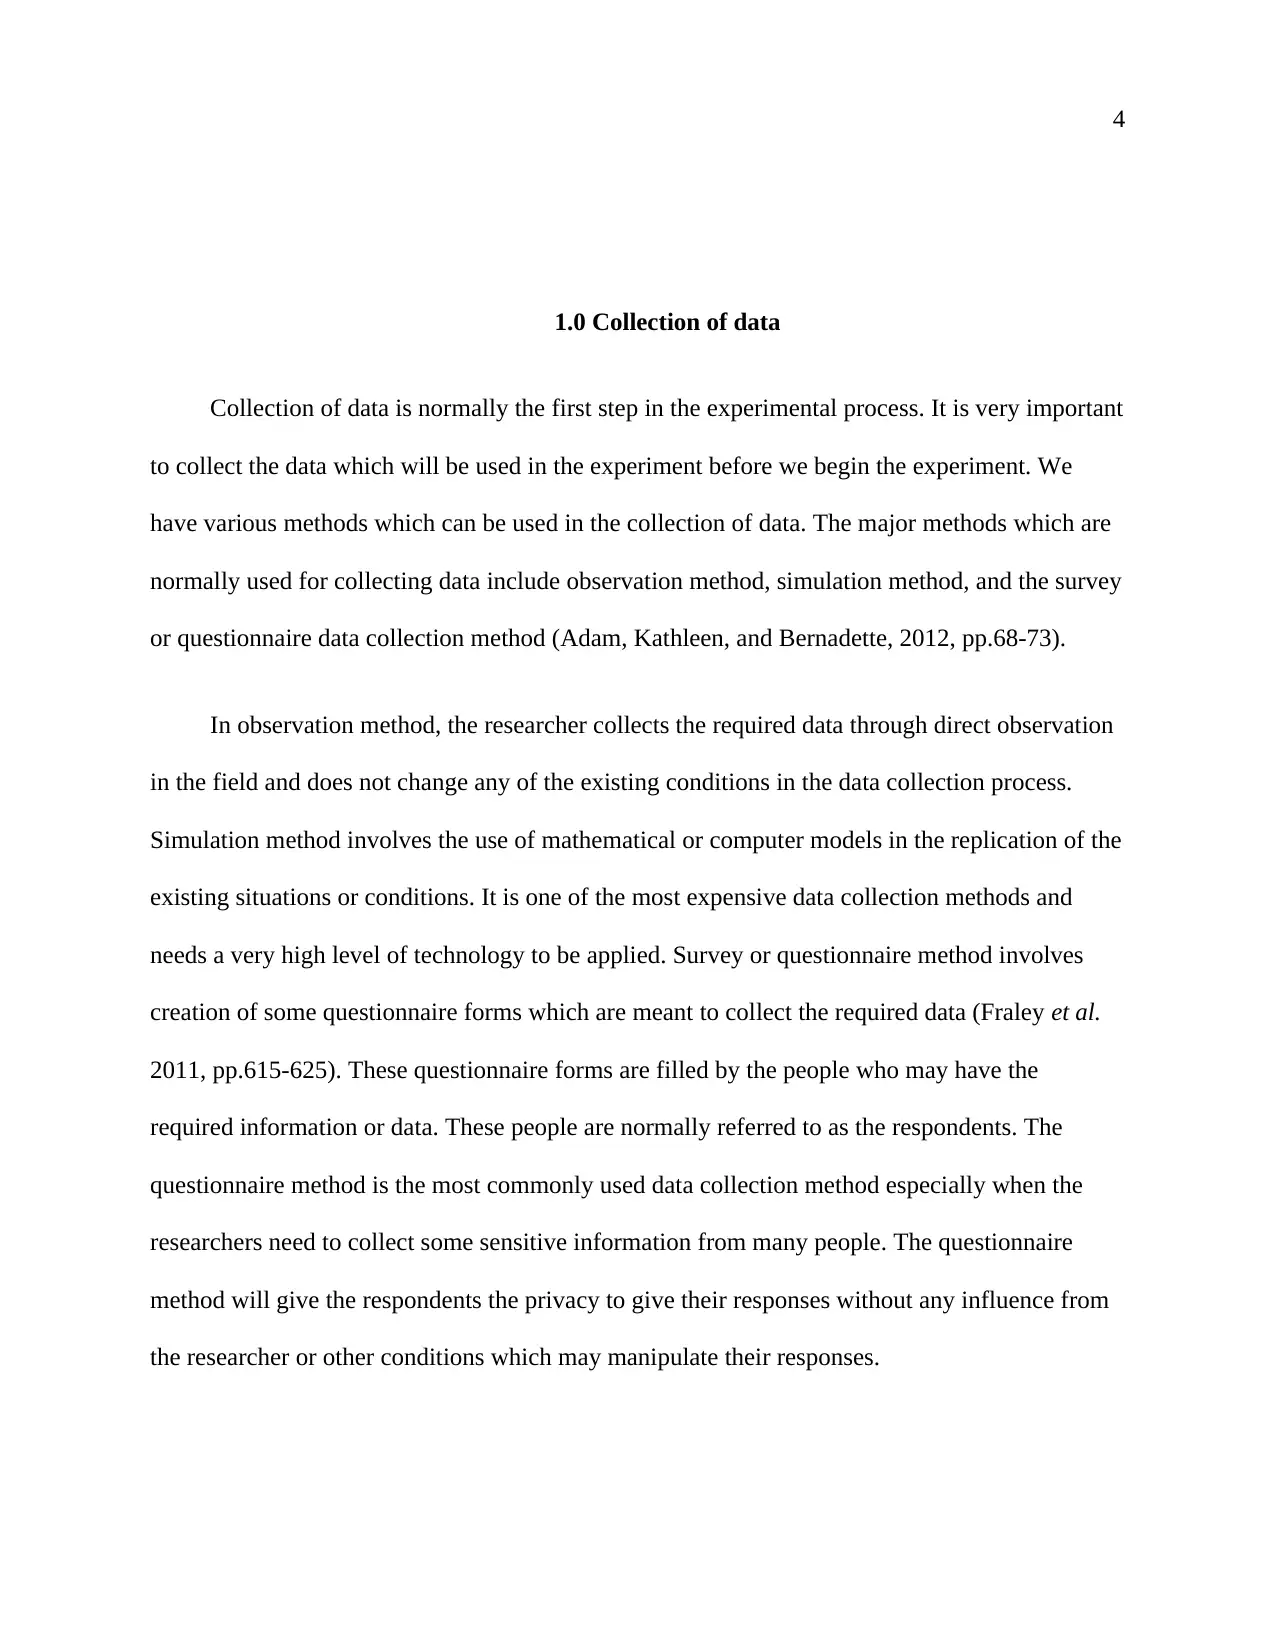
1.0 Collection of data
Collection of data is normally the first step in the experimental process. It is very important
to collect the data which will be used in the experiment before we begin the experiment. We
have various methods which can be used in the collection of data. The major methods which are
normally used for collecting data include observation method, simulation method, and the survey
or questionnaire data collection method (Adam, Kathleen, and Bernadette, 2012, pp.68-73).
In observation method, the researcher collects the required data through direct observation
in the field and does not change any of the existing conditions in the data collection process.
Simulation method involves the use of mathematical or computer models in the replication of the
existing situations or conditions. It is one of the most expensive data collection methods and
needs a very high level of technology to be applied. Survey or questionnaire method involves
creation of some questionnaire forms which are meant to collect the required data (Fraley et al.
2011, pp.615-625). These questionnaire forms are filled by the people who may have the
required information or data. These people are normally referred to as the respondents. The
questionnaire method is the most commonly used data collection method especially when the
researchers need to collect some sensitive information from many people. The questionnaire
method will give the respondents the privacy to give their responses without any influence from
the researcher or other conditions which may manipulate their responses.
Paraphrase This Document
Need a fresh take? Get an instant paraphrase of this document with our AI Paraphraser
5
1.1 The available data sources
Our research involves the study of the use of Bluetooth in Australia. The available sources
of the data of our research are the people who use Bluetooth technology. The available sources
of data include companies, higher learning institutions, people’s parks, and towns. The identified
sources have big crowds of people, and many of these people use Bluetooth technology. This
will simplify our data collection process since we can come across many respondents in these
places.
1.2 The data collection process
After identifying the available sources of data, the researchers should proceed to the field
to collect the required data. The best method of data collection to be applied in this research is
questionnaire method. The respondents from different places will be given the questionnaire
forms which contain the questions to be answered, and they will be allowed to give their
responses in those questionnaire forms without any undue influence (Brace, 2008). After
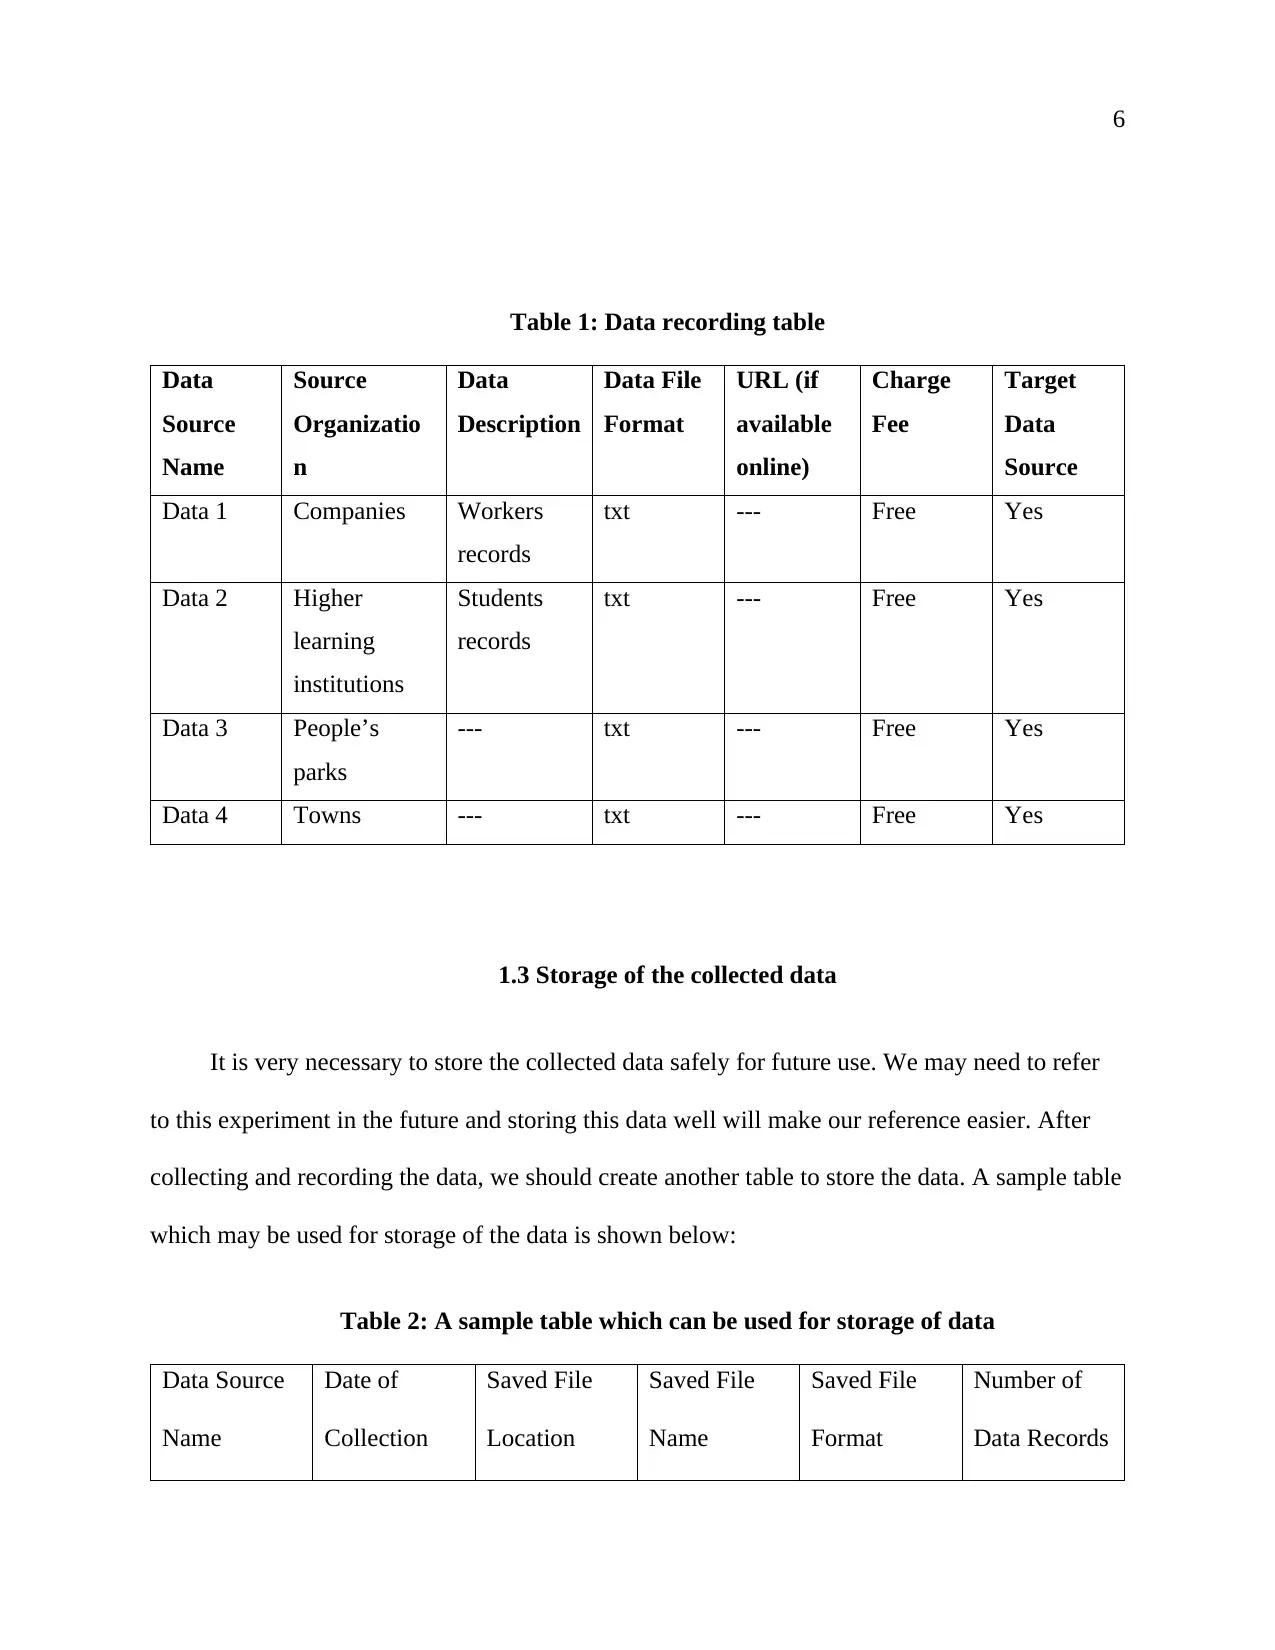
collecting the required data, the researchers should record their data in a table. A sample table
which can be used to record the collected data is shown below:
1.1 The available data sources
Our research involves the study of the use of Bluetooth in Australia. The available sources
of the data of our research are the people who use Bluetooth technology. The available sources
of data include companies, higher learning institutions, people’s parks, and towns. The identified
sources have big crowds of people, and many of these people use Bluetooth technology. This
will simplify our data collection process since we can come across many respondents in these
places.
1.2 The data collection process
After identifying the available sources of data, the researchers should proceed to the field
to collect the required data. The best method of data collection to be applied in this research is
questionnaire method. The respondents from different places will be given the questionnaire
forms which contain the questions to be answered, and they will be allowed to give their
responses in those questionnaire forms without any undue influence (Brace, 2008). After
collecting the required data, the researchers should record their data in a table. A sample table
which can be used to record the collected data is shown below:
6
Table 1: Data recording table
Data
Source
Name
Source
Organizatio
n
Data
Description
Data File
Format
URL (if
available
online)
Charge
Fee
Target
Data
Source
Data 1 Companies Workers
records
txt --- Free Yes
Data 2 Higher
learning
institutions
Students
records
txt --- Free Yes
Data 3 People’s
parks
--- txt --- Free Yes
Data 4 Towns --- txt --- Free Yes
1.3 Storage of the collected data
It is very necessary to store the collected data safely for future use. We may need to refer
to this experiment in the future and storing this data well will make our reference easier. After
collecting and recording the data, we should create another table to store the data. A sample table
which may be used for storage of the data is shown below:
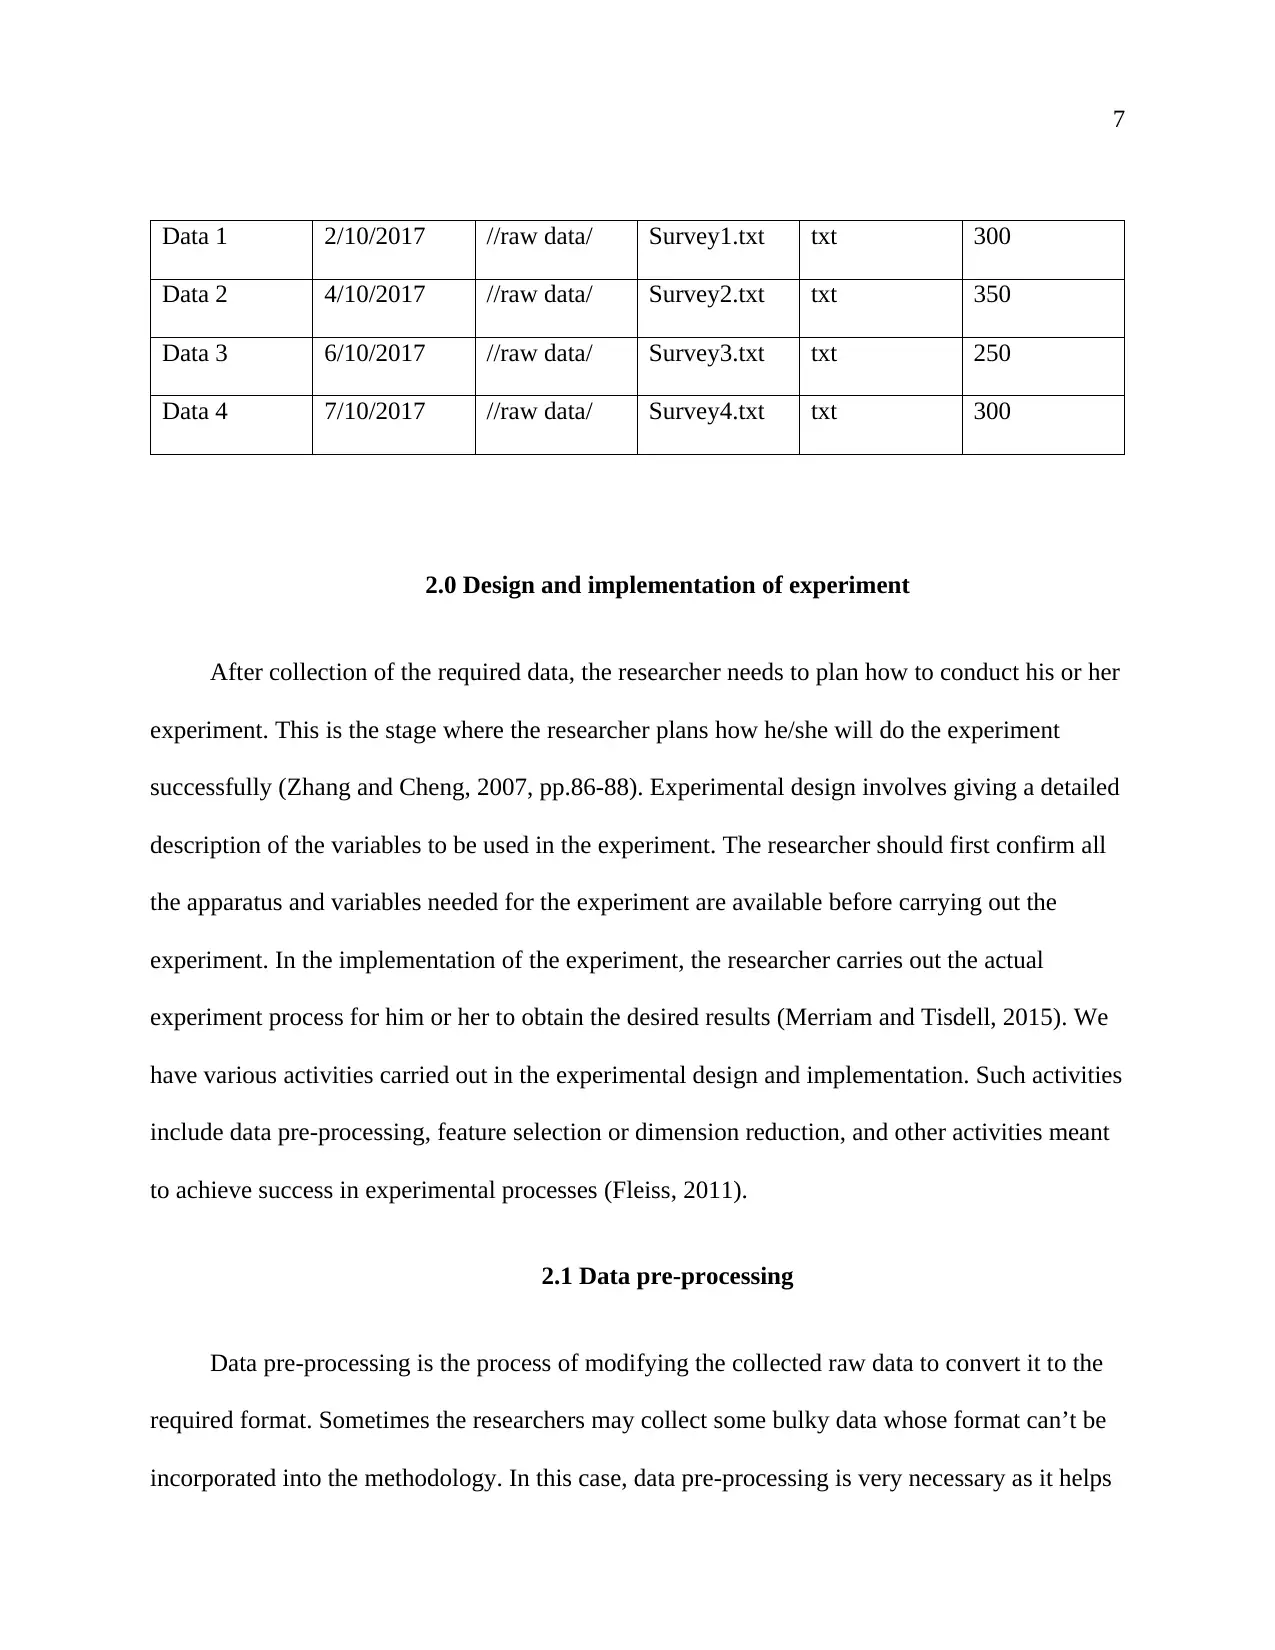
Table 2: A sample table which can be used for storage of data
Data Source
Name
Date of
Collection
Saved File
Location
Saved File
Name
Saved File
Format
Number of
Data Records
Table 1: Data recording table
Data
Source
Name
Source
Organizatio
n
Data
Description
Data File
Format
URL (if
available
online)
Charge
Fee
Target
Data
Source
Data 1 Companies Workers
records
txt --- Free Yes
Data 2 Higher
learning
institutions
Students
records
txt --- Free Yes
Data 3 People’s
parks
--- txt --- Free Yes
Data 4 Towns --- txt --- Free Yes
1.3 Storage of the collected data
It is very necessary to store the collected data safely for future use. We may need to refer
to this experiment in the future and storing this data well will make our reference easier. After
collecting and recording the data, we should create another table to store the data. A sample table
which may be used for storage of the data is shown below:
Table 2: A sample table which can be used for storage of data
Data Source
Name
Date of
Collection
Saved File
Location
Saved File
Name
Saved File
Format
Number of
Data Records
⊘ This is a preview!⊘
Do you want full access?
Subscribe today to unlock all pages.
Trusted by 1+ million students worldwide
7
Data 1 2/10/2017 //raw data/ Survey1.txt txt 300
Data 2 4/10/2017 //raw data/ Survey2.txt txt 350
Data 3 6/10/2017 //raw data/ Survey3.txt txt 250
Data 4 7/10/2017 //raw data/ Survey4.txt txt 300
2.0 Design and implementation of experiment
After collection of the required data, the researcher needs to plan how to conduct his or her
experiment. This is the stage where the researcher plans how he/she will do the experiment
successfully (Zhang and Cheng, 2007, pp.86-88). Experimental design involves giving a detailed
description of the variables to be used in the experiment. The researcher should first confirm all
the apparatus and variables needed for the experiment are available before carrying out the
experiment. In the implementation of the experiment, the researcher carries out the actual
experiment process for him or her to obtain the desired results (Merriam and Tisdell, 2015). We
have various activities carried out in the experimental design and implementation. Such activities
include data pre-processing, feature selection or dimension reduction, and other activities meant
to achieve success in experimental processes (Fleiss, 2011).
2.1 Data pre-processing
Data pre-processing is the process of modifying the collected raw data to convert it to the
required format. Sometimes the researchers may collect some bulky data whose format can’t be
incorporated into the methodology. In this case, data pre-processing is very necessary as it helps
Paraphrase This Document
Need a fresh take? Get an instant paraphrase of this document with our AI Paraphraser
8
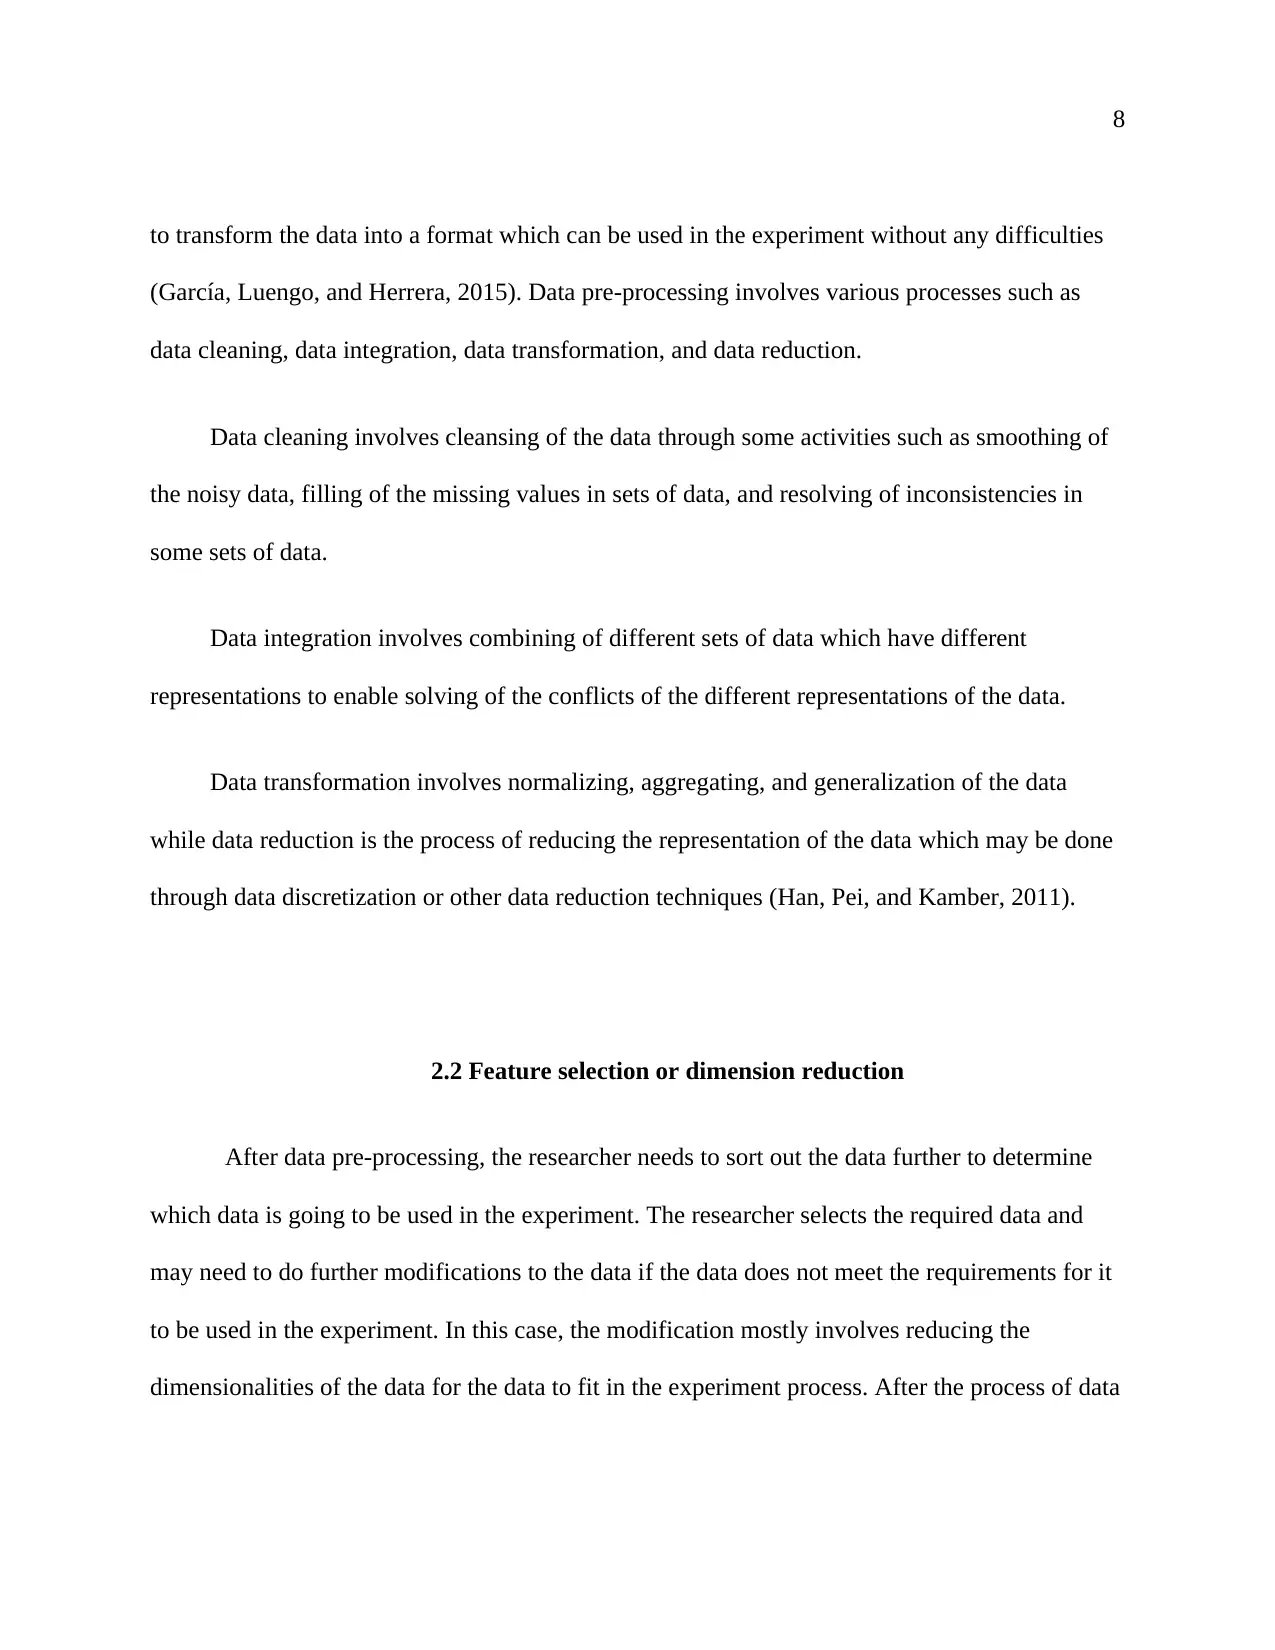
to transform the data into a format which can be used in the experiment without any difficulties
(García, Luengo, and Herrera, 2015). Data pre-processing involves various processes such as
data cleaning, data integration, data transformation, and data reduction.
Data cleaning involves cleansing of the data through some activities such as smoothing of
the noisy data, filling of the missing values in sets of data, and resolving of inconsistencies in
some sets of data.
Data integration involves combining of different sets of data which have different
representations to enable solving of the conflicts of the different representations of the data.
Data transformation involves normalizing, aggregating, and generalization of the data
while data reduction is the process of reducing the representation of the data which may be done
through data discretization or other data reduction techniques (Han, Pei, and Kamber, 2011).
2.2 Feature selection or dimension reduction
After data pre-processing, the researcher needs to sort out the data further to determine
which data is going to be used in the experiment. The researcher selects the required data and
may need to do further modifications to the data if the data does not meet the requirements for it
to be used in the experiment. In this case, the modification mostly involves reducing the
dimensionalities of the data for the data to fit in the experiment process. After the process of data
9
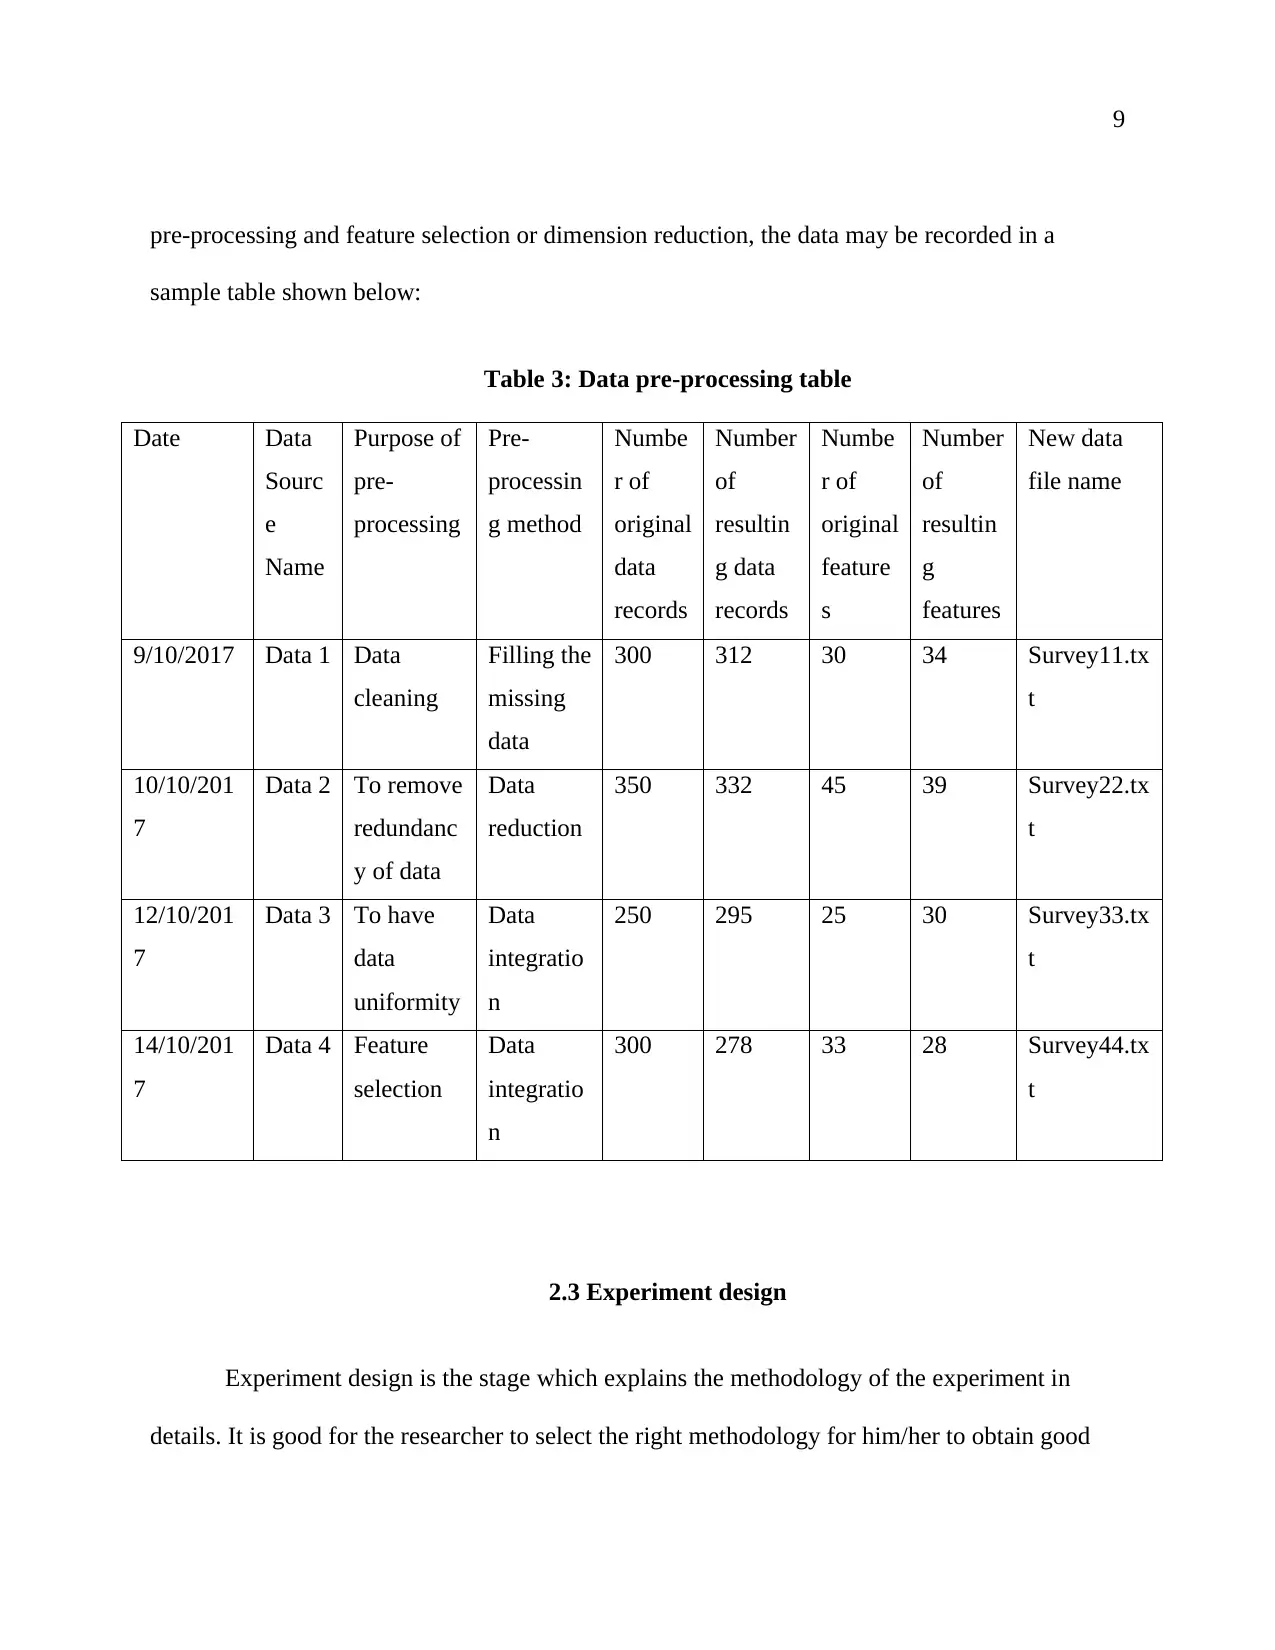
pre-processing and feature selection or dimension reduction, the data may be recorded in a
sample table shown below:
Table 3: Data pre-processing table
Date Data
Sourc
e
Name
Purpose of
pre-
processing
Pre-
processin
g method
Numbe
r of
original
data
records
Number
of
resultin
g data
records
Numbe
r of
original
feature
s
Number
of
resultin
g
features
New data
file name
9/10/2017 Data 1 Data
cleaning
Filling the
missing
data
300 312 30 34 Survey11.tx
t
10/10/201
7
Data 2 To remove
redundanc
y of data
Data
reduction
350 332 45 39 Survey22.tx
t
12/10/201
7
Data 3 To have
data
uniformity
Data
integratio
n
250 295 25 30 Survey33.tx
t
14/10/201
7
Data 4 Feature
selection
Data
integratio
n
300 278 33 28 Survey44.tx
t
2.3 Experiment design
Experiment design is the stage which explains the methodology of the experiment in
details. It is good for the researcher to select the right methodology for him/her to obtain good
⊘ This is a preview!⊘
Do you want full access?
Subscribe today to unlock all pages.
Trusted by 1+ million students worldwide
10
results from the experimental research. We have three methodologies which are commonly used
in research. The three methodologies are quantitative, qualitative and mixed methods research
methodologies (Creswell, 2013). In our research, we are going to use qualitative research
methodology which is a bit cheaper compared to the other research methodologies (Reeves,
Kuper, and Hodges, 2008). In our research, we are going to use questionnaire method to collect
the data of the number of people who use Bluetooth technology in Australia.
2.3.1 The design steps
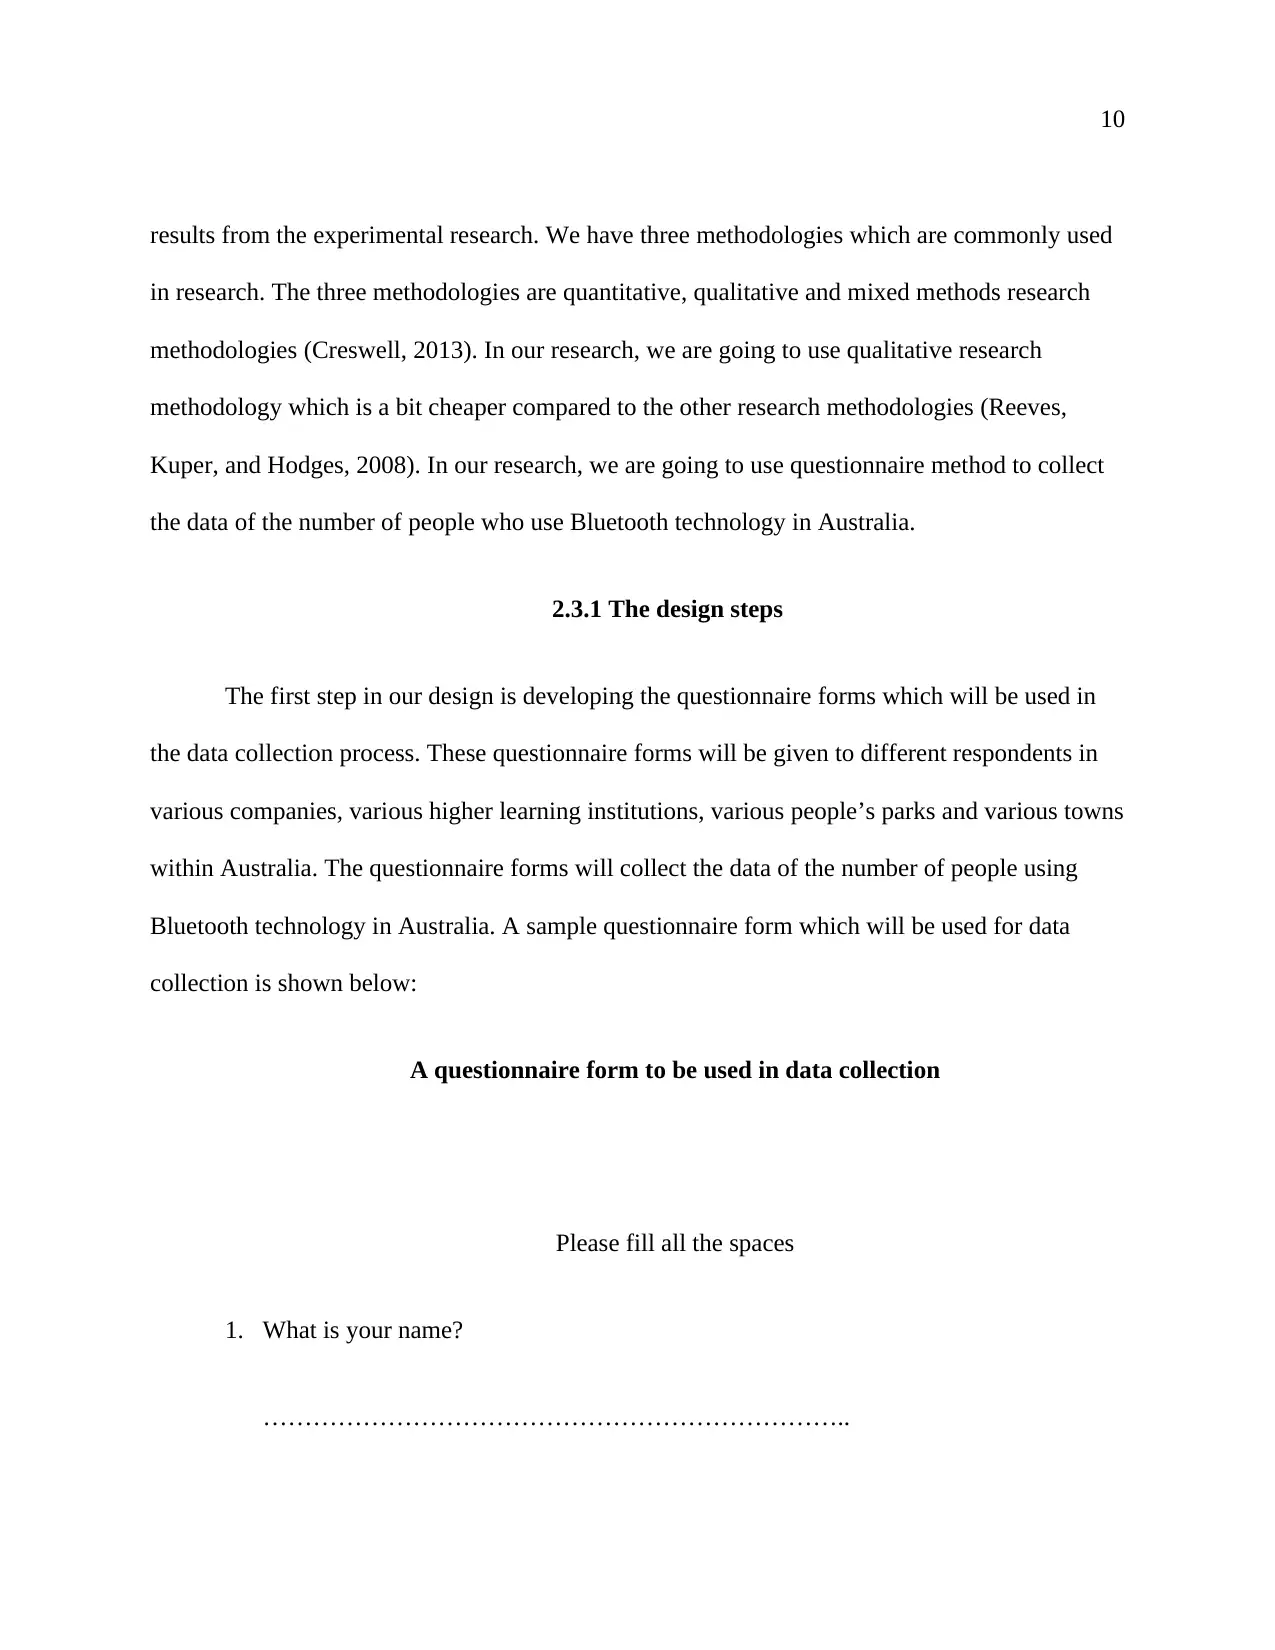
The first step in our design is developing the questionnaire forms which will be used in
the data collection process. These questionnaire forms will be given to different respondents in
various companies, various higher learning institutions, various people’s parks and various towns
within Australia. The questionnaire forms will collect the data of the number of people using
Bluetooth technology in Australia. A sample questionnaire form which will be used for data
collection is shown below:
A questionnaire form to be used in data collection
Please fill all the spaces
1. What is your name?
……………………………………………………………..
results from the experimental research. We have three methodologies which are commonly used
in research. The three methodologies are quantitative, qualitative and mixed methods research
methodologies (Creswell, 2013). In our research, we are going to use qualitative research
methodology which is a bit cheaper compared to the other research methodologies (Reeves,
Kuper, and Hodges, 2008). In our research, we are going to use questionnaire method to collect
the data of the number of people who use Bluetooth technology in Australia.
2.3.1 The design steps
The first step in our design is developing the questionnaire forms which will be used in
the data collection process. These questionnaire forms will be given to different respondents in
various companies, various higher learning institutions, various people’s parks and various towns
within Australia. The questionnaire forms will collect the data of the number of people using
Bluetooth technology in Australia. A sample questionnaire form which will be used for data
collection is shown below:
A questionnaire form to be used in data collection
Please fill all the spaces
1. What is your name?
……………………………………………………………..
Paraphrase This Document
Need a fresh take? Get an instant paraphrase of this document with our AI Paraphraser
11
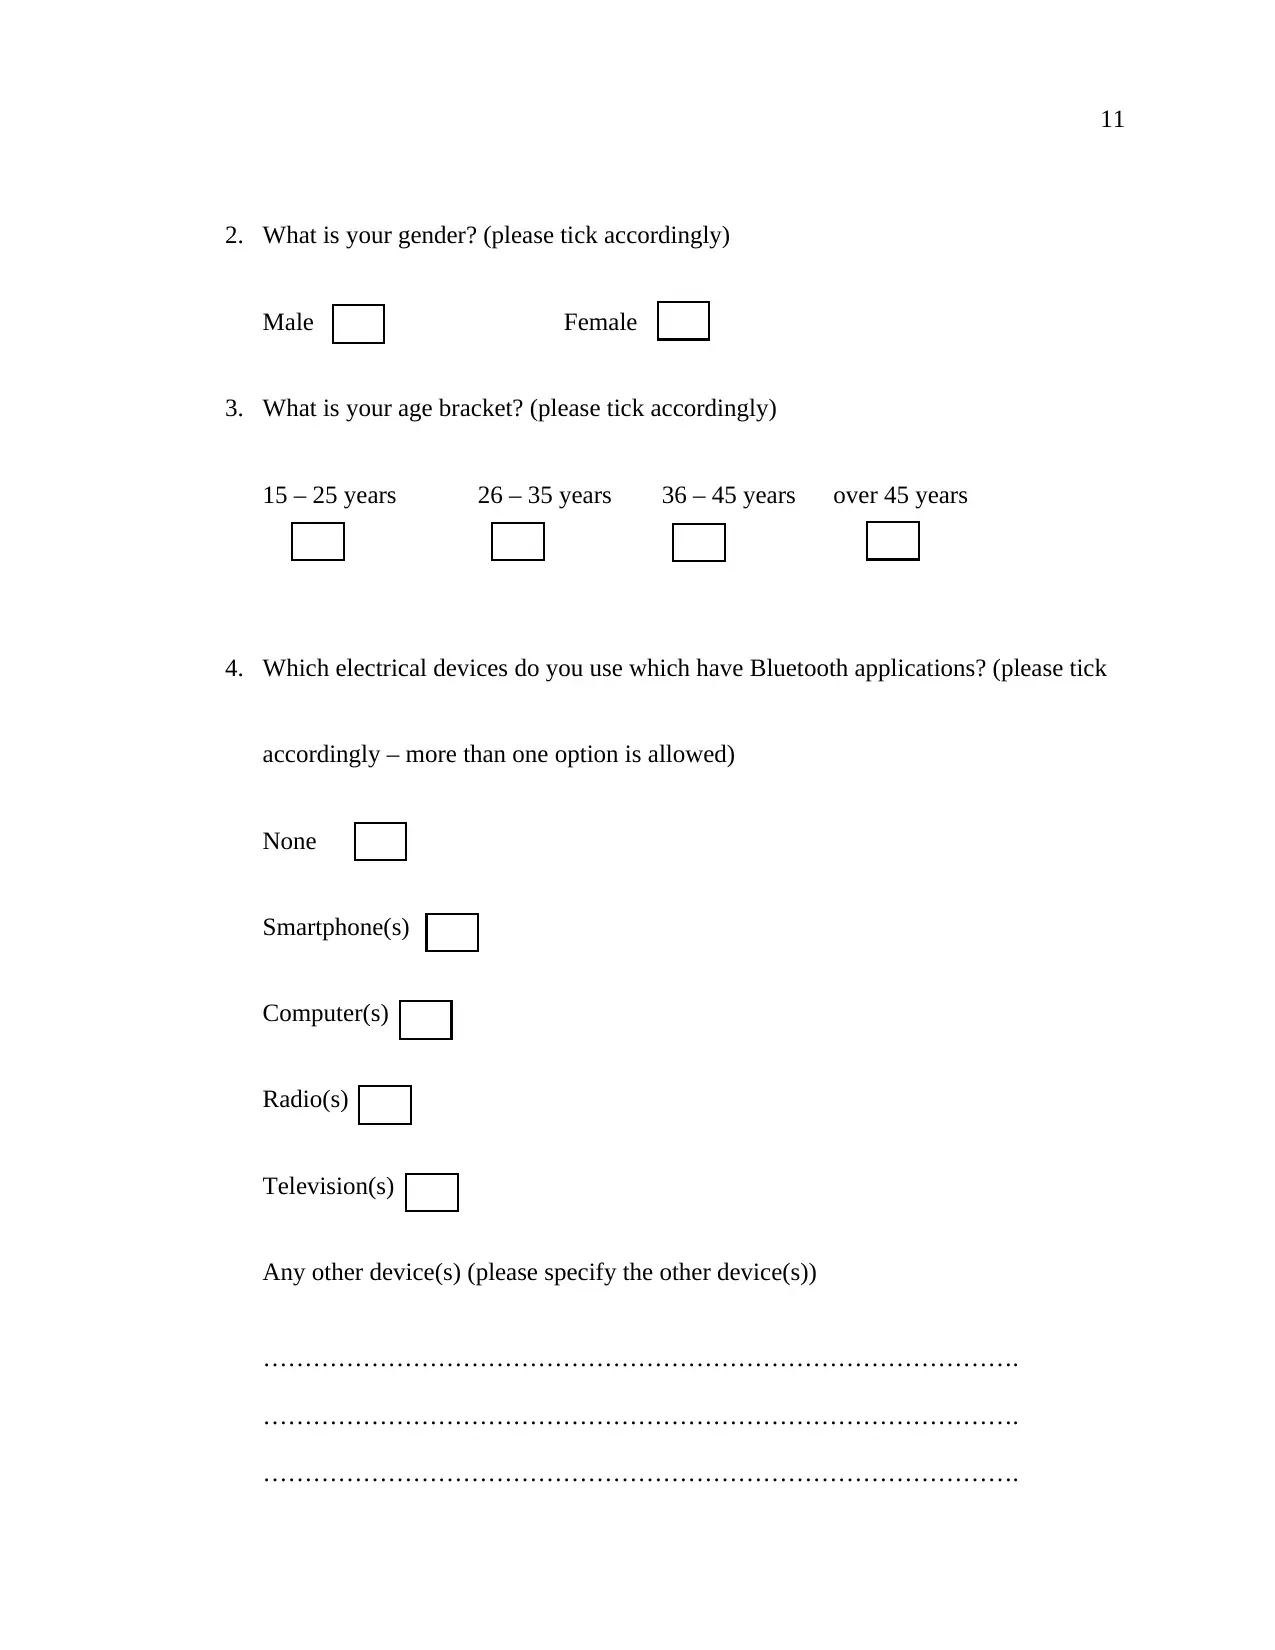
2. What is your gender? (please tick accordingly)
Male Female
3. What is your age bracket? (please tick accordingly)
15 – 25 years 26 – 35 years 36 – 45 years over 45 years
4. Which electrical devices do you use which have Bluetooth applications? (please tick
accordingly – more than one option is allowed)
None
Smartphone(s)
Computer(s)
Radio(s)
Television(s)
Any other device(s) (please specify the other device(s))
……………………………………………………………………………….
……………………………………………………………………………….
……………………………………………………………………………….
12
……………………………………………………………………………….
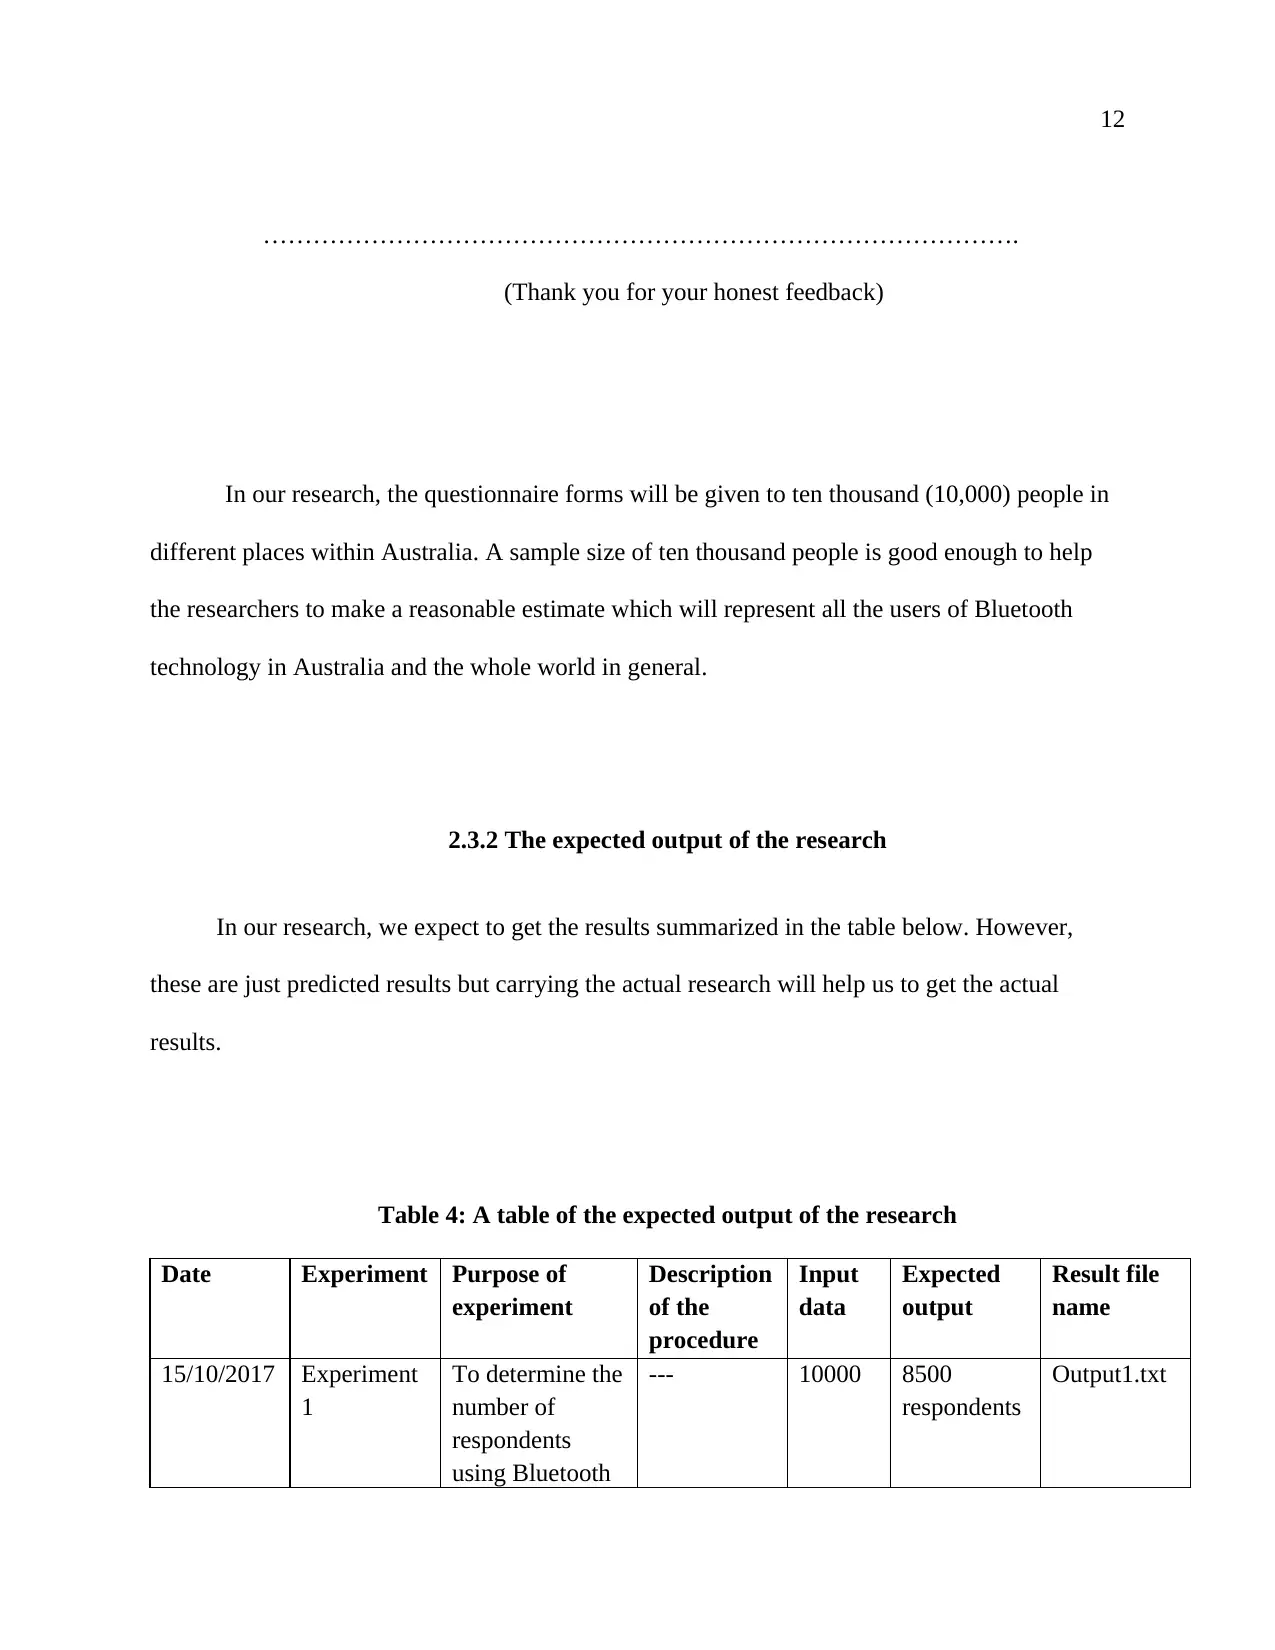
(Thank you for your honest feedback)
In our research, the questionnaire forms will be given to ten thousand (10,000) people in
different places within Australia. A sample size of ten thousand people is good enough to help
the researchers to make a reasonable estimate which will represent all the users of Bluetooth
technology in Australia and the whole world in general.
2.3.2 The expected output of the research
In our research, we expect to get the results summarized in the table below. However,
these are just predicted results but carrying the actual research will help us to get the actual
results.
Table 4: A table of the expected output of the research
Date Experiment Purpose of
experiment
Description
of the
procedure
Input
data
Expected
output
Result file
name
15/10/2017 Experiment
1
To determine the
number of
respondents
using Bluetooth
--- 10000 8500
respondents
Output1.txt
……………………………………………………………………………….
(Thank you for your honest feedback)
In our research, the questionnaire forms will be given to ten thousand (10,000) people in
different places within Australia. A sample size of ten thousand people is good enough to help
the researchers to make a reasonable estimate which will represent all the users of Bluetooth
technology in Australia and the whole world in general.
2.3.2 The expected output of the research
In our research, we expect to get the results summarized in the table below. However,
these are just predicted results but carrying the actual research will help us to get the actual
results.
Table 4: A table of the expected output of the research
Date Experiment Purpose of
experiment
Description
of the
procedure
Input
data
Expected
output
Result file
name
15/10/2017 Experiment
1
To determine the
number of
respondents
using Bluetooth
--- 10000 8500
respondents
Output1.txt
⊘ This is a preview!⊘
Do you want full access?
Subscribe today to unlock all pages.
Trusted by 1+ million students worldwide
1 out of 23
Related Documents


Your All-in-One AI-Powered Toolkit for Academic Success.
+13062052269
info@desklib.com
Available 24*7 on WhatsApp / Email
![[object Object]](/_next/static/media/star-bottom.7253800d.svg)
Unlock your academic potential
Copyright © 2020–2026 A2Z Services. All Rights Reserved. Developed and managed by ZUCOL.