Individual Project: Data Analysis Techniques and Forecasting Models
VerifiedAdded on 2023/01/11
|9
|1308
|57
Project
AI Summary
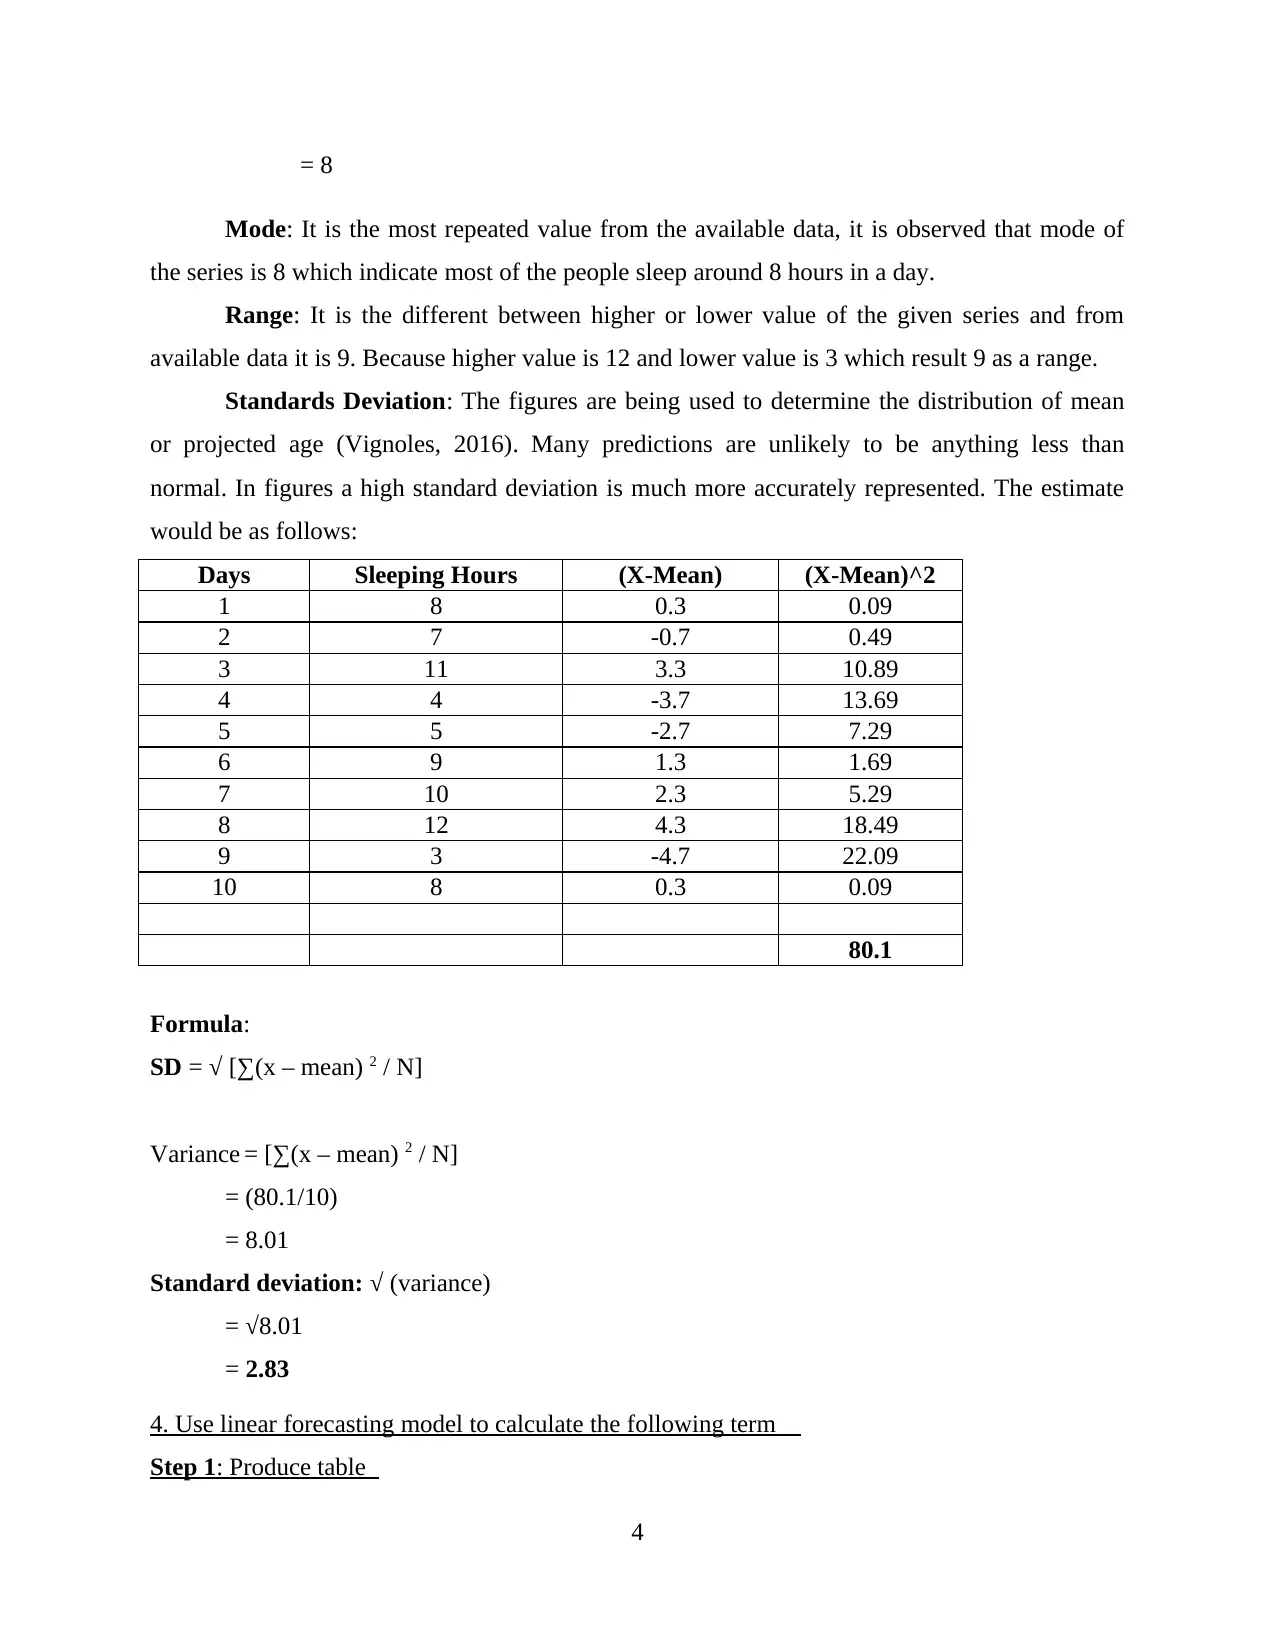
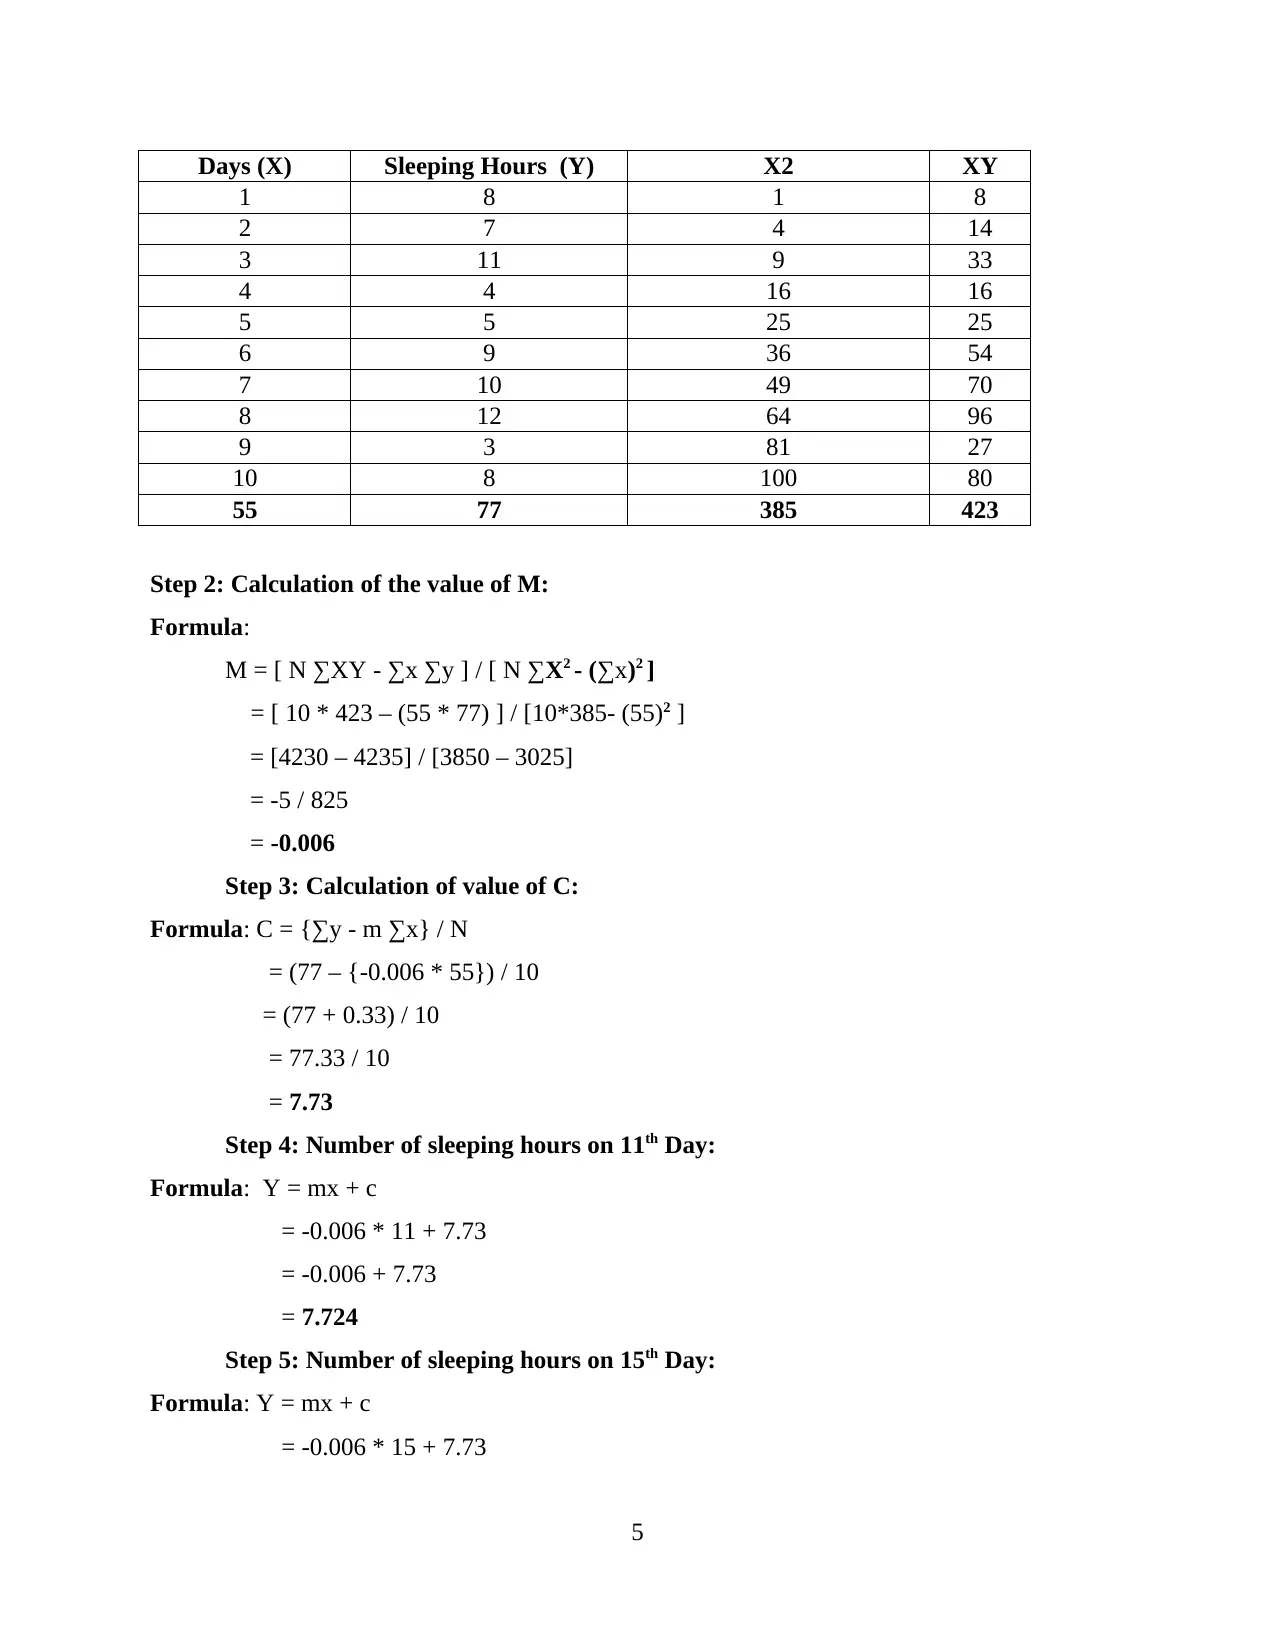
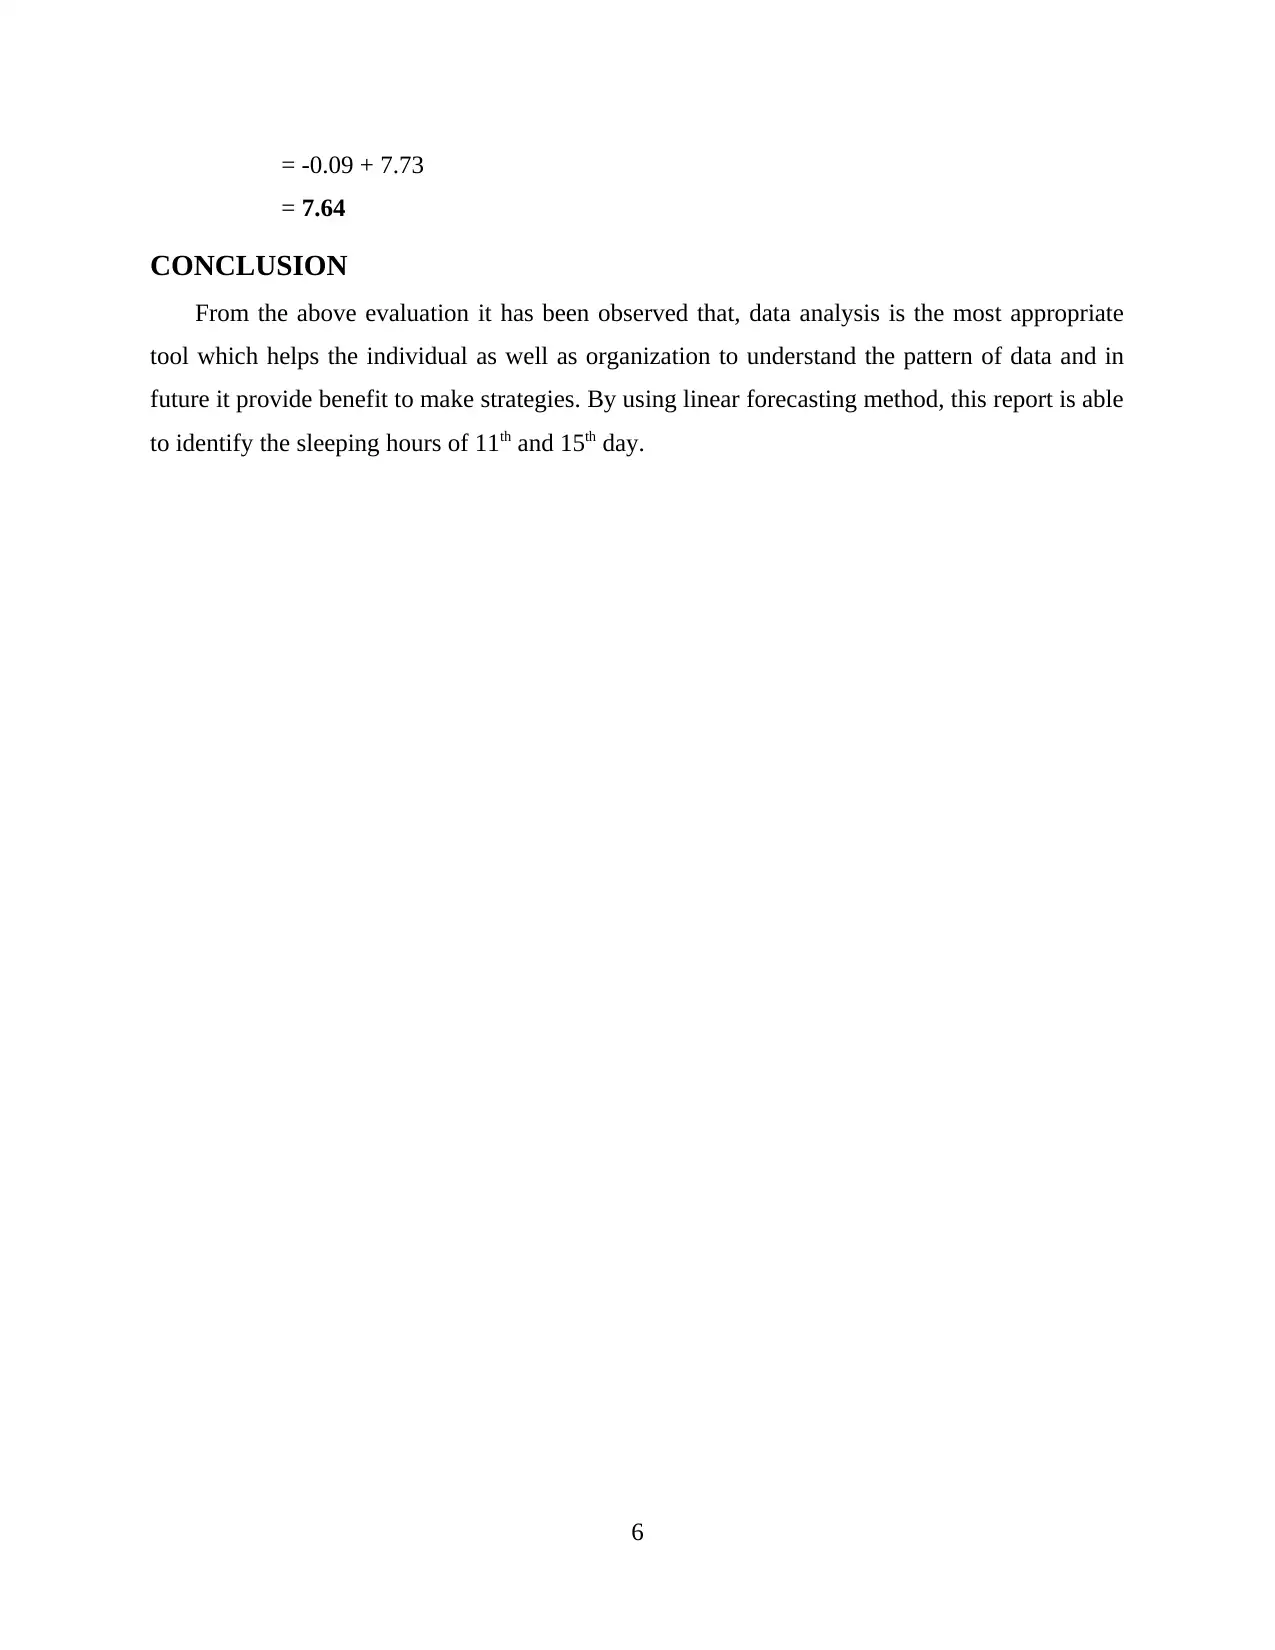
This individual project focuses on numeracy and data analysis, using sleep hours data collected over ten days. The assignment begins with arranging the data in a tabular format and representing it visually through column and bar charts. Key statistical terms like mean, median, mode, range, and standard deviation are calculated to analyze the data. Furthermore, a linear forecasting model is employed to predict the number of sleep hours for the 11th and 15th days. The project's conclusion highlights the importance of data analysis in understanding patterns and making informed decisions, emphasizing the usefulness of forecasting methods for future predictions. The project includes a detailed introduction, main body with calculations and charts, a conclusion, and a list of references.

INDIVIDUAL project Numeracy and data
Paraphrase This Document
Need a fresh take? Get an instant paraphrase of this document with our AI Paraphraser

INTRODUCTION...........................................................................................................................1
MAIN BODY..................................................................................................................................1
1. Arrange data in tabular format.................................................................................................1
2. Represent data by using two different types of charts.............................................................1
3. Calculate the following terms..................................................................................................3
4. Use linear forecasting model to calculate the following term.................................................4
CONCLUSION................................................................................................................................6
REFERENCES................................................................................................................................7

INTRODUCTION
The numeracy and data analysis is a way of gathering and analyzing data that allows us to
gain useful information (Coben And et.al., 2016). In other words, data method is typically aim to
investigate which data depends on explanation, whatever it attempts to tell everyone else. This
assessment is based on data collection, where it is related to the number of hours sleeping per
day. Around 10 consecutive days of data required for the further evaluation. in addition, it
include variety of measurements such as mean , mode , median, as well as predicting are also
done underneath the research project.
MAIN BODY
1. Arrange data in tabular format
Below mention table represent the data for regular 10 days sleeping hours of an individual.
Which the help of it, individual able to understand as well as arrange the data which further
simplify the work and it mentioned in the below table:
Days Sleeping Hours
1 8
2 7
3 11
4 4
5 5
6 9
7 10
8 12
9 3
10 8
2. Represent data by using two different types of charts
Column Chart: It is the graphical representation which shows the trend or the figures of
particular components which provide better understating of data (Gatobu, Arocha and Hoffman-
Goetz, 2016).
1
⊘ This is a preview!⊘
Do you want full access?
Subscribe today to unlock all pages.

Trusted by 1+ million students worldwide

Above mention coulmn chart helps in represnting the sleepimg hours in a day. With the
help of it, it is observed that on 8th day people sleep around 8 and its next day they sleep around 3
hours in a day. It helps in provding better sleeping pattern which evaluated by the others.
Bar Chart: It also one of the type of graphical representation which is used to show the
data in this format. Sleeping hours of an individual for 10 consecutive days are mentioned below:
This bar graph shows the sleeping pattern of an individual which provide better
understanduing and helps in making future decsions on the basis of it.
2
Paraphrase This Document
Need a fresh take? Get an instant paraphrase of this document with our AI Paraphraser

3. Calculate the following terms
Days Sleeping Hours
1 8
2 7
3 11
4 4
5 5
6 9
7 10
8 12
9 3
10 8
Mean 7.7
Median 8
Mode 8
Maximum 12
Minimum 3
Range 9
Mean: Its most popular phrase for an average is a statistical sample of a single unique
variable which would be the average number of the observation (Shalley and Stewart, 2017). To
evaluate this, add and break down the significances of all terms in a variety of ways. The average
value of the sleeping hours for 10 days is mentioned below:
Formula:
Mean = ∑ X / N
= 77/ 10
= 7.7
Medium: In the series of sample, since there is no amount and no aspect in the array, the
"median" is the observer's middle value. This is determined using the following formulation:
When data set is odd= (N+1)/2th item.
When data set is even= {N/2th item+ N/2th item + 1} 2
Total observation is N= 10
M= (10/2th item + 10/2th item + 1)/2
= (5th item+ 6th item)/2
= 5.5th item
3

= 8
Mode: It is the most repeated value from the available data, it is observed that mode of
the series is 8 which indicate most of the people sleep around 8 hours in a day.
Range: It is the different between higher or lower value of the given series and from
available data it is 9. Because higher value is 12 and lower value is 3 which result 9 as a range.
Standards Deviation: The figures are being used to determine the distribution of mean
or projected age (Vignoles, 2016). Many predictions are unlikely to be anything less than
normal. In figures a high standard deviation is much more accurately represented. The estimate
would be as follows:
Days Sleeping Hours (X-Mean) (X-Mean)^2
1 8 0.3 0.09
2 7 -0.7 0.49
3 11 3.3 10.89
4 4 -3.7 13.69
5 5 -2.7 7.29
6 9 1.3 1.69
7 10 2.3 5.29
8 12 4.3 18.49
9 3 -4.7 22.09
10 8 0.3 0.09
80.1
Formula:
SD = √ [∑(x – mean) 2 / N]
Variance = [∑(x – mean) 2 / N]
= (80.1/10)
= 8.01
Standard deviation: √ (variance)
= √8.01
= 2.83
4. Use linear forecasting model to calculate the following term
Step 1: Produce table
4
⊘ This is a preview!⊘
Do you want full access?
Subscribe today to unlock all pages.

Trusted by 1+ million students worldwide

Days (X) Sleeping Hours (Y) X2 XY
1 8 1 8
2 7 4 14
3 11 9 33
4 4 16 16
5 5 25 25
6 9 36 54
7 10 49 70
8 12 64 96
9 3 81 27
10 8 100 80
55 77 385 423
Step 2: Calculation of the value of M:
Formula:
M = [ N ∑XY - ∑x ∑y ] / [ N ∑X2 - (∑x)2 ]
= [ 10 * 423 – (55 * 77) ] / [10*385- (55)2 ]
= [4230 – 4235] / [3850 – 3025]
= -5 / 825
= -0.006
Step 3: Calculation of value of C:
Formula: C = {∑y - m ∑x} / N
= (77 – {-0.006 * 55}) / 10
= (77 + 0.33) / 10
= 77.33 / 10
= 7.73
Step 4: Number of sleeping hours on 11th Day:
Formula: Y = mx + c
= -0.006 * 11 + 7.73
= -0.006 + 7.73
= 7.724
Step 5: Number of sleeping hours on 15th Day:
Formula: Y = mx + c
= -0.006 * 15 + 7.73
5
Paraphrase This Document
Need a fresh take? Get an instant paraphrase of this document with our AI Paraphraser

= -0.09 + 7.73
= 7.64
CONCLUSION
From the above evaluation it has been observed that, data analysis is the most appropriate
tool which helps the individual as well as organization to understand the pattern of data and in
future it provide benefit to make strategies. By using linear forecasting method, this report is able
to identify the sleeping hours of 11th and 15th day.
6

REFERENCES
Books & Journals
Coben, D. And et.al., 2016. Making the most of PIAAC: Preliminary investigation of adults’
numeracy practices through secondary analysis of the PIAAC dataset.
Gatobu, S. K., Arocha, J. F. and Hoffman-Goetz, L., 2016. Numeracy, health numeracy, and
older immigrants’ primary language: an observation-oriented exploration. Basic and
Applied Social Psychology. 38(4). pp.185-199.
Shalley, F. and Stewart, A., 2017. Aboriginal adult English language literacy and numeracy in
the Northern Territory: A statistical overview. Charles Darwin University.
Vignoles, A., 2016. What is the economic value of literacy and numeracy?. IZA World of Labor.
7
⊘ This is a preview!⊘
Do you want full access?
Subscribe today to unlock all pages.

Trusted by 1+ million students worldwide
1 out of 9
Related Documents

Your All-in-One AI-Powered Toolkit for Academic Success.
+13062052269
info@desklib.com
Available 24*7 on WhatsApp / Email
Unlock your academic potential
Copyright © 2020–2025 A2Z Services. All Rights Reserved. Developed and managed by ZUCOL.