Data Analysis and Forecasting: Edinburgh Humidity, December 2019

Verified

Added on  2023/01/17

|13
|1522
|87
Report
AI Summary
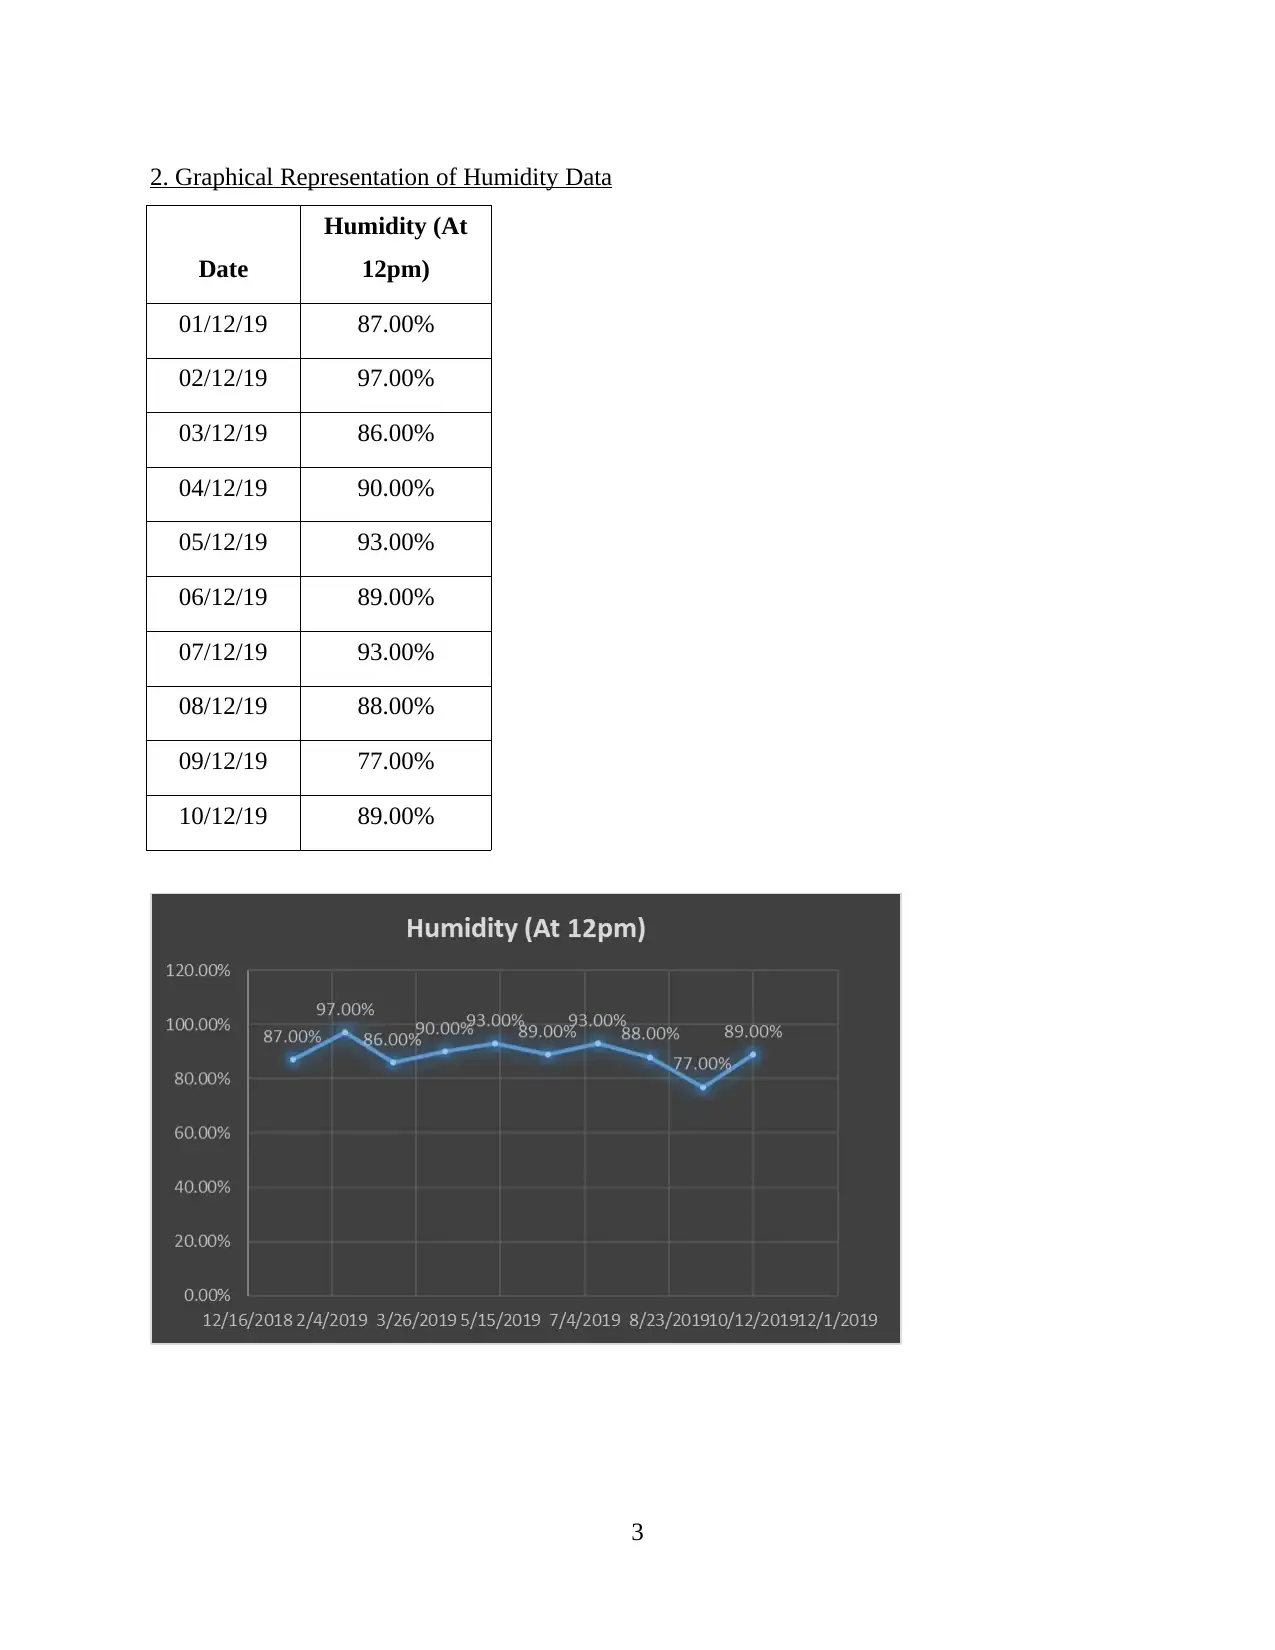
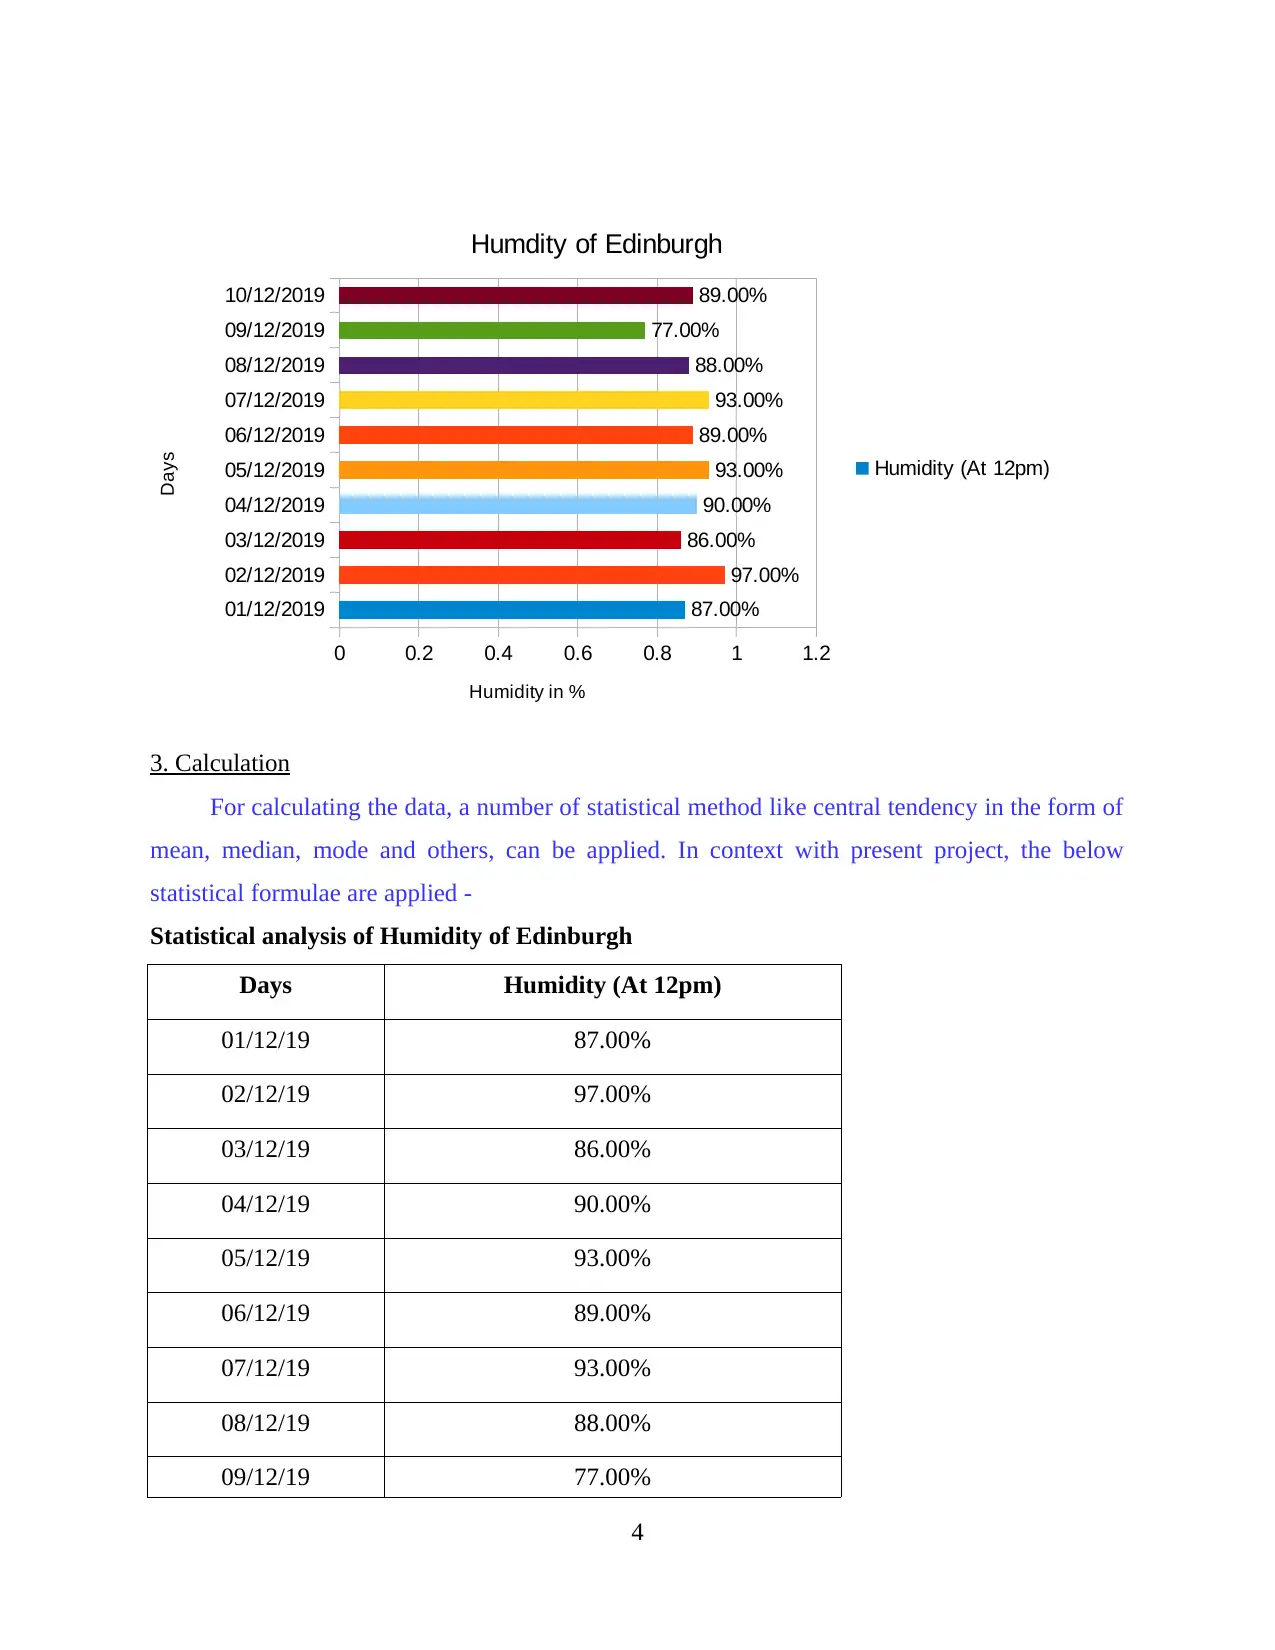
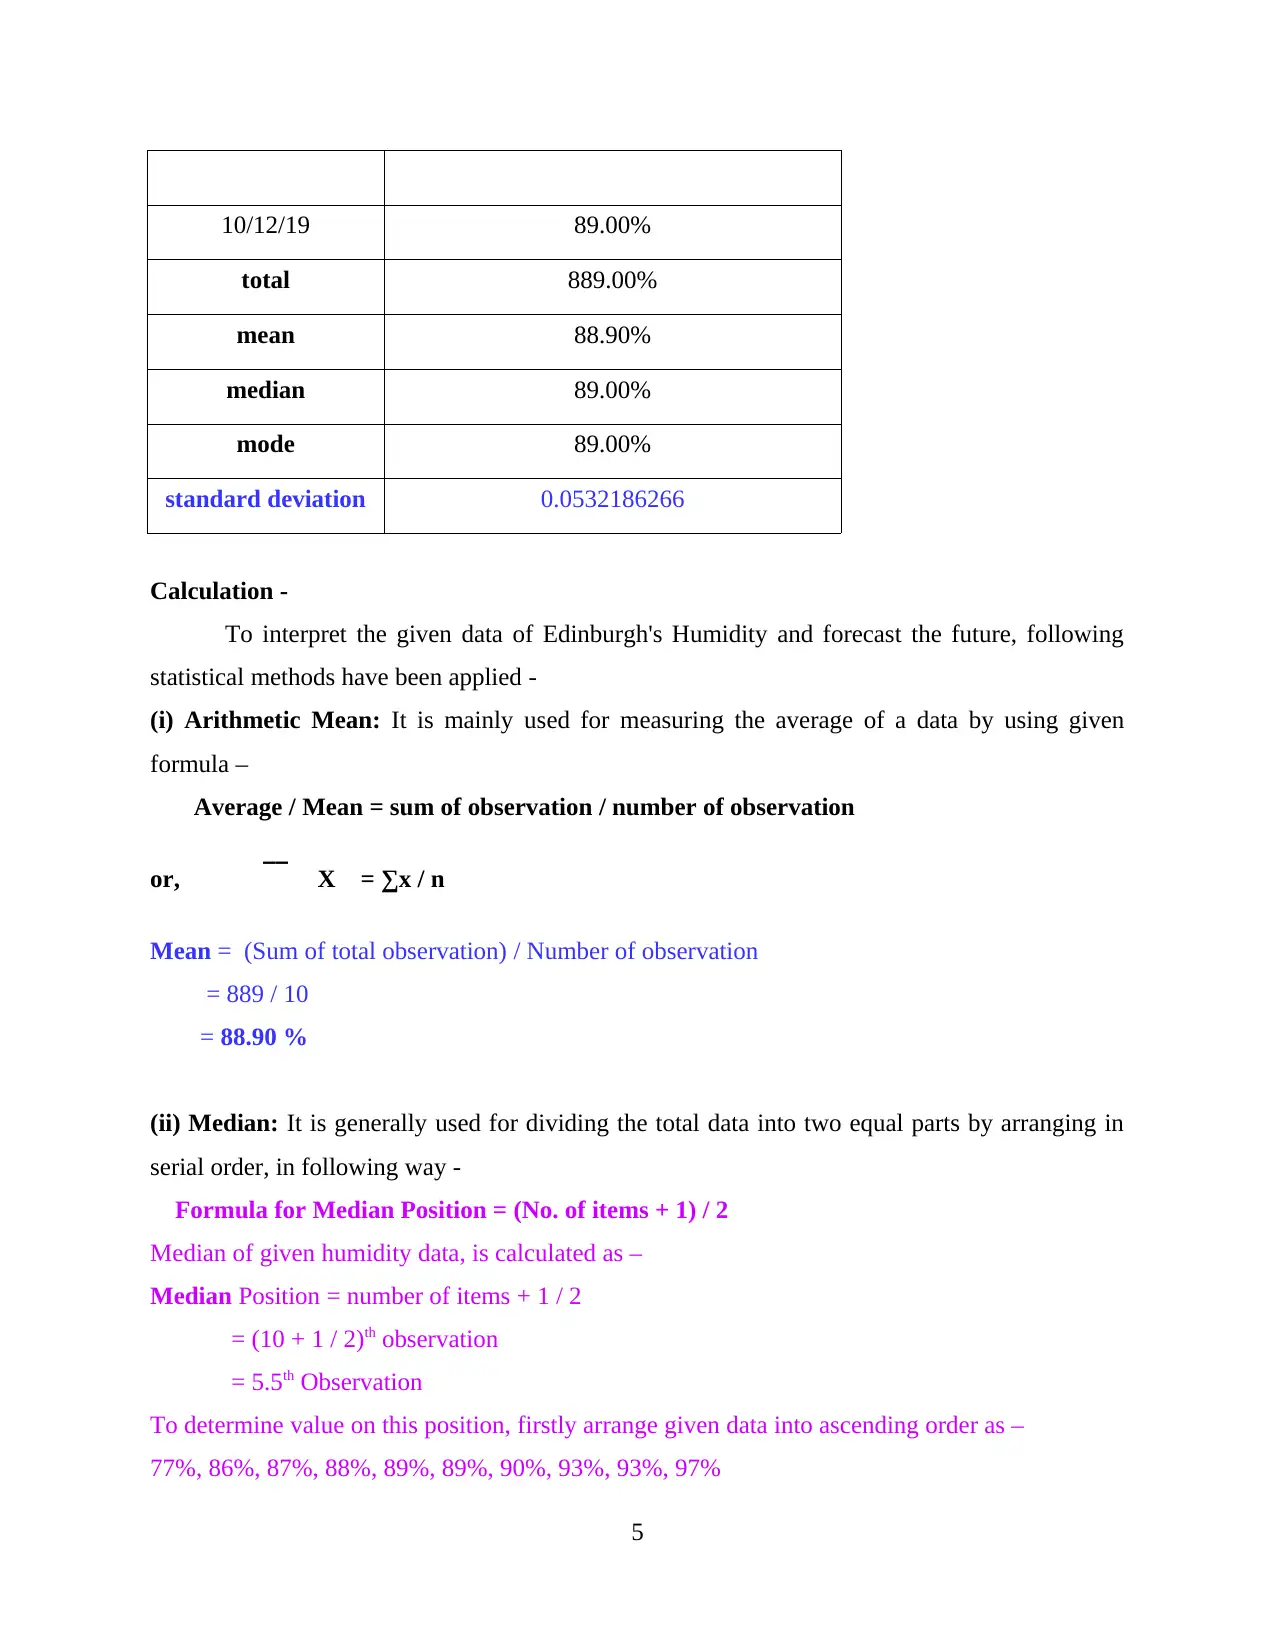
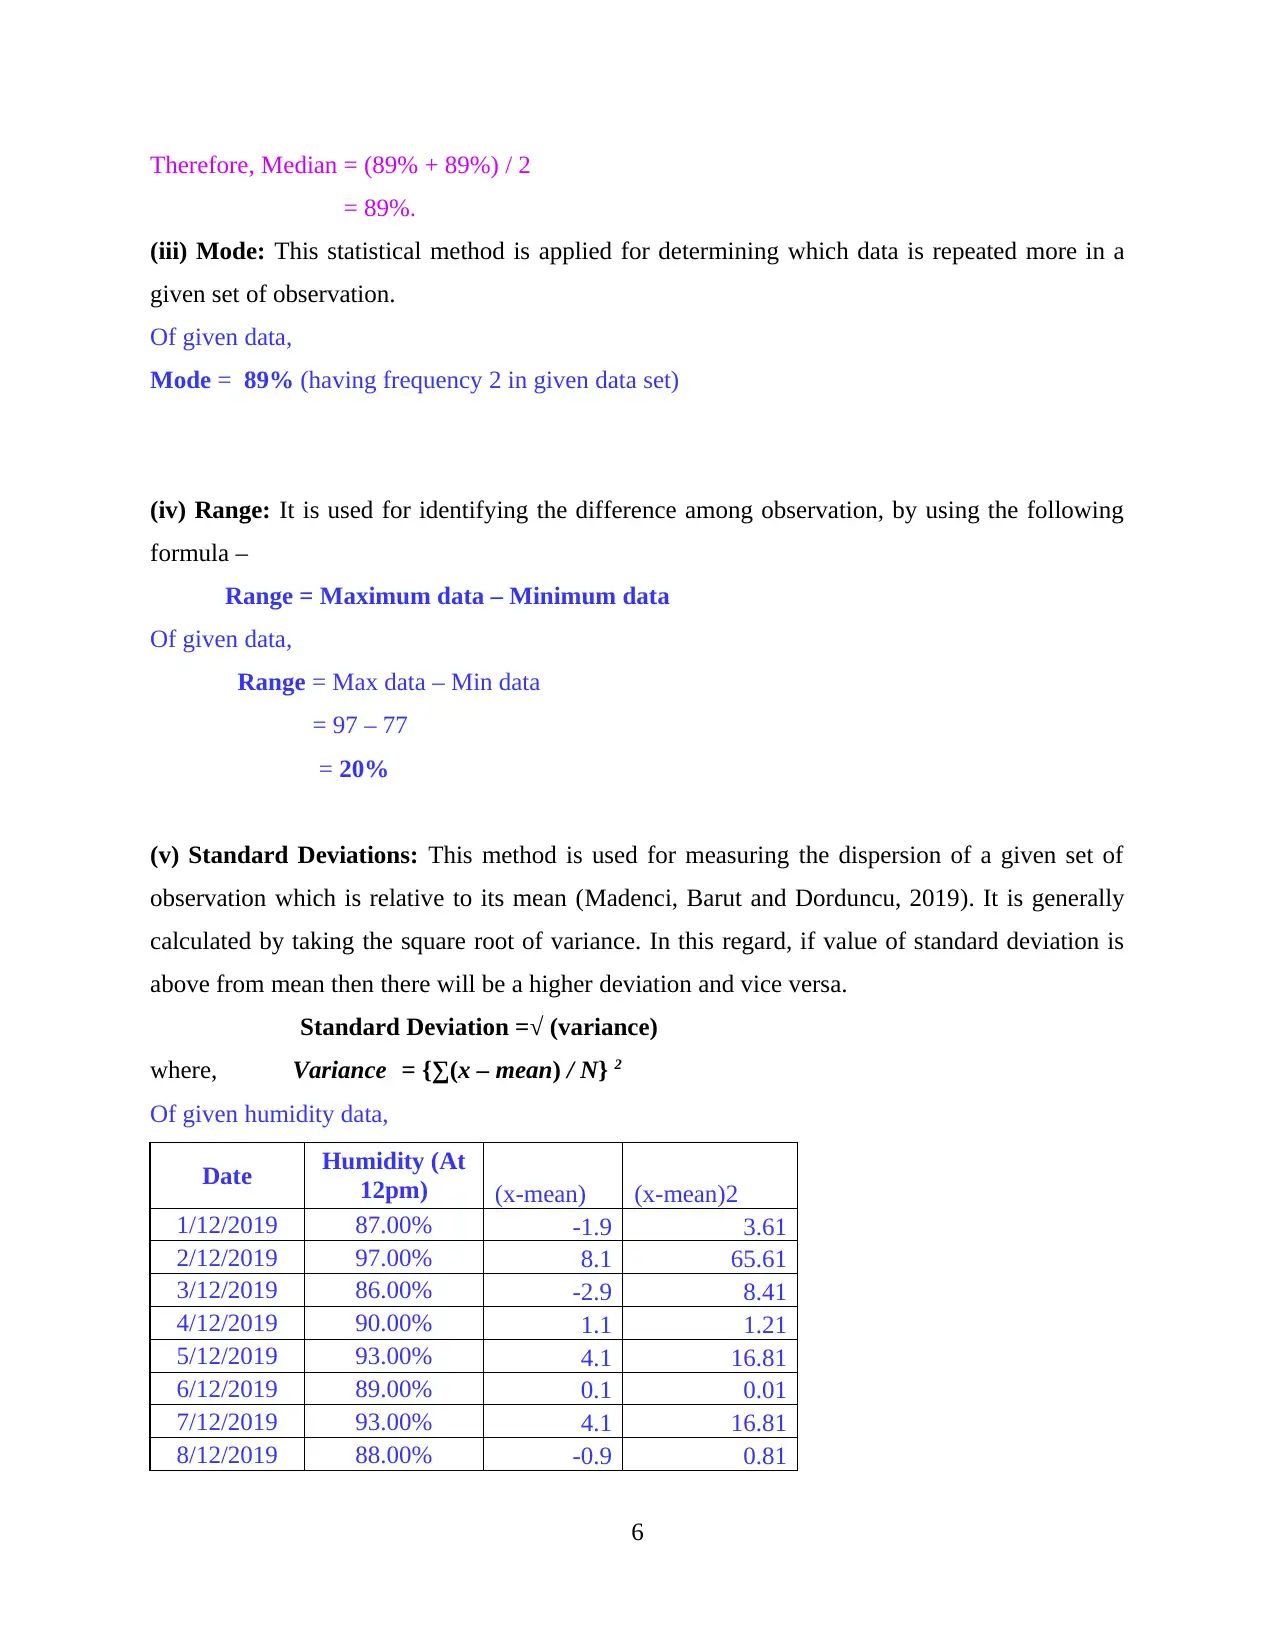
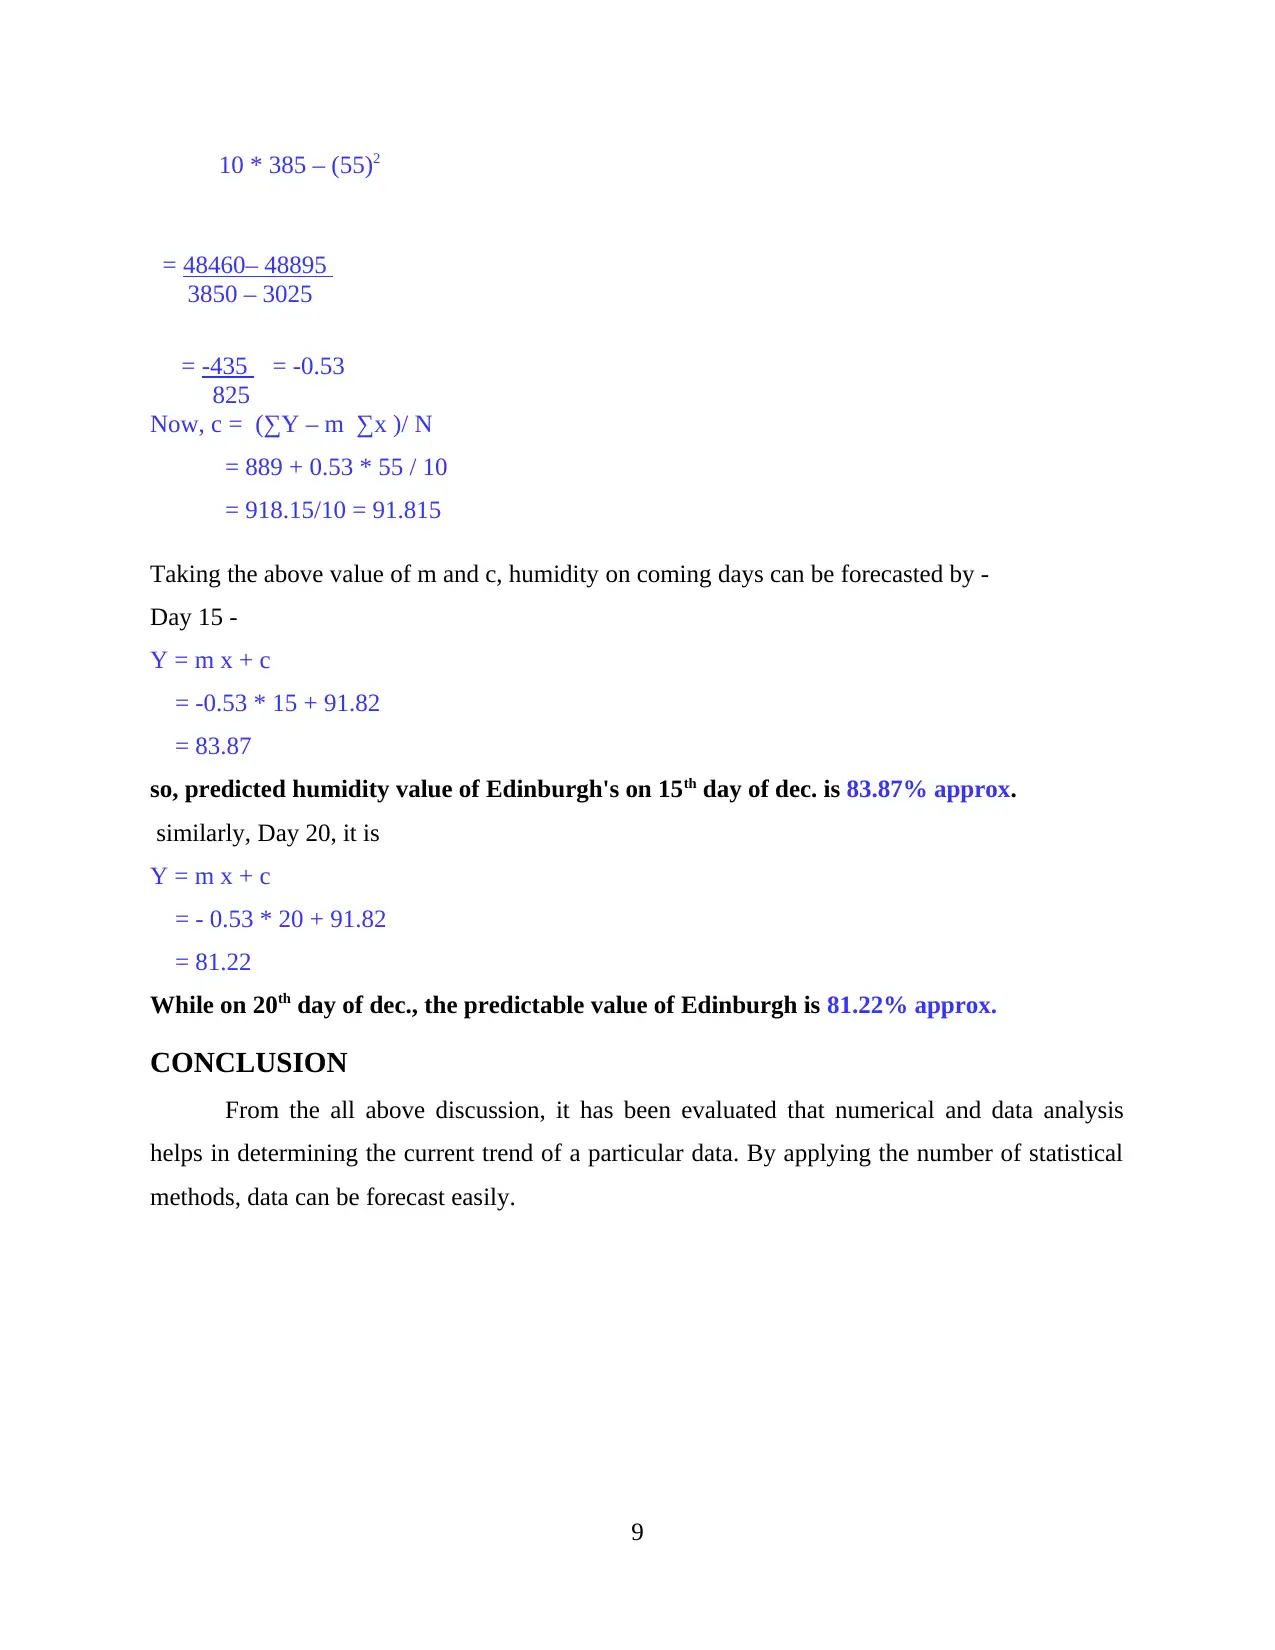
This report presents a data analysis and forecasting study of Edinburgh's humidity levels during the first ten days of December 2019. The analysis begins with a table and graphical representation of the humidity data, followed by detailed calculations using various statistical methods. These methods include the arithmetic mean, median, mode, range, and standard deviation, providing a comprehensive understanding of the data's central tendencies and dispersion. Furthermore, the report employs a linear forecasting model to predict the humidity levels for the 15th and 20th days of December. The methodology involves determining the slope and constant of the linear equation to forecast future values. The report concludes with the predicted humidity percentages for the specified dates, offering insights into potential weather patterns. References include relevant academic sources and weather data websites.
tabler-icon-diamond-filled.svg

Contribute Materials

Your contribution can guide someone’s learning journey. Share your documents today.
Document Page
Data Analysis and Forecasting
tabler-icon-diamond-filled.svg

Secure Best Marks with AI Grader

Need help grading? Try our AI Grader for instant feedback on your assignments.
Document Page
Table of Contents
INTRODUCTION...........................................................................................................................1
Main Body.......................................................................................................................................1
1. Table Representation...............................................................................................................1
2. Graphical Representation of Humidity Data...........................................................................2
3. Calculation..............................................................................................................................3
4. Liner-forecasting model..........................................................................................................6
CONCLUSION................................................................................................................................7
REFERENCES................................................................................................................................8
.........................................................................................................................................................8
Document Page
Document Page
INTRODUCTION
Analysis refers to a technique of applying the well-established statistical and
mathematical techniques to a particular data, for determining the specified patterns (Lamessa,
2019). Data analysis is mainly used for predicting future whether report of a place, by making
hypothesis on given data. To forecast the humidity of upcoming days on the basis of previous
report, a statistical report is going to be prepared under present assignment. For this purpose,
humidity data of consecutive days of Edinburgh i.e. from 1st Dec to 10th Dec. 2019, is taken.
Furthermore, to predict data of 15th and 20th day of same month, a number of statistical tools will
be applied, such as mean, mode, median, range and standard deviations, including linear
forecasting model also.
Main Body
In order to interpret the data for next 15th and 20th day of December, previous data has
been taken from first ten days of same month of Edinburgh (December 2019 Weather in
Edinburgh — Graph. 2019). This data is represented below -
1. Table Representation
Humidity's Report of Edinburgh from ten consecutive days of December 2019 are given as
beneath -
Date
Humidity (At
12pm)
01/12/19 87.00%
02/12/19 97.00%
03/12/19 86.00%
04/12/19 90.00%
05/12/19 93.00%
06/12/19 89.00%
07/12/19 93.00%
08/12/19 88.00%
1
tabler-icon-diamond-filled.svg

Secure Best Marks with AI Grader

Need help grading? Try our AI Grader for instant feedback on your assignments.
Document Page
09/12/19 77.00%
10/12/19 89.00%
2
Document Page
2. Graphical Representation of Humidity Data
Date
Humidity (At
12pm)
01/12/19 87.00%
02/12/19 97.00%
03/12/19 86.00%
04/12/19 90.00%
05/12/19 93.00%
06/12/19 89.00%
07/12/19 93.00%
08/12/19 88.00%
09/12/19 77.00%
10/12/19 89.00%
3
Document Page
3. Calculation
For calculating the data, a number of statistical method like central tendency in the form of
mean, median, mode and others, can be applied. In context with present project, the below
statistical formulae are applied -
Statistical analysis of Humidity of Edinburgh
Days Humidity (At 12pm)
01/12/19 87.00%
02/12/19 97.00%
03/12/19 86.00%
04/12/19 90.00%
05/12/19 93.00%
06/12/19 89.00%
07/12/19 93.00%
08/12/19 88.00%
09/12/19 77.00%
4
01/12/2019
02/12/2019
03/12/2019
04/12/2019
05/12/2019
06/12/2019
07/12/2019
08/12/2019
09/12/2019
10/12/2019
0 0.2 0.4 0.6 0.8 1 1.2
87.00%
97.00%
86.00%
90.00%
93.00%
89.00%
93.00%
88.00%
77.00%
89.00%
Humdity of Edinburgh
Humidity (At 12pm)
Humidity in %
Days
tabler-icon-diamond-filled.svg

Paraphrase This Document

Need a fresh take? Get an instant paraphrase of this document with our AI Paraphraser
Document Page
10/12/19 89.00%
total 889.00%
mean 88.90%
median 89.00%
mode 89.00%
standard deviation 0.0532186266
Calculation -
To interpret the given data of Edinburgh's Humidity and forecast the future, following
statistical methods have been applied -
(i) Arithmetic Mean: It is mainly used for measuring the average of a data by using given
formula –
Average / Mean = sum of observation / number of observation
__
or, X = ∑x / n
Mean = (Sum of total observation) / Number of observation
= 889 / 10
= 88.90 %
(ii) Median: It is generally used for dividing the total data into two equal parts by arranging in
serial order, in following way -
Formula for Median Position = (No. of items + 1) / 2
Median of given humidity data, is calculated as –
Median Position = number of items + 1 / 2
= (10 + 1 / 2)th observation
= 5.5th Observation
To determine value on this position, firstly arrange given data into ascending order as –
77%, 86%, 87%, 88%, 89%, 89%, 90%, 93%, 93%, 97%
5
Document Page
Therefore, Median = (89% + 89%) / 2
= 89%.
(iii) Mode: This statistical method is applied for determining which data is repeated more in a
given set of observation.
Of given data,
Mode = 89% (having frequency 2 in given data set)
(iv) Range: It is used for identifying the difference among observation, by using the following
formula –
Range = Maximum data – Minimum data
Of given data,
Range = Max data – Min data
= 97 – 77
= 20%
(v) Standard Deviations: This method is used for measuring the dispersion of a given set of
observation which is relative to its mean (Madenci, Barut and Dorduncu, 2019). It is generally
calculated by taking the square root of variance. In this regard, if value of standard deviation is
above from mean then there will be a higher deviation and vice versa.
Standard Deviation = (variance)
where, Variance = {(x – mean) / N} 2
Of given humidity data,
Date Humidity (At
12pm) (x-mean) (x-mean)2
1/12/2019 87.00% -1.9 3.61
2/12/2019 97.00% 8.1 65.61
3/12/2019 86.00% -2.9 8.41
4/12/2019 90.00% 1.1 1.21
5/12/2019 93.00% 4.1 16.81
6/12/2019 89.00% 0.1 0.01
7/12/2019 93.00% 4.1 16.81
8/12/2019 88.00% -0.9 0.81
6
Document Page
9/12/2019 77.00% -11.9 141.61
10/12/2019 89.00% 0.1 0.01
Mean 88.90% 254.90
Variance = ∑(x – mean)2 / N
= 254.90/10 = 25.49
Std Dev. = variance
= 25.49
= 5.04%
7
tabler-icon-diamond-filled.svg

Secure Best Marks with AI Grader

Need help grading? Try our AI Grader for instant feedback on your assignments.
Document Page
4. Liner-forecasting model
For estimating the humidity value of Edinburgh within next days of December month of
linear forecasting model has been used. This model is applied on the data, which is given against
particular time, to determine the actual pattern of time series analysis. It would help in predicting
the future data in more accurate manner. For this purpose, below formula can be used -
y = m x + c
where, m refers to the slope of a line and c is the constant –
m = Change in Y / Change in X
In this regard, value of m and c can be determined by using following table –
Days (X)
Humidity (At
12pm) (Y) X2 ∑XY
1 87.00% 1 87
2 97.00% 4 194
3 86.00% 9 258
4 90.00% 16 360
5 93.00% 25 465
6 89.00% 36 534
7 93.00% 49 651
8 88.00% 64 704
9 77.00% 81 703
10 89.00% 100 890
Total = 55 889.00% ∑X2 = 385 ∑XY =4846
1. Value of m through above table can be calculated in following way -
m = N * ∑XY - ∑X * ∑Y
N * ∑X2 - (∑X)2
= 10 * 4846 – 55 * 889
8
Document Page
10 * 385 – (55)2
= 48460– 48895
3850 – 3025
= -435 = -0.53
825
Now, c = (∑Y – m ∑x )/ N
= 889 + 0.53 * 55 / 10
= 918.15/10 = 91.815
Taking the above value of m and c, humidity on coming days can be forecasted by -
Day 15 -
Y = m x + c
= -0.53 * 15 + 91.82
= 83.87
so, predicted humidity value of Edinburgh's on 15th day of dec. is 83.87% approx.
similarly, Day 20, it is
Y = m x + c
= - 0.53 * 20 + 91.82
= 81.22
While on 20th day of dec., the predictable value of Edinburgh is 81.22% approx.
CONCLUSION
From the all above discussion, it has been evaluated that numerical and data analysis
helps in determining the current trend of a particular data. By applying the number of statistical
methods, data can be forecast easily.
9
Document Page
REFERENCES
Lamessa, T., 2019. Computational Data analysis of Fourıer Transformatıon by Numerical
experiments (Numerical CODE). International Journal For Research In Mathematics
And Statistics (ISSN: 2208-2662). 5(5). pp.01-13.
Madenci, E., Barut, A. and Dorduncu, M., 2019. Peridynamic differential operator for numerical
analysis. Springer International Publishing.
Wang, Y. and et. al., 2019. Test of a Weather-Adaptive Dual-Resolution Hybrid Warn-on-
Forecast Analysis and Forecast System for Several Severe Weather Events. Weather and
Forecasting. 34(6). pp.1807-1827.
December 2019 Weather in Edinburgh Graph. 2019. [Online] Available Through:
<https://www.timeanddate.com/weather/uk/edinburgh/historic?month=12&year=2019>.
[ Accessed on 3/01/2020]
10
chevron_up_icon
1 out of 13
circle_padding
hide_on_mobile
zoom_out_icon
logo.png

Your All-in-One AI-Powered Toolkit for Academic Success.

Available 24*7 on WhatsApp / Email

[object Object]