BABS Foundation: Data Analysis and Forecasting Report, September 2020
VerifiedAdded on 2023/01/06
|10
|1588
|83
Report
AI Summary
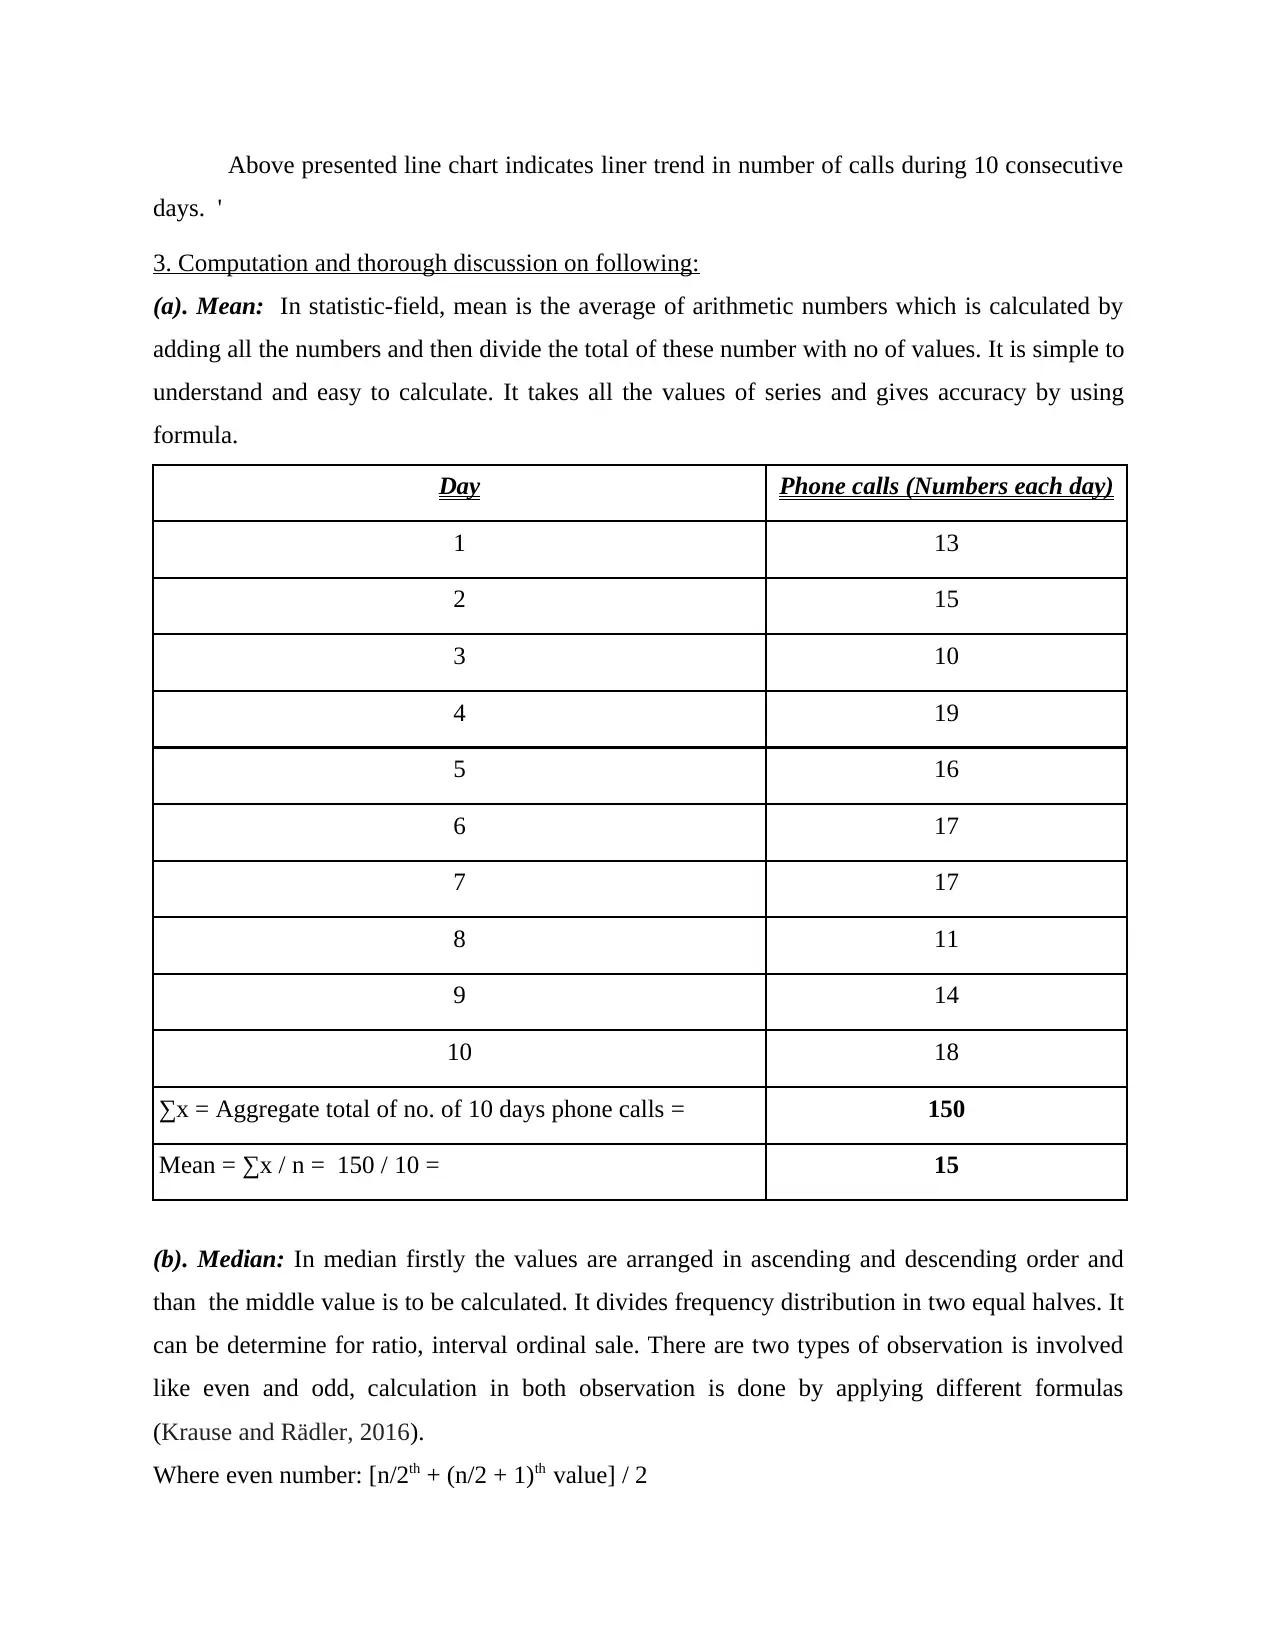
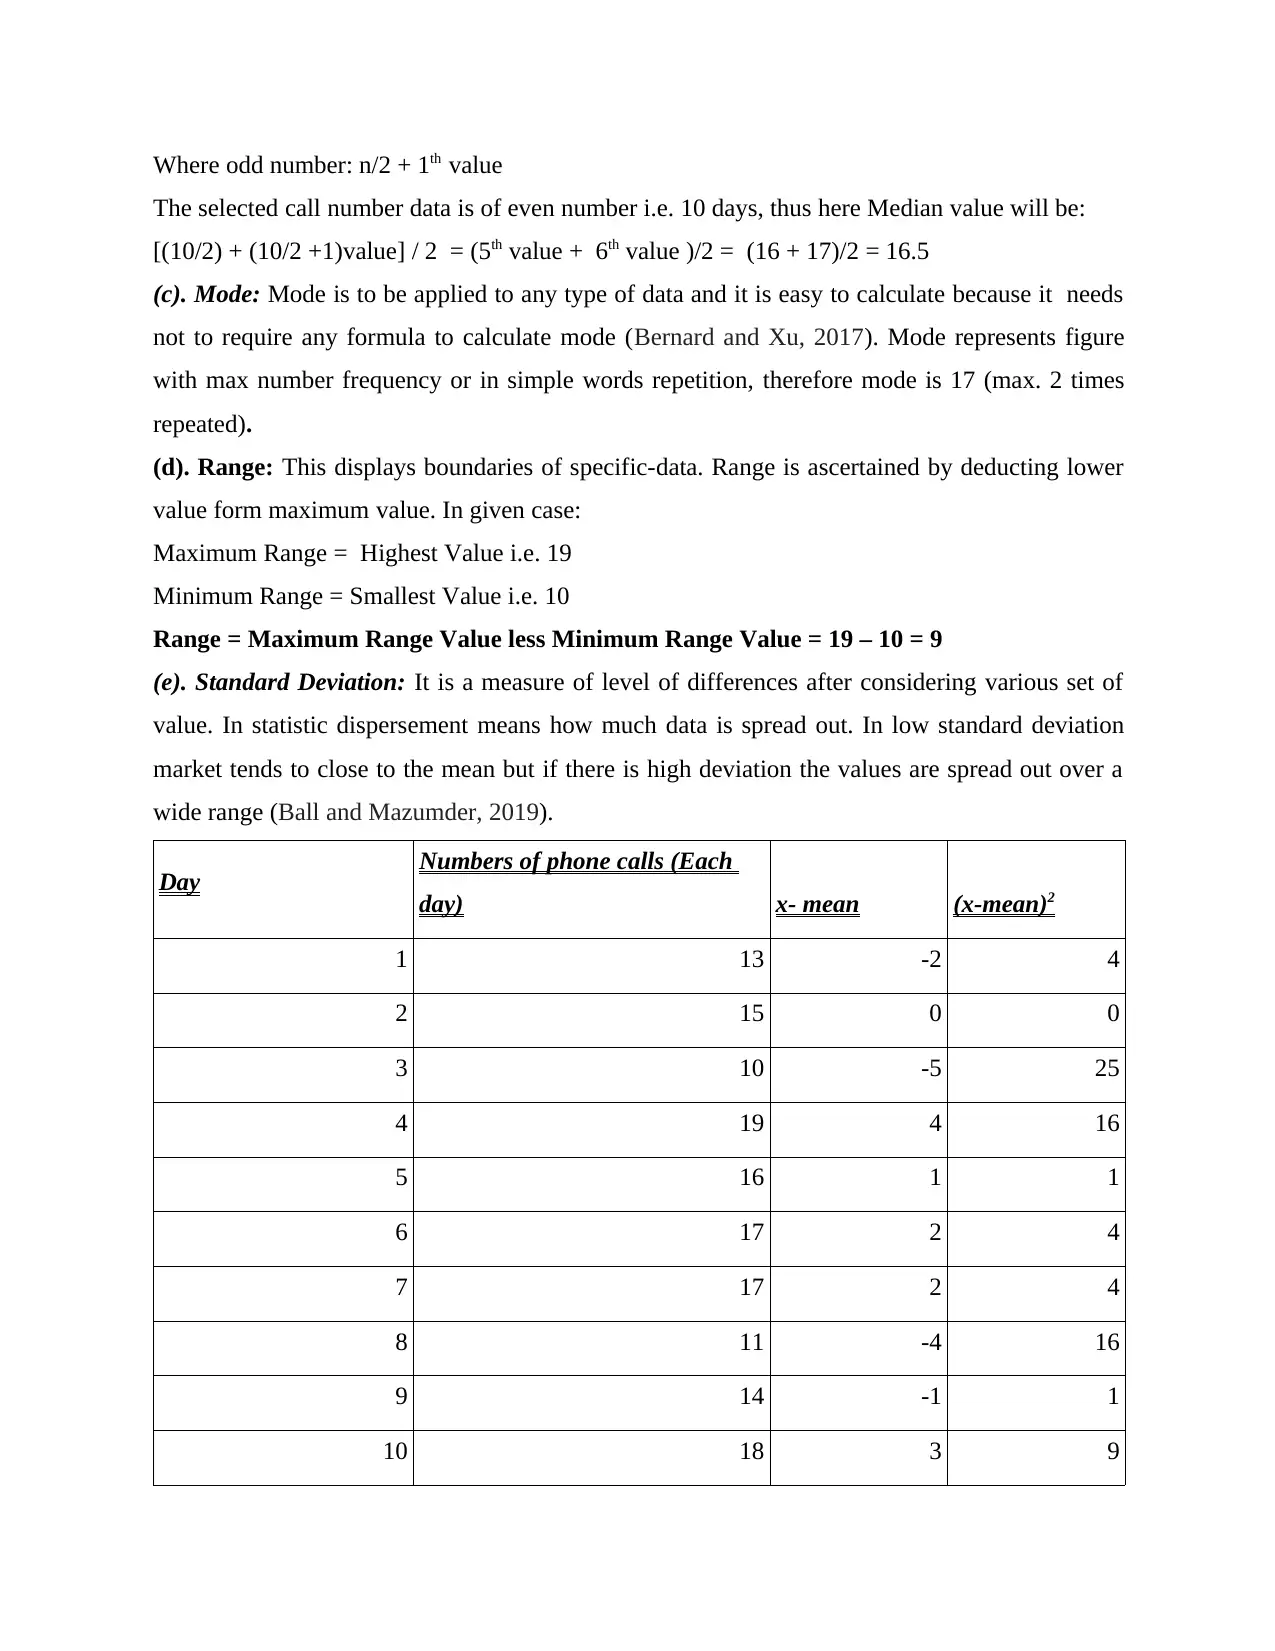
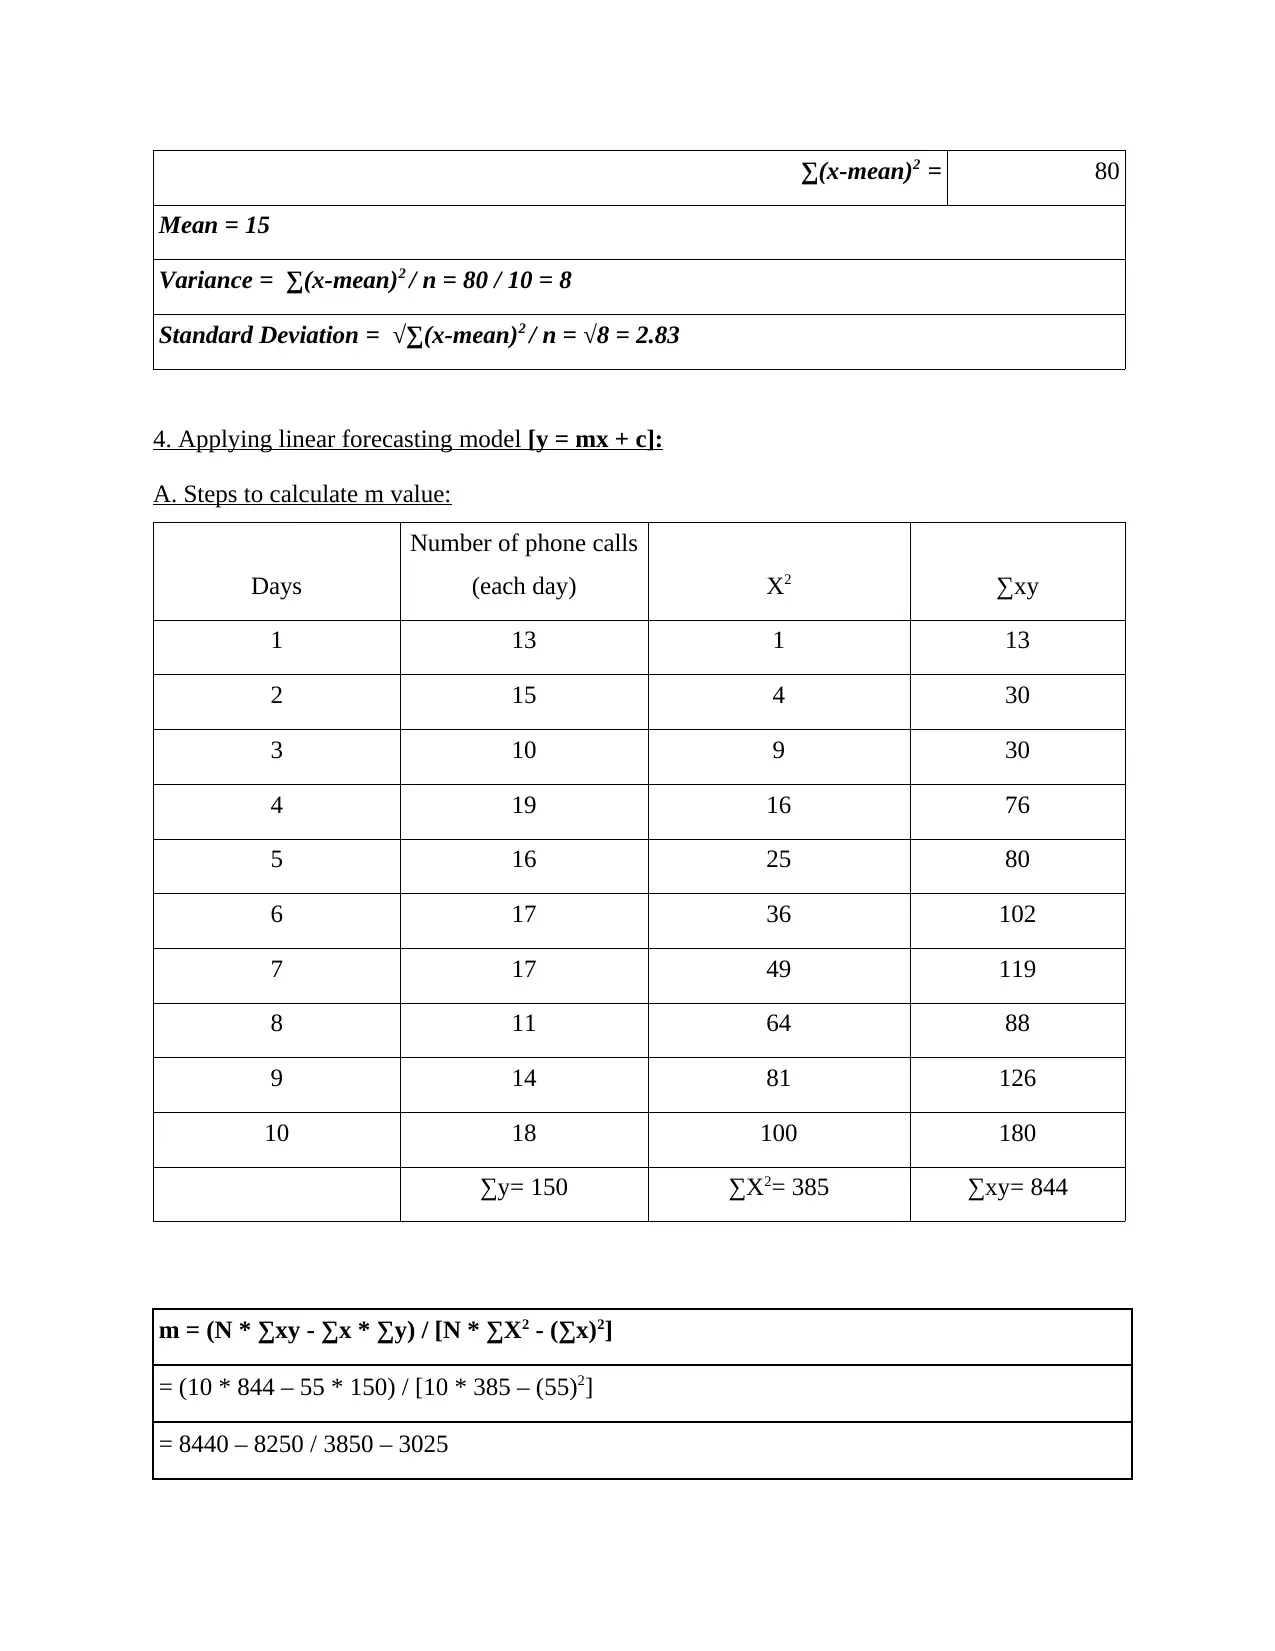
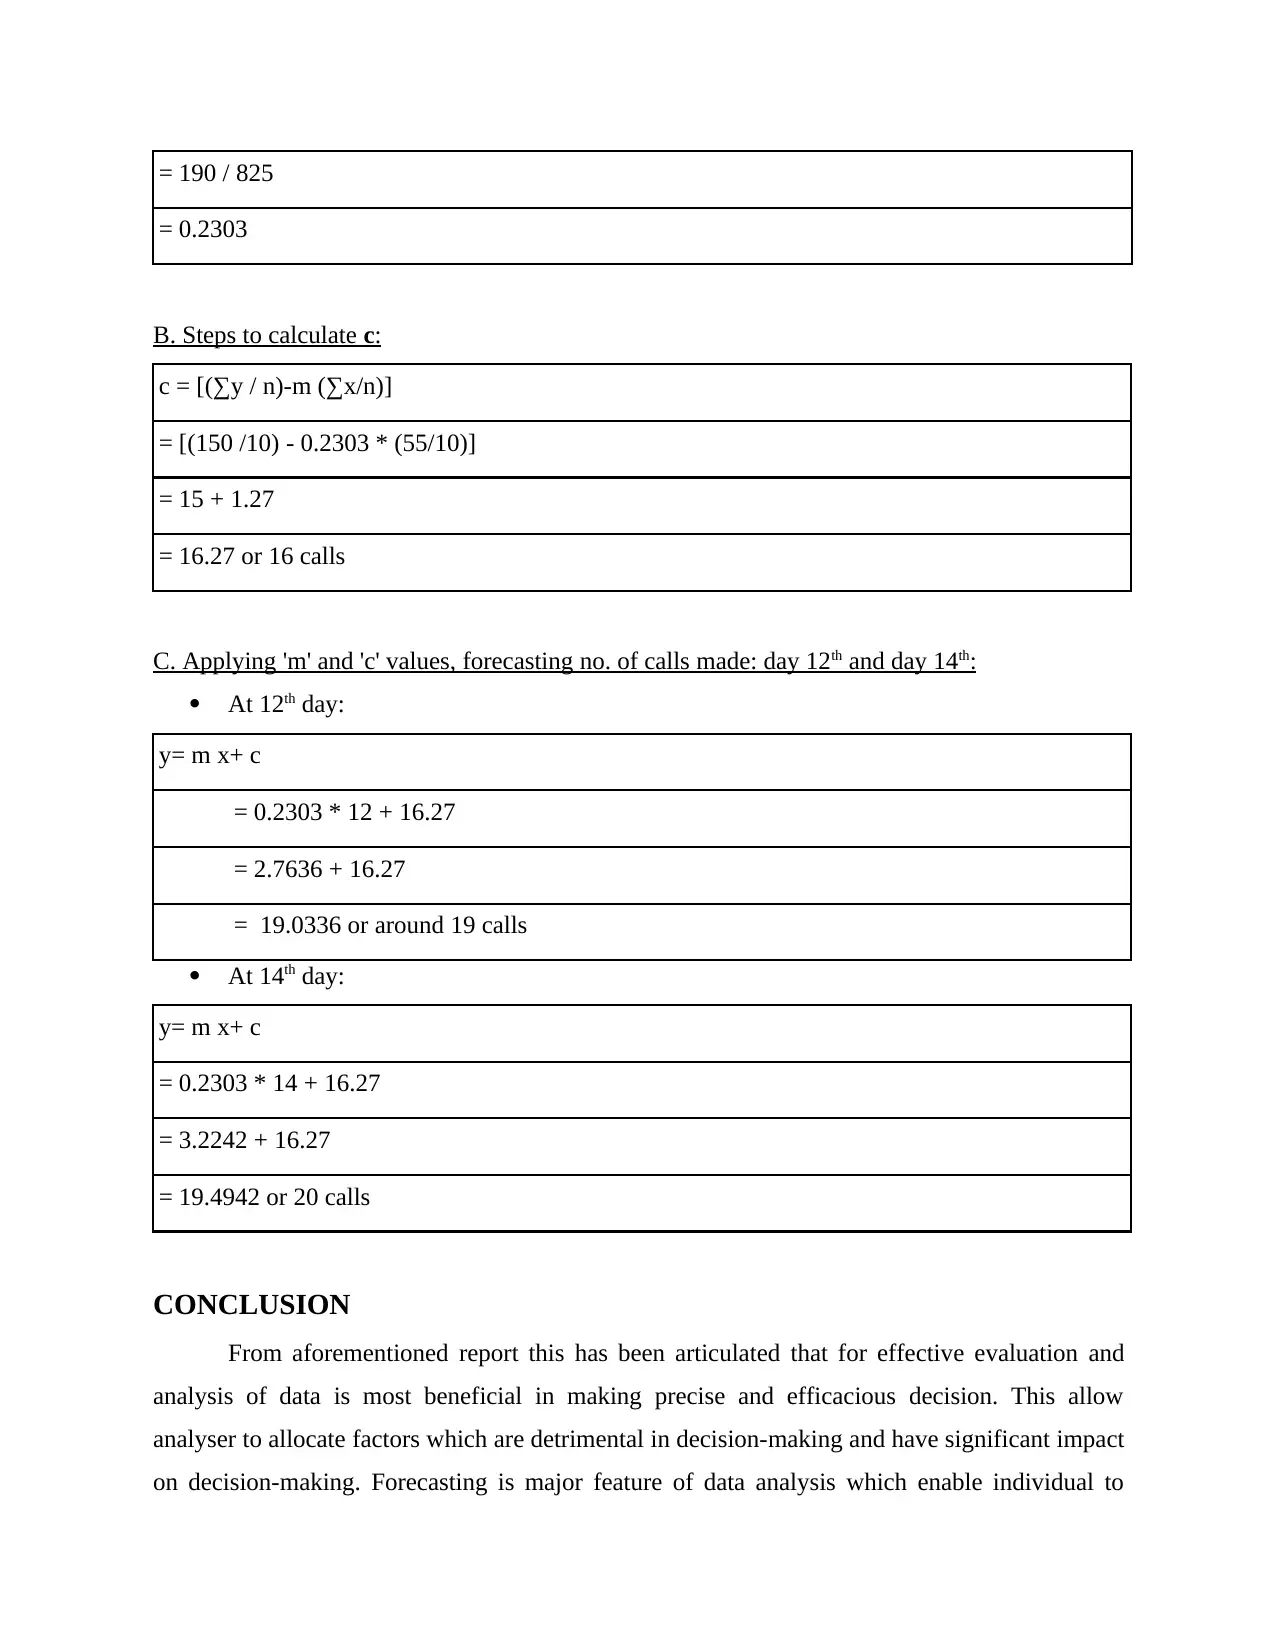
This report, prepared for a Numeracy and Data Analysis module at the London School of Commerce, details the process of analyzing a dataset of phone calls made over ten days. It begins by organizing the data into a table format and presenting it visually using column and line charts. The report then delves into statistical computations, calculating the mean, median, mode, range, and standard deviation of the data. Furthermore, it applies a linear forecasting model (y = mx + c) to predict the number of calls on the 12th and 14th days, including the steps taken to calculate the 'm' and 'c' values. The analysis is supported by relevant references. The report highlights the importance of data analysis in making informed decisions and demonstrates various techniques for data interpretation and forecasting. This report provides a clear understanding of data analysis and forecasting techniques, including data summarization, chart creation, statistical methods, and linear forecasting models.

Numeracy and Data
Analysis
Analysis
Paraphrase This Document
Need a fresh take? Get an instant paraphrase of this document with our AI Paraphraser

Table of Contents
INTRODUCTION...........................................................................................................................3
MAIN BODY..................................................................................................................................3
1. Arranging data into table format:...........................................................................................3
2. Present above data using charts:.............................................................................................3
3. Computation and thorough discussion on following:.............................................................5
4. Applying linear forecasting model [y = mx + c]:...................................................................7
A. Steps to calculate m value:.....................................................................................................7
B. Steps to calculate c:................................................................................................................7
C. Applying 'm' and 'c' values, forecasting no. of calls made: day 12th and day 14th:..............7
CONCLUSION...............................................................................................................................8
REFERENCES................................................................................................................................9

INTRODUCTION
One primary drivers of growth in today's data-rich era is learning how to interpret and
derive real meaning from data analysis. data analysis regarded as process that focuses on raw
data collecting methods and techniques, searching for insights related to primary objectives of
the organisation, and digging down into this knowledge to turn measurements, evidence, and
statistics into growth initiatives (Nelson and McMaster, 2019). This report highlights key
components of data analysis and related aspects like table presentation of data, statistics methods
(mean, mode, standard-deviation and median) and leaner-forecasting model.
MAIN BODY
1. Arranging data into table format:
Days Per day phone calls (Numbers)
1 13
2 15
3 10
4 19
5 16
6 17
7 17
8 11
9 14
10 18
The above attached table consist of data in two columns where first column shows
number of data and second column contains number of calls made on a particular day.
2. Present above data using charts:
Column chart: It is a vertical-bar chart having rectangular bars with height and lengths
proportionate to the values which represent data. We can easily make comparison between
⊘ This is a preview!⊘
Do you want full access?
Subscribe today to unlock all pages.

Trusted by 1+ million students worldwide

different categories by using column chart. It visualizes data to show change in attractive and
simple manner. It is easy add data labels at the end of bars.
Above column chart display columnar presentation of data of phone-calls on specific day
for all 10 days.
Line Graph: It is graphical presentation of data where several points are connected by straight
line it is also called line chart. It includes two axis horizontal axis is known as X axis and
vertical axis is known as Y axis. Line graph is a powerful visual tool for marketing (Khan and
et.al., 2019).
1 2 3 4 5 6 7 8 9 10
0
2
4
6
8
10
12
14
16
18
20
13
15
10
19
16 17 17
11
14
18
Number of phone calls (per
day)
1 2 3 4 5 6 7 8 9 10
0
2
4
6
8
10
12
14
16
18
20
13
15
10
19
16 17 17
11
14
18
Number of phone calls (per
day)
Paraphrase This Document
Need a fresh take? Get an instant paraphrase of this document with our AI Paraphraser

Above presented line chart indicates liner trend in number of calls during 10 consecutive
days. '
3. Computation and thorough discussion on following:
(a). Mean: In statistic-field, mean is the average of arithmetic numbers which is calculated by
adding all the numbers and then divide the total of these number with no of values. It is simple to
understand and easy to calculate. It takes all the values of series and gives accuracy by using
formula.
Day Phone calls (Numbers each day)
1 13
2 15
3 10
4 19
5 16
6 17
7 17
8 11
9 14
10 18
∑x = Aggregate total of no. of 10 days phone calls = 150
Mean = ∑x / n = 150 / 10 = 15
(b). Median: In median firstly the values are arranged in ascending and descending order and
than the middle value is to be calculated. It divides frequency distribution in two equal halves. It
can be determine for ratio, interval ordinal sale. There are two types of observation is involved
like even and odd, calculation in both observation is done by applying different formulas
(Krause and Rädler, 2016).
Where even number: [n/2th + (n/2 + 1)th value] / 2

Where odd number: n/2 + 1th value
The selected call number data is of even number i.e. 10 days, thus here Median value will be:
[(10/2) + (10/2 +1)value] / 2 = (5th value + 6th value )/2 = (16 + 17)/2 = 16.5
(c). Mode: Mode is to be applied to any type of data and it is easy to calculate because it needs
not to require any formula to calculate mode (Bernard and Xu, 2017). Mode represents figure
with max number frequency or in simple words repetition, therefore mode is 17 (max. 2 times
repeated).
(d). Range: This displays boundaries of specific-data. Range is ascertained by deducting lower
value form maximum value. In given case:
Maximum Range = Highest Value i.e. 19
Minimum Range = Smallest Value i.e. 10
Range = Maximum Range Value less Minimum Range Value = 19 – 10 = 9
(e). Standard Deviation: It is a measure of level of differences after considering various set of
value. In statistic dispersement means how much data is spread out. In low standard deviation
market tends to close to the mean but if there is high deviation the values are spread out over a
wide range (Ball and Mazumder, 2019).
Day Numbers of phone calls (Each
day) x- mean (x-mean)2
1 13 -2 4
2 15 0 0
3 10 -5 25
4 19 4 16
5 16 1 1
6 17 2 4
7 17 2 4
8 11 -4 16
9 14 -1 1
10 18 3 9
⊘ This is a preview!⊘
Do you want full access?
Subscribe today to unlock all pages.

Trusted by 1+ million students worldwide

∑(x-mean)2 = 80
Mean = 15
Variance = ∑(x-mean)2 / n = 80 / 10 = 8
Standard Deviation = √∑(x-mean)2 / n = √8 = 2.83
4. Applying linear forecasting model [y = mx + c]:
A. Steps to calculate m value:
Days
Number of phone calls
(each day) X2 ∑xy
1 13 1 13
2 15 4 30
3 10 9 30
4 19 16 76
5 16 25 80
6 17 36 102
7 17 49 119
8 11 64 88
9 14 81 126
10 18 100 180
∑y= 150 ∑X2= 385 ∑xy= 844
m = (N * ∑xy - ∑x * ∑y) / [N * ∑X2 - (∑x)2]
= (10 * 844 – 55 * 150) / [10 * 385 – (55)2]
= 8440 – 8250 / 3850 – 3025
Paraphrase This Document
Need a fresh take? Get an instant paraphrase of this document with our AI Paraphraser

= 190 / 825
= 0.2303
B. Steps to calculate c:
c = [(∑y / n)-m (∑x/n)]
= [(150 /10) - 0.2303 * (55/10)]
= 15 + 1.27
= 16.27 or 16 calls
C. Applying 'm' and 'c' values, forecasting no. of calls made: day 12th and day 14th:
At 12th day:
y= m x+ c
= 0.2303 * 12 + 16.27
= 2.7636 + 16.27
= 19.0336 or around 19 calls
At 14th day:
y= m x+ c
= 0.2303 * 14 + 16.27
= 3.2242 + 16.27
= 19.4942 or 20 calls
CONCLUSION
From aforementioned report this has been articulated that for effective evaluation and
analysis of data is most beneficial in making precise and efficacious decision. This allow
analyser to allocate factors which are detrimental in decision-making and have significant impact
on decision-making. Forecasting is major feature of data analysis which enable individual to

make appropriate estimates and projections for future. There are wide range of methods and
techniques which are helpful in analysis of data from different perspectives.
⊘ This is a preview!⊘
Do you want full access?
Subscribe today to unlock all pages.

Trusted by 1+ million students worldwide

REFERENCES
Books and Journals:
Nelson, G. and McMaster, K.L., 2019. The effects of early numeracy interventions for students
in preschool and early elementary: A meta-analysis. Journal of Educational
Psychology, 111(6), p.1001.
Khan, M. and et.al., 2019. EVALUATING INTERACTIVE VISUALIZATION TECHNIQUES
ON SMALL TOUCH SCREEN DEVICES. International Journal of Grid and
Distributed Computing (IJGDC), 12(02), pp.31-48.
Krause, F. and Rädler, K. H., 2016. Mean-field magnetohydrodynamics and dynamo theory.
Elsevier.
Ball, L. M. and Mazumder, S., 2019. The nonpuzzling behavior of median inflation (No.
w25512). National Bureau of Economic Research.
Bernard, E.S. and Xu, G.G., 2017. Estimation of Population Standard Deviation for Post-Crack
Performance of Fiber-Reinforced Concrete. Advances in Civil Engineering Materials.
6(1). pp.68-82.
1 out of 10
Related Documents

Your All-in-One AI-Powered Toolkit for Academic Success.
+13062052269
info@desklib.com
Available 24*7 on WhatsApp / Email
Unlock your academic potential
Copyright © 2020–2025 A2Z Services. All Rights Reserved. Developed and managed by ZUCOL.