Data Analysis and Forecasting Report on Monthly Expenses and Trends

Verified

Added on  2022/12/28

|11
|1440
|60
Report
AI Summary
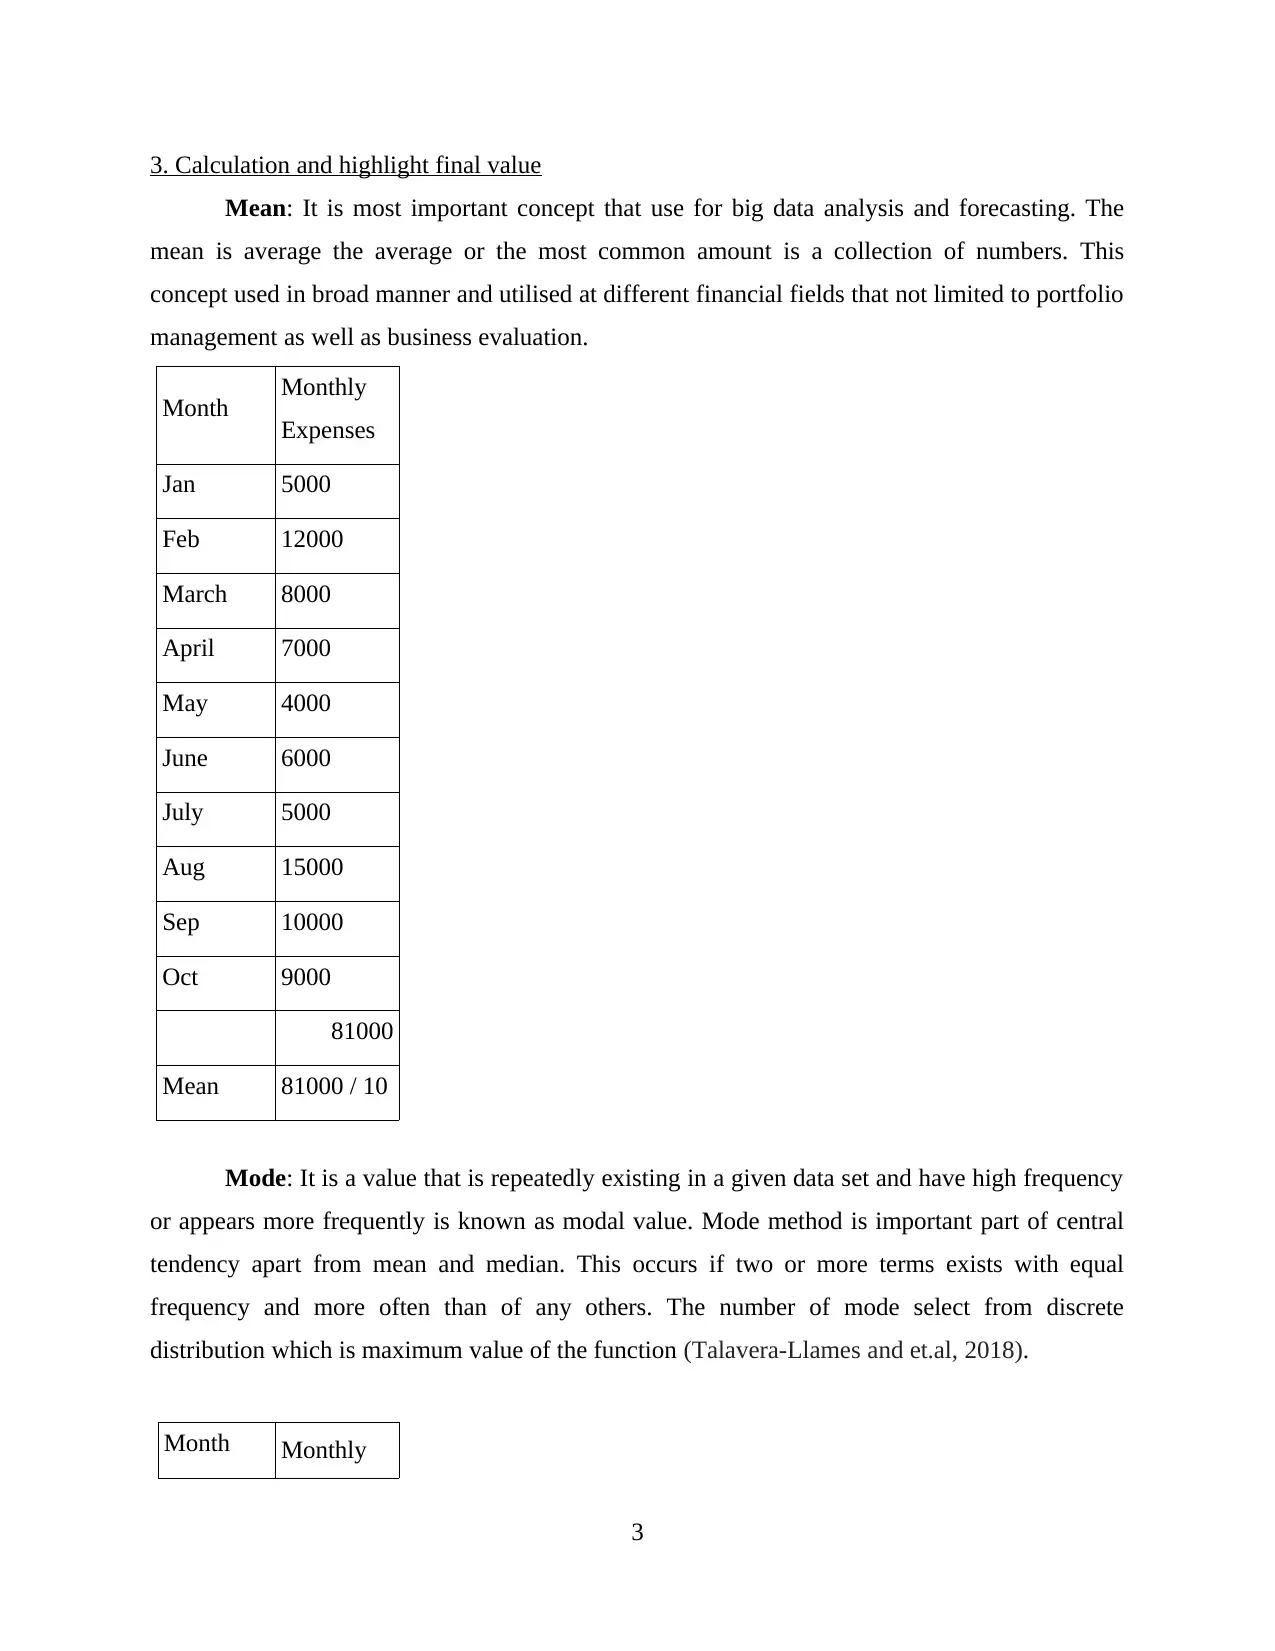
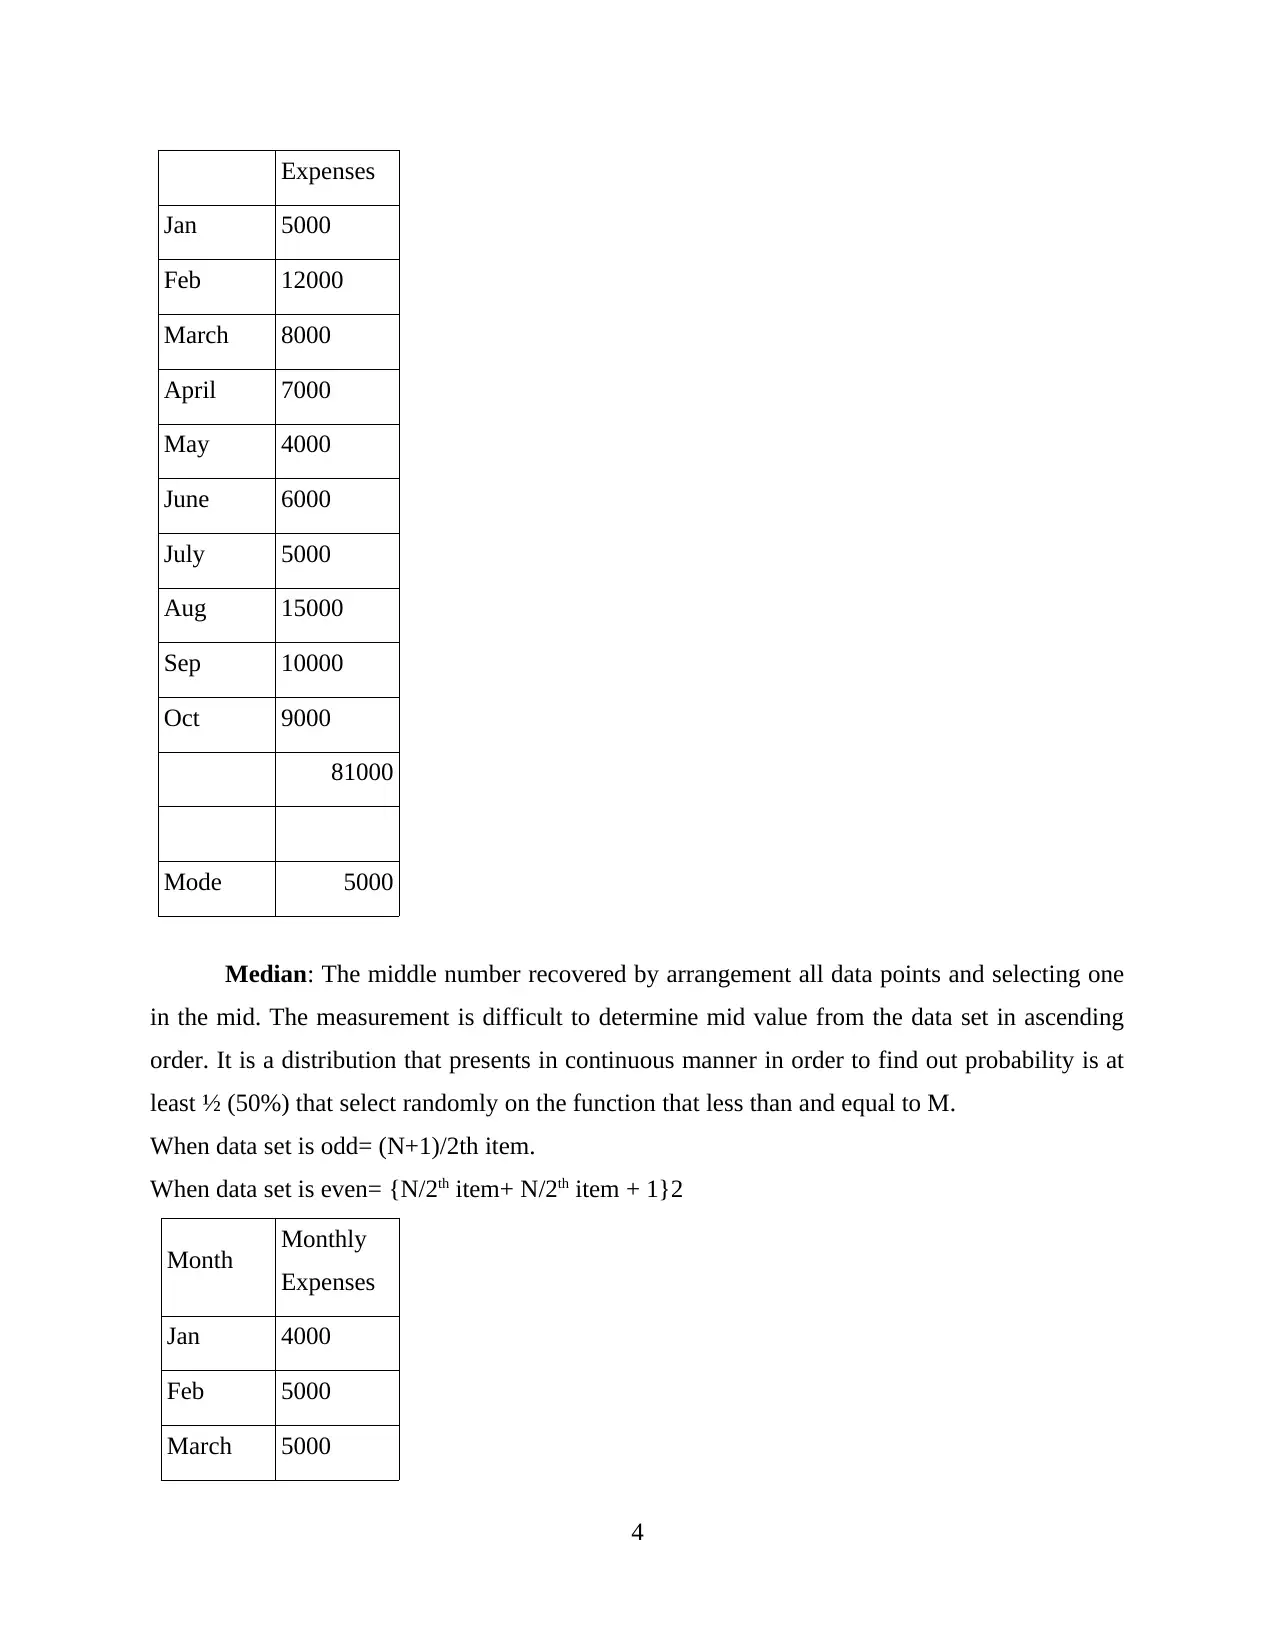
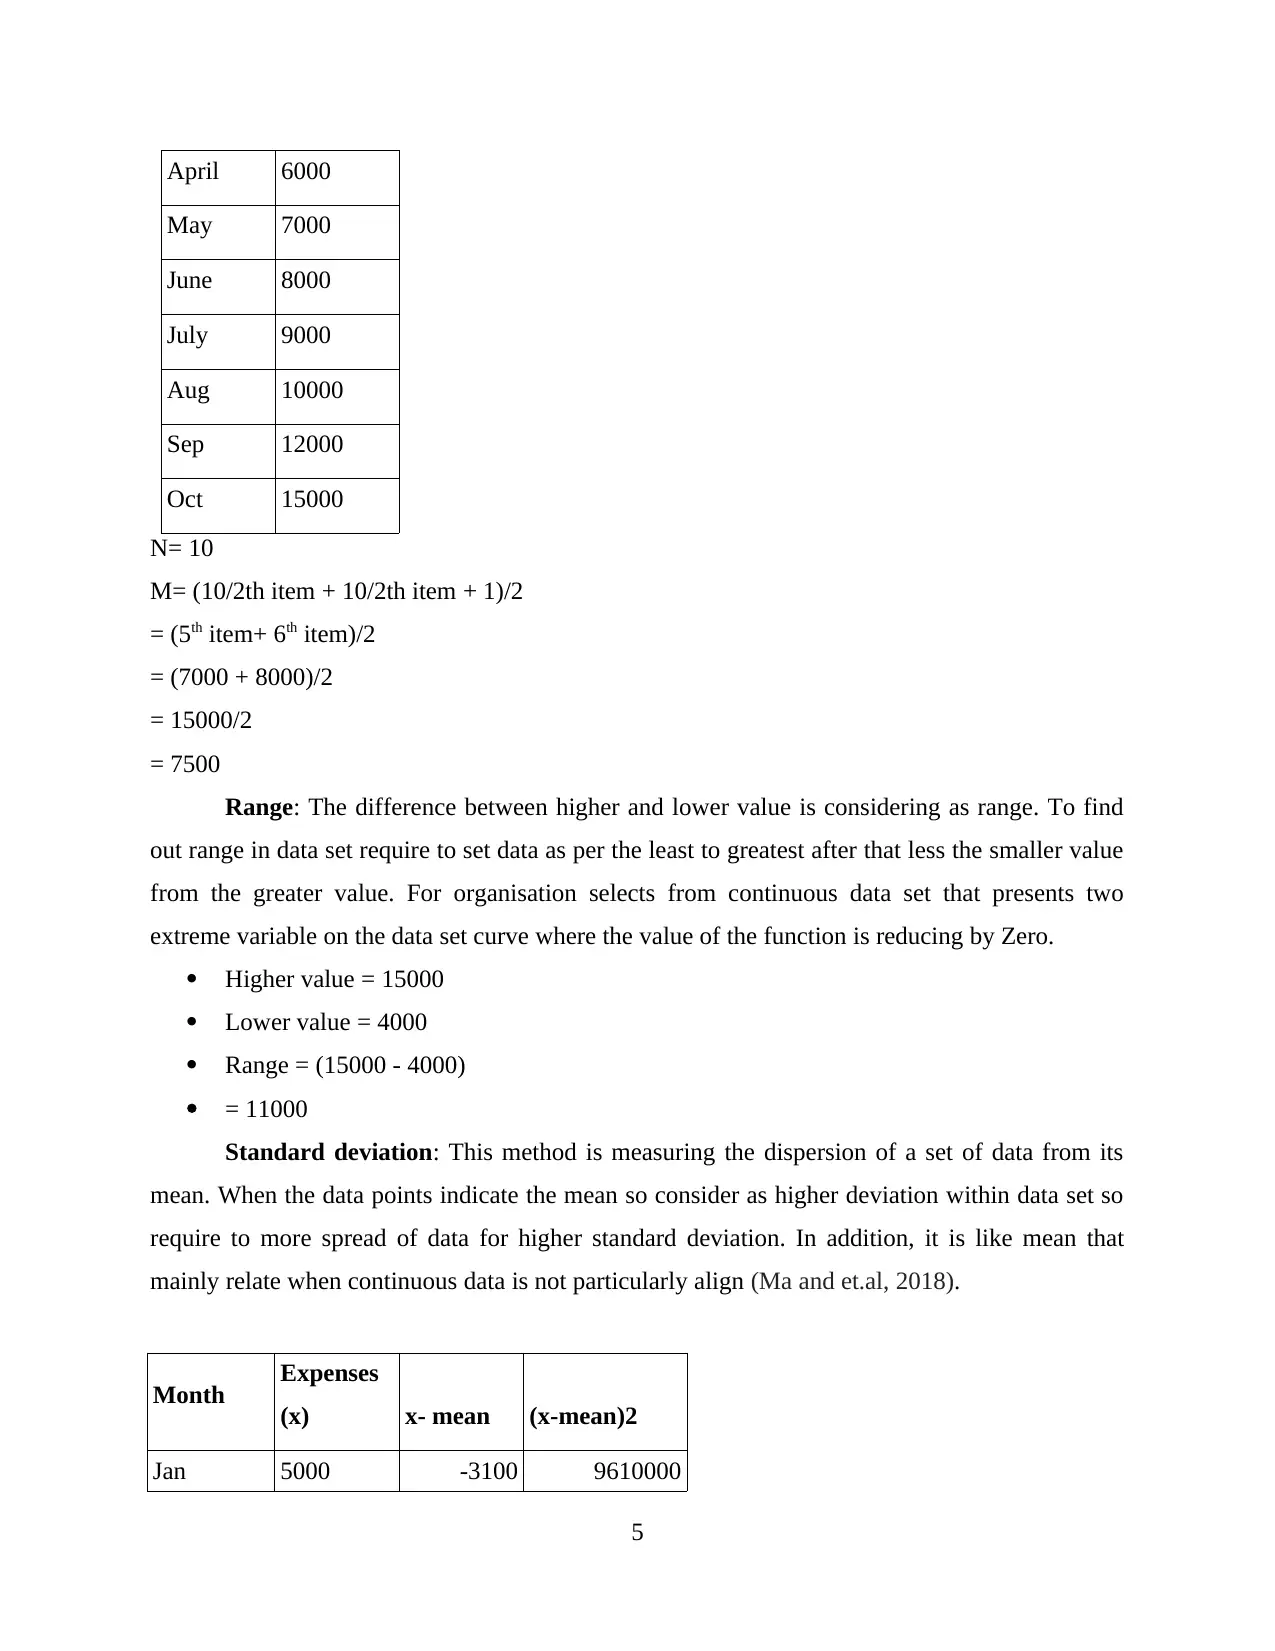
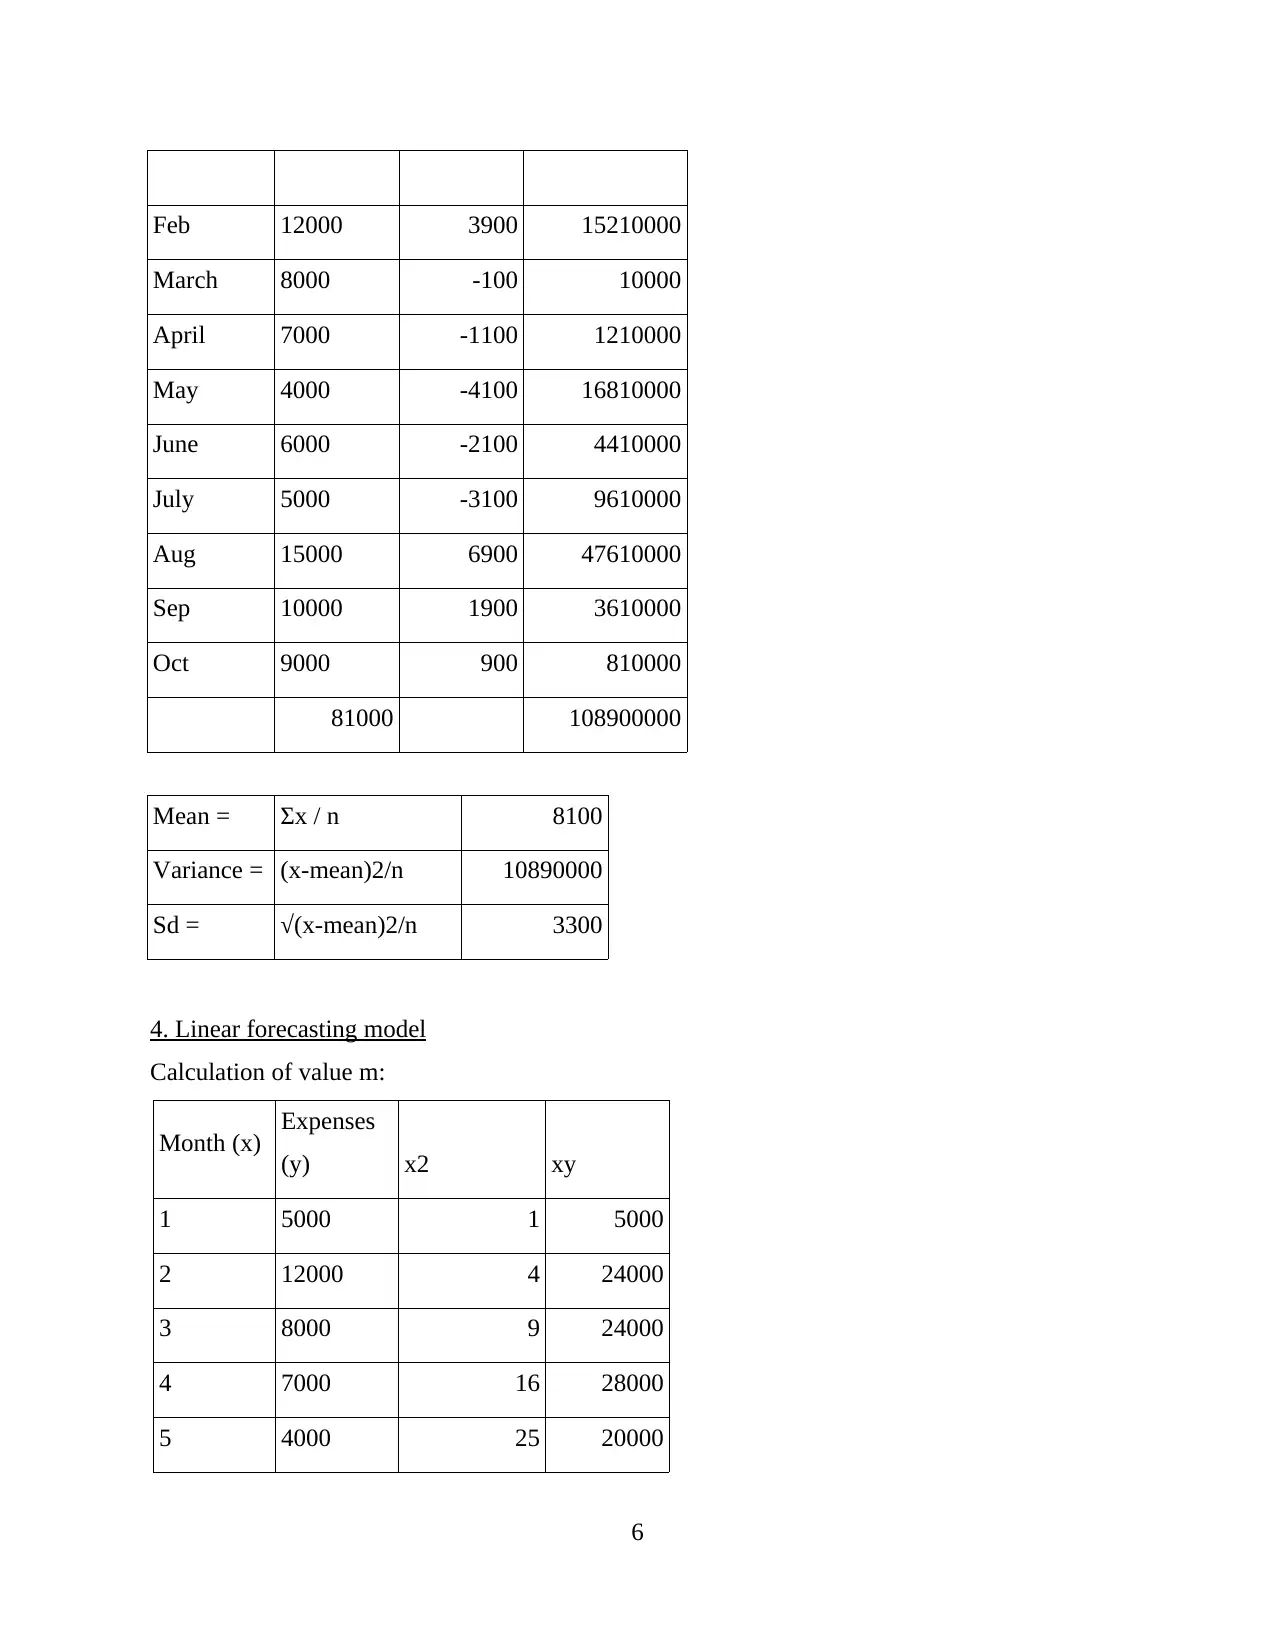
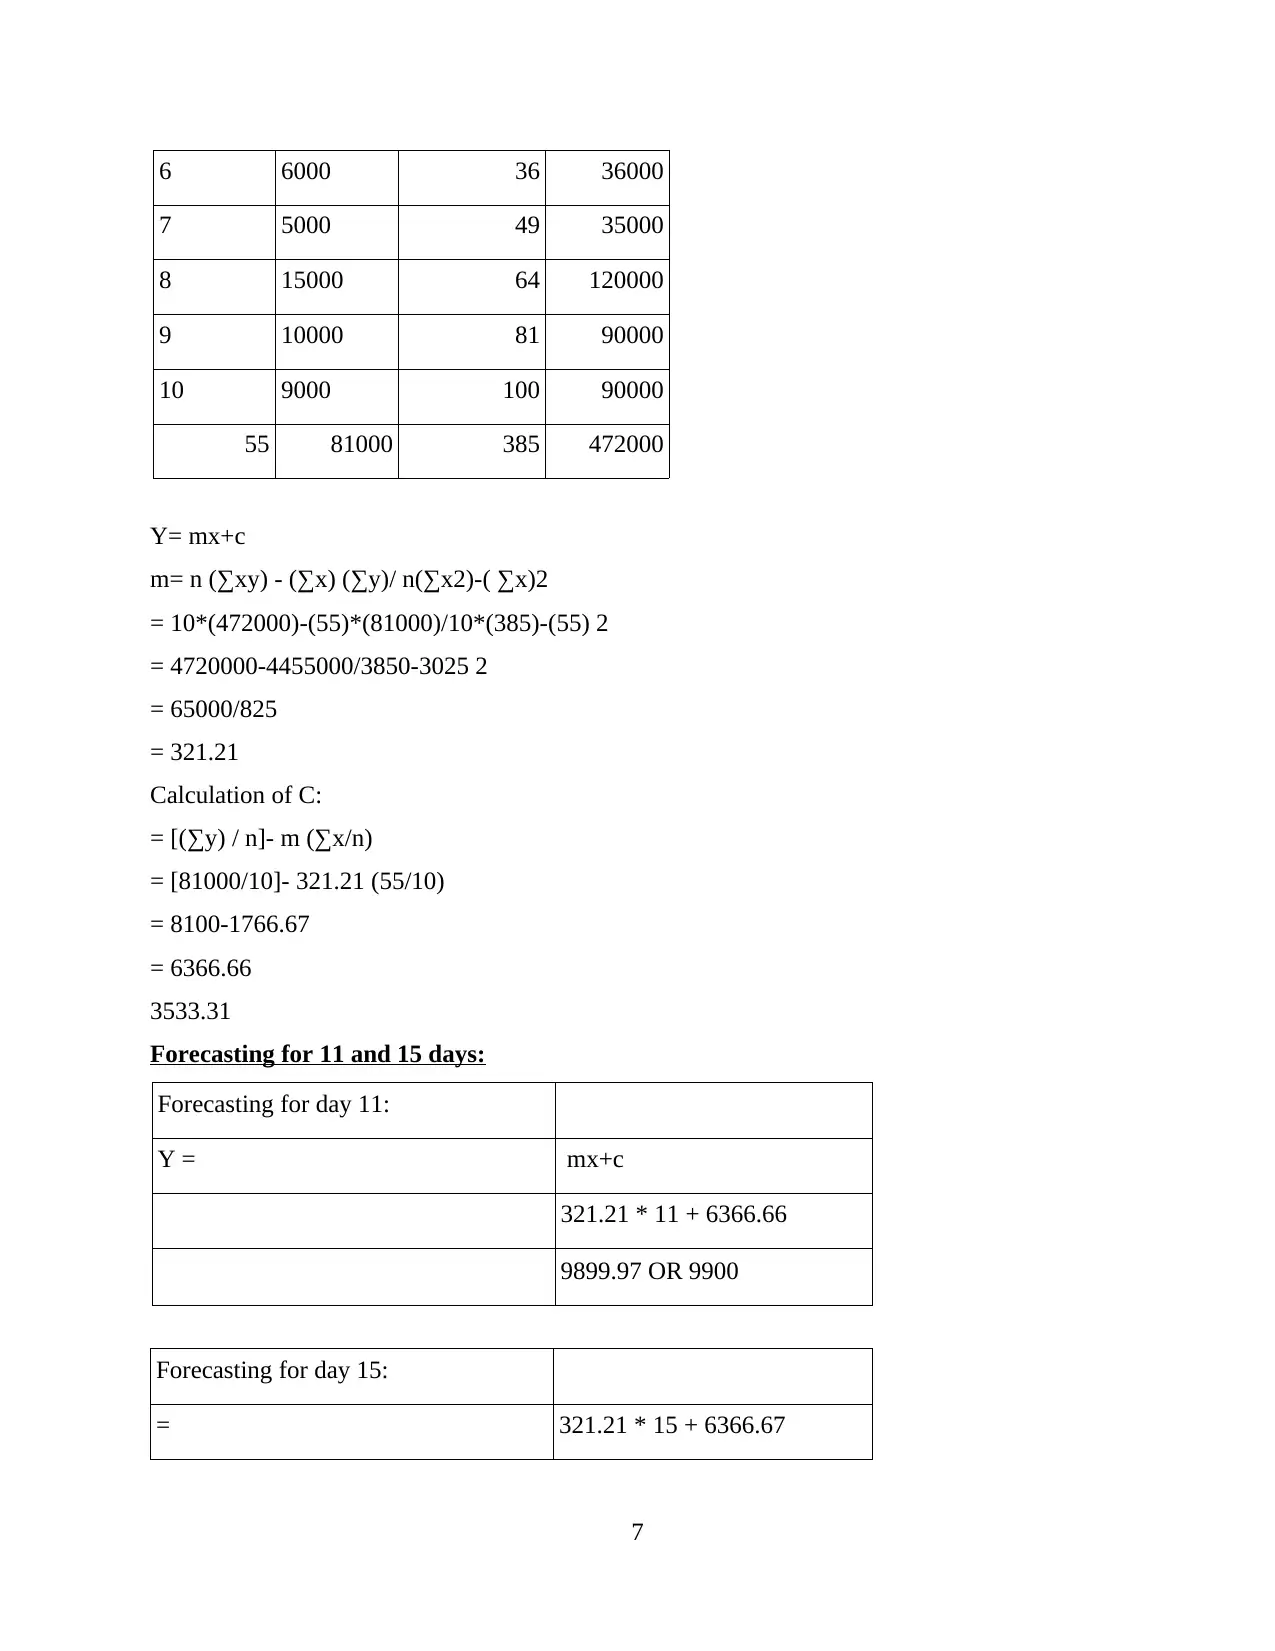
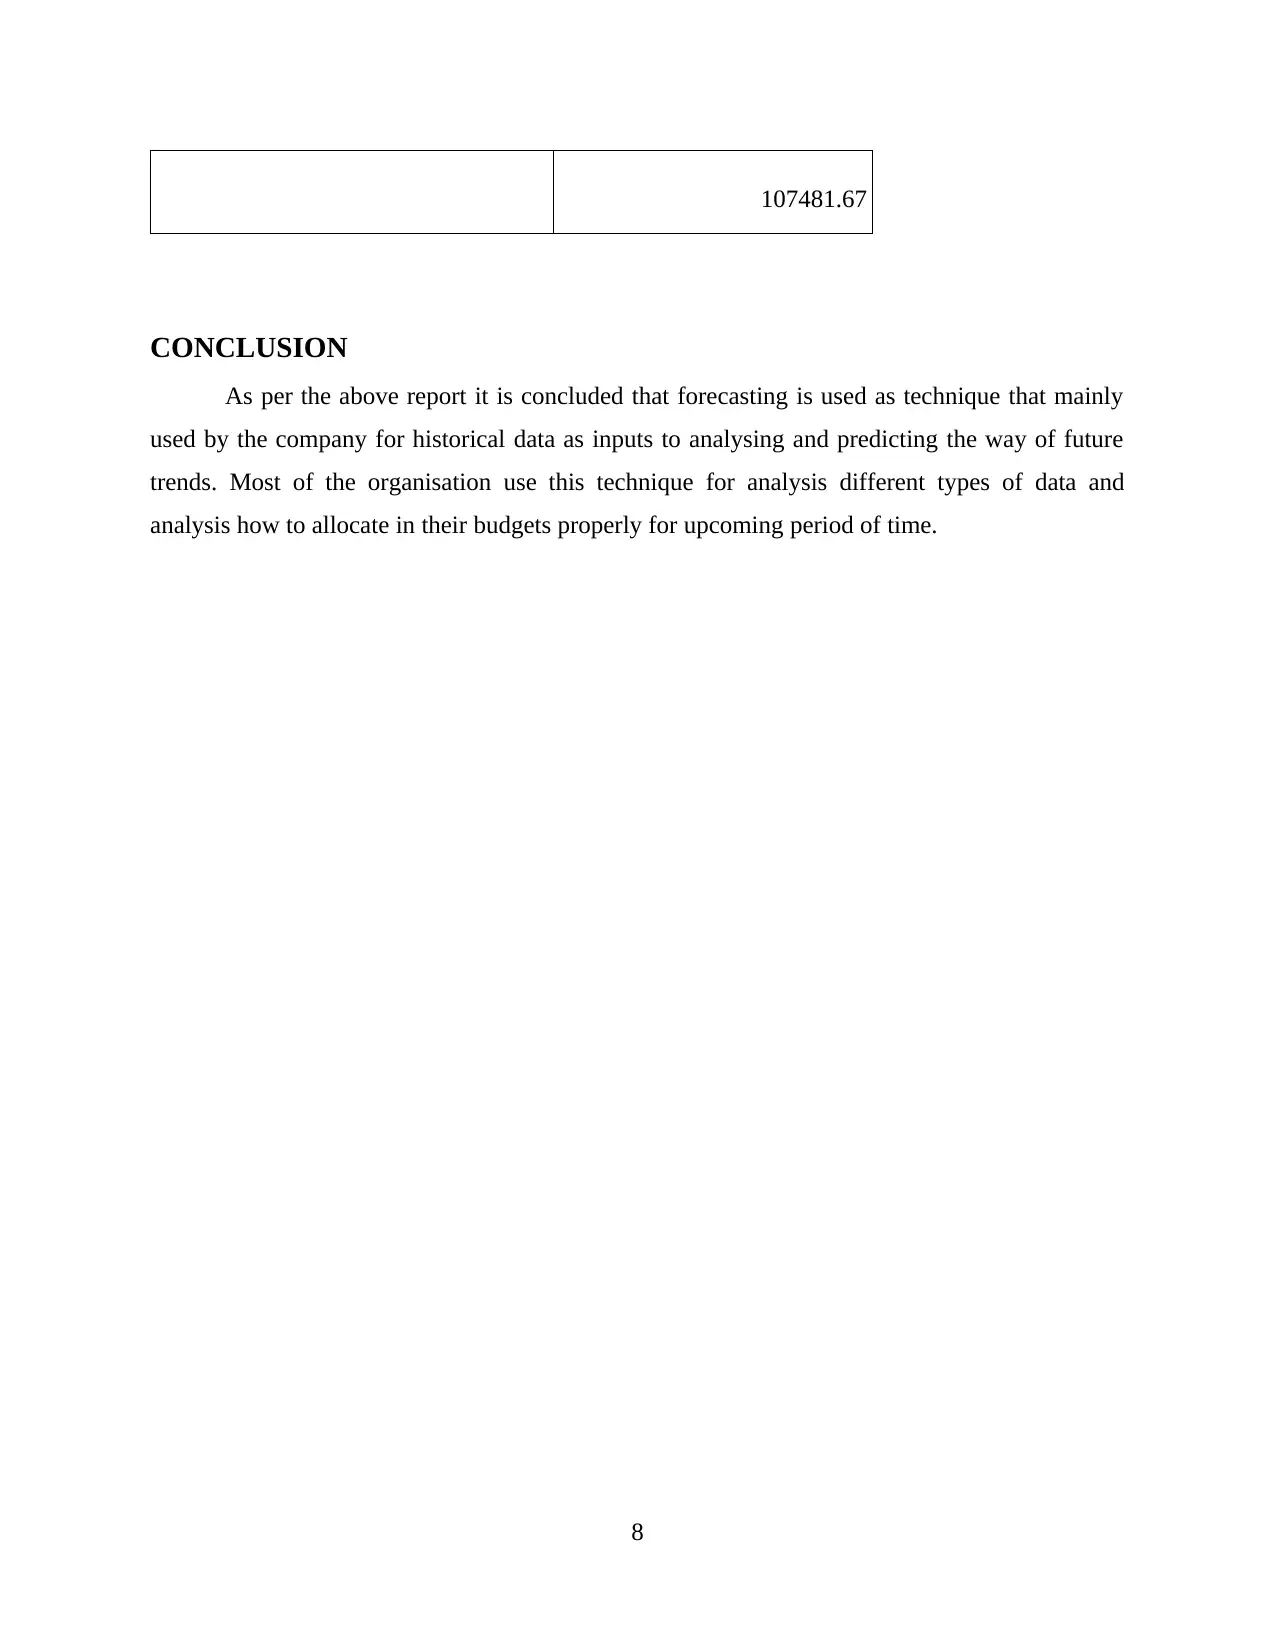
This report presents a comprehensive analysis of monthly expense data, employing various data analysis techniques to derive meaningful insights and predict future trends. The report begins with data presented in a table format, followed by data visualization using column and bar charts to illustrate expense trends. The core of the analysis includes calculations of mean, mode, median, range, and standard deviation to understand the central tendencies and dispersion of the data. Furthermore, a linear forecasting model is developed and applied to predict expenses for future periods, specifically for days 11 and 15. The report concludes with a summary of findings and references to relevant sources, demonstrating the practical application of data analysis in business decision-making and budgeting.
Document Page
Data Analysis and
Forecasting
tabler-icon-diamond-filled.svg

Paraphrase This Document

Need a fresh take? Get an instant paraphrase of this document with our AI Paraphraser
Document Page
Table of Contents
INTRODUCTION...........................................................................................................................1
MAIN BODY...................................................................................................................................1
1. Data in table format.................................................................................................................1
2. Using two types of chart.........................................................................................................1
3. Calculation and highlight final value......................................................................................2
4. Linear forecasting model.........................................................................................................5
CONCLUSION................................................................................................................................7
REFERENCES................................................................................................................................8
Document Page
INTRODUCTION
Forecasting is a procedure of making assumptions of the future based on past and present
data and most ordinarily by investigation of trends. In can context, data must be updated in order
to predict to accurate and possible things in future In many cases data predict for the variable of
interest is itself forecast (Zhang and et.al, 2019). To conduct any business activities require to
analysis data to carry out all important information that supports in decision making procedure in
business. This report based on the total expenses per month. For the analysis of such expenses
use different techniques of data analysis like mean, mode, median and standard deviation.
MAIN BODY
1. Data in table format
Month Monthly
Expenses
Jan 5000
Feb 12000
March 8000
April 7000
May 4000
June 6000
July 5000
Aug 15000
Sep 10000
Oct 9000
2. Using two types of chart
Column chart: This chart is used to compare values of data from various categories that
compare data in specified period of time. Since all column begin from the same baseline of 0 and
it is simple to compare of columns against each other. For the understanding of changes require
1
Document Page
to presenting data in proper manner. In an entity the owner wants to compare their profits of
different department so for this prepare of this budget that helps to present profitability and
analysis easily (Ahmad and Chen, 2018).
Ja n
Ma rc h
Ma y
July
S ep
0 2000 4000 6000 8000 10000 12000 14000 16000
5000
12000
8000
7000
4000
6000
5000
15000
10000
9000
M o n t h ly E x p e n s e s
Monthly Ex pens es
Bar chart: This chart represents the collection of data using rectangular bars and presents
the comparison between discrete categories. It is mainly using with vertical columns,
comparative bars and staked bars. In this chart represents financial analysis of displaying data
that depicts profitability distribution of data as sample.
Ja n Fe b Ma rch April Ma y June July Aug S ep
0
2000
4000
6000
8000
10000
12000
14000
16000
5000
12000
8000 7000
4000
6000 5000
15000
10000
M o n t h ly E x p e n s e s
Monthly E x pens es
2
tabler-icon-diamond-filled.svg

Paraphrase This Document

Need a fresh take? Get an instant paraphrase of this document with our AI Paraphraser
Document Page
3. Calculation and highlight final value
Mean: It is most important concept that use for big data analysis and forecasting. The
mean is average the average or the most common amount is a collection of numbers. This
concept used in broad manner and utilised at different financial fields that not limited to portfolio
management as well as business evaluation.
Month Monthly
Expenses
Jan 5000
Feb 12000
March 8000
April 7000
May 4000
June 6000
July 5000
Aug 15000
Sep 10000
Oct 9000
81000
Mean 81000 / 10
Mode: It is a value that is repeatedly existing in a given data set and have high frequency
or appears more frequently is known as modal value. Mode method is important part of central
tendency apart from mean and median. This occurs if two or more terms exists with equal
frequency and more often than of any others. The number of mode select from discrete
distribution which is maximum value of the function (Talavera-Llames and et.al, 2018).
Month Monthly
3
Document Page
Expenses
Jan 5000
Feb 12000
March 8000
April 7000
May 4000
June 6000
July 5000
Aug 15000
Sep 10000
Oct 9000
81000
Mode 5000
Median: The middle number recovered by arrangement all data points and selecting one
in the mid. The measurement is difficult to determine mid value from the data set in ascending
order. It is a distribution that presents in continuous manner in order to find out probability is at
least ½ (50%) that select randomly on the function that less than and equal to M.
When data set is odd= (N+1)/2th item.
When data set is even= {N/2th item+ N/2th item + 1}2
Month Monthly
Expenses
Jan 4000
Feb 5000
March 5000
4
Document Page
April 6000
May 7000
June 8000
July 9000
Aug 10000
Sep 12000
Oct 15000
N= 10
M= (10/2th item + 10/2th item + 1)/2
= (5th item+ 6th item)/2
= (7000 + 8000)/2
= 15000/2
= 7500
Range: The difference between higher and lower value is considering as range. To find
out range in data set require to set data as per the least to greatest after that less the smaller value
from the greater value. For organisation selects from continuous data set that presents two
extreme variable on the data set curve where the value of the function is reducing by Zero.
Higher value = 15000
Lower value = 4000
Range = (15000 - 4000)
= 11000
Standard deviation: This method is measuring the dispersion of a set of data from its
mean. When the data points indicate the mean so consider as higher deviation within data set so
require to more spread of data for higher standard deviation. In addition, it is like mean that
mainly relate when continuous data is not particularly align (Ma and et.al, 2018).
Month Expenses
(x) x- mean (x-mean)2
Jan 5000 -3100 9610000
5
tabler-icon-diamond-filled.svg

Paraphrase This Document

Need a fresh take? Get an instant paraphrase of this document with our AI Paraphraser
Document Page
Feb 12000 3900 15210000
March 8000 -100 10000
April 7000 -1100 1210000
May 4000 -4100 16810000
June 6000 -2100 4410000
July 5000 -3100 9610000
Aug 15000 6900 47610000
Sep 10000 1900 3610000
Oct 9000 900 810000
81000 108900000
Mean = Σx / n 8100
Variance = (x-mean)2/n 10890000
Sd = √(x-mean)2/n 3300
4. Linear forecasting model
Calculation of value m:
Month (x) Expenses
(y) x2 xy
1 5000 1 5000
2 12000 4 24000
3 8000 9 24000
4 7000 16 28000
5 4000 25 20000
6
Document Page
6 6000 36 36000
7 5000 49 35000
8 15000 64 120000
9 10000 81 90000
10 9000 100 90000
55 81000 385 472000
Y= mx+c
m= n (∑xy) - (∑x) (∑y)/ n(∑x2)-( ∑x)2
= 10*(472000)-(55)*(81000)/10*(385)-(55) 2
= 4720000-4455000/3850-3025 2
= 65000/825
= 321.21
Calculation of C:
= [(∑y) / n]- m (∑x/n)
= [81000/10]- 321.21 (55/10)
= 8100-1766.67
= 6366.66
3533.31
Forecasting for 11 and 15 days:
Forecasting for day 11:
Y = mx+c
321.21 * 11 + 6366.66
9899.97 OR 9900
Forecasting for day 15:
= 321.21 * 15 + 6366.67
7
Document Page
107481.67
CONCLUSION
As per the above report it is concluded that forecasting is used as technique that mainly
used by the company for historical data as inputs to analysing and predicting the way of future
trends. Most of the organisation use this technique for analysis different types of data and
analysis how to allocate in their budgets properly for upcoming period of time.
8
tabler-icon-diamond-filled.svg

Paraphrase This Document

Need a fresh take? Get an instant paraphrase of this document with our AI Paraphraser
Document Page
REFERENCES
Books and Journals
Zhang, J. and et.al, 2019. Short-term forecasting and uncertainty analysis of wind turbine power
based on long short-term memory network and Gaussian mixture model. Applied
Energy. 241. pp.229-244.
Ahmad, T. and Chen, H., 2018. Short and medium-term forecasting of cooling and heating load
demand in building environment with data-mining based approaches. Energy and
Buildings. 166. pp.460-476.
Ma, F. and et.al, 2018. Are low-frequency data really uninformative? A forecasting combination
perspective. The North American Journal of Economics and Finance. 44. pp.92-108.
Talavera-Llames, R. and et.al, 2018. Big data time series forecasting based on nearest neighbours
distributed computing with Spark. Knowledge-Based Systems. 161. pp.12-25.
9
chevron_up_icon
1 out of 11
circle_padding
hide_on_mobile
zoom_out_icon
[object Object]